Part 9 Trading Master Class Moneyness of Options
Options are categorized based on their relationship to the current market price:
In-the-Money (ITM) – Option has intrinsic value
At-the-Money (ATM) – Strike price is near the market price
Out-of-the-Money (OTM) – Option has no intrinsic value
ATM options are most sensitive to price movement, while OTM options are cheaper but require larger moves to become profitable.
Trendcontinuationpatterns

Part 8 Trading Master Class Option Pricing and the Role of Greeks
Option prices are influenced by multiple factors, not just price direction. These influences are measured by Option Greeks:
Delta – Measures how much the option price changes for a 1-point move in the underlying
Gamma – Measures the rate of change of delta
Theta – Measures time decay; options lose value as expiry approaches
Vega – Measures sensitivity to changes in volatility
Rho – Measures impact of interest rate changes
Understanding Greeks helps traders manage risk, select strategies, and anticipate how options behave under different market conditions.

Part 2 Intraday Trading Master ClassNon-Directional (Range-Bound) Strategies
These strategies profit when the market does not move much.
Short Straddle Strategy
Concept: Sell Call + Sell Put at same strike.
Profit: Premium received
Risk: Unlimited
Best Market Condition: Low volatility, sideways market
Use Case:
When expecting very low movement, typically before event expiry.
Warning:
High-risk strategy, requires strict risk management.

Part 1 Intraday Trading Master Class Covered Call Strategy (Moderately Bullish)
Concept: Hold shares and sell a call option.
Profit: Limited
Risk: Stock downside risk remains
Best Market Condition: Mild uptrend or sideways
Use Case:
Ideal for long-term investors to earn regular income.

Trading Breakouts and Fakeouts How to Identify Real Opportunities and Avoid Traps
Trading breakouts and fakeouts is one of the most popular yet challenging approaches in the financial markets. Traders across equities, commodities, forex, and derivatives closely watch key price levels where the market is expected to make a decisive move. While breakouts can lead to strong, profitable trends, fakeouts often result in losses and emotional frustration. Understanding the difference between the two, and learning how to trade them systematically, is critical for long-term trading success.
What Is a Breakout in Trading?
A breakout occurs when the price of an asset moves decisively above a resistance level or below a support level with increased momentum. These levels are usually formed by prior highs, lows, consolidation ranges, trendlines, or chart patterns such as triangles, rectangles, and head-and-shoulders formations.
Breakouts signal a potential shift in market sentiment. When resistance is broken, it suggests buyers have overpowered sellers. When support breaks, it indicates sellers have gained control. Traders aim to enter positions early in these moves to benefit from the expansion in volatility and price.
Why Breakouts Work
Breakouts work because markets tend to alternate between consolidation and expansion. During consolidation, price moves in a narrow range as buyers and sellers reach temporary balance. Once this balance breaks, price often moves rapidly as:
Stop-loss orders get triggered
New traders enter positions
Institutional traders increase exposure
This chain reaction creates momentum, which can lead to sustained trends.
Common Breakout Strategies
One of the simplest breakout strategies involves identifying a clear support or resistance level and entering a trade once price closes beyond that level. Traders often use:
Horizontal support and resistance
Chart patterns (flags, triangles, ranges)
Highs and lows of previous sessions
Volatility-based levels
Stops are usually placed just inside the broken range, while targets can be based on pattern projection, risk–reward ratios, or trailing stops.
The Role of Volume in Breakouts
Volume is a key confirmation tool in breakout trading. A genuine breakout is usually accompanied by higher-than-average volume, showing strong participation from market players. Low-volume breakouts are more likely to fail, as they indicate a lack of conviction.
In derivatives or futures markets, open interest combined with volume can further validate whether new positions are being built or existing ones are being closed.
What Is a Fakeout?
A fakeout occurs when price briefly breaks above resistance or below support but fails to sustain the move and quickly reverses back into the previous range. Fakeouts are common, especially in sideways or low-volatility markets.
These moves are often driven by:
Stop-loss hunting
False news reactions
Low liquidity periods
Retail trader overreaction
Fakeouts trap breakout traders and reward traders who take the opposite side at the right time.
Why Fakeouts Happen So Often
Markets are designed to find liquidity. Obvious support and resistance levels attract a large number of stop-loss and entry orders. Smart money or institutional players may push price beyond these levels to trigger orders, only to reverse the move once liquidity is absorbed.
Fakeouts are more frequent:
In choppy or range-bound markets
Near major economic announcements
During low-volume sessions
When levels are too obvious
How to Identify a Real Breakout vs a Fakeout
Distinguishing between a breakout and a fakeout requires combining multiple factors rather than relying on a single signal.
Key factors to analyze include:
Candle close: Strong breakouts usually close decisively beyond the level, not just wick through it
Volume confirmation: Higher volume supports breakout validity
Retest behavior: Real breakouts often retest the broken level and hold
Market context: Breakouts in trending markets have higher success rates
Time spent near the level: Strong bases lead to stronger breakouts
Trading Fakeouts as a Strategy
Instead of avoiding fakeouts, some traders specialize in trading them. Fakeout trading involves entering in the opposite direction once price fails to hold beyond a key level.
For example:
Price breaks above resistance
Fails to hold and closes back below
Seller enters short with stop above the fake breakout high
This strategy works best in range-bound markets and requires patience and strict risk control.
Risk Management in Breakout and Fakeout Trading
Risk management is crucial because not all breakouts will succeed. Traders should:
Risk only a small percentage of capital per trade
Use predefined stop-loss levels
Avoid overtrading multiple breakouts at once
Maintain a favorable risk–reward ratio (at least 1:2)
Without proper risk management, even a high win-rate strategy can result in losses.
Psychology Behind Breakouts and Fakeouts
Breakout trading tests trader psychology. Fear of missing out (FOMO) often pushes traders to enter too early, while fear of loss causes premature exits. Fakeouts exploit emotional decision-making, especially among inexperienced traders.
Successful traders remain disciplined, wait for confirmation, and accept that losses are part of the process. Emotional neutrality and consistency are more important than predicting every move correctly.
Best Timeframes for Breakout Trading
Breakouts occur on all timeframes, but their reliability varies. Higher timeframes (daily, weekly) tend to produce more reliable breakouts due to institutional participation. Lower timeframes (5-minute, 15-minute) have more noise and fakeouts but offer more frequent opportunities.
Traders should align breakout strategies with their trading style—scalping, day trading, or swing trading.
Breakouts in Different Markets
Stocks: Earnings, news, and sector momentum often drive breakouts
Forex: Breakouts frequently occur around sessions opens and macro news
Commodities: Supply-demand imbalances and global events fuel strong moves
Options: Breakouts often lead to volatility expansion, benefiting option buyers
Understanding market-specific behavior improves breakout accuracy.
Conclusion
Trading breakouts and fakeouts is both an art and a science. Breakouts offer the potential for strong trends and high rewards, while fakeouts serve as reminders that markets are unpredictable and often deceptive. The key to success lies in confirmation, context, and discipline.
By combining price action, volume analysis, market structure, and solid risk management, traders can improve their ability to identify genuine breakouts and avoid common traps. Rather than trying to be right every time, successful traders focus on consistency, probability, and long-term growth.

PCR Trading Strategies Risks in Option Trading
Despite advantages, options carry risks:
Time decay can erode premium quickly
Overtrading leads to losses
Emotional decisions during volatility
Option selling without hedging can cause heavy drawdowns
Proper position sizing, stop-loss, and discipline are essential.

Part 2 Support and Resistance Option Premium
The option premium is the price paid by the buyer to the seller (writer) of the option.
Premium consists of:
Intrinsic Value – Real value if exercised now
Time Value – Value based on time remaining until expiry
As expiry approaches, time value decreases, a phenomenon known as time decay (Theta).

Derivatives Trading SecretsMastering Leverage, Risk, and Market Psychology
Derivatives trading is often seen as a complex and high-risk area of financial markets, reserved only for professionals. However, when understood correctly, derivatives can become powerful tools for profit generation, risk management, and strategic positioning. The real “secrets” of derivatives trading are not hidden formulas or insider tricks, but a deep understanding of leverage, disciplined risk control, market structure, and trader psychology. This article раскрыts the core principles that successful traders consistently apply to gain an edge in derivatives markets.
Understanding the True Nature of Derivatives
Derivatives are financial contracts whose value is derived from an underlying asset such as stocks, indices, commodities, currencies, or cryptocurrencies. Common derivatives include futures, options, and swaps. The first secret of derivatives trading is recognizing that these instruments amplify both opportunity and risk. Because derivatives often require only a margin instead of full capital, traders gain leverage. This leverage magnifies profits, but it also magnifies losses with equal force.
Many beginners focus only on potential returns and overlook how quickly losses can accumulate. Successful traders, on the other hand, treat derivatives as precision instruments. They understand that derivatives are not investments in the traditional sense but tactical tools designed for specific objectives such as hedging, speculation, or arbitrage.
Leverage Is a Double-Edged Sword
One of the most important derivatives trading secrets is knowing how to use leverage responsibly. High leverage is attractive because it allows traders to control large positions with relatively small capital. However, excessive leverage is the primary reason most derivative traders fail.
Professional traders rarely use maximum leverage. Instead, they calculate position size based on acceptable risk per trade, usually limiting losses to a small percentage of total capital. They understand that survival comes first. In derivatives trading, staying in the game long enough is more important than chasing extraordinary gains in a single trade.
The secret lies in controlled leverage—using just enough to enhance returns while maintaining enough margin to withstand normal market volatility.
Risk Management Is the Real Edge
If there is one universal truth in derivatives trading, it is that risk management matters more than strategy. Many traders spend years searching for the perfect setup while ignoring basic risk principles. Successful traders think in probabilities, not certainties.
They define risk before entering a trade by setting stop-loss levels, understanding margin requirements, and planning exit strategies. They also account for gap risk, volatility spikes, and event-driven movements such as earnings, economic data, or policy announcements.
Another key secret is consistency. Instead of risking large amounts on a few trades, disciplined traders risk small, repeatable amounts over many trades. This approach allows the law of large numbers to work in their favor.
Volatility Is a Friend, Not an Enemy
In derivatives markets, volatility is not something to fear—it is something to understand. Futures and options traders, in particular, thrive on volatility. The secret is not predicting direction alone but understanding how volatility impacts pricing.
Options traders focus heavily on implied volatility, time decay, and volatility cycles. They know when to buy options during low volatility and when to sell or structure spreads during high volatility. Futures traders adjust position sizes based on volatility to avoid being shaken out by normal price swings.
Rather than avoiding volatile markets, experienced traders adapt their strategies to changing volatility conditions.
Market Structure and Liquidity Matter
Another often-overlooked secret is the importance of market structure. Liquidity, bid-ask spreads, open interest, and contract specifications play a major role in derivatives trading success. Highly liquid contracts such as index futures or major stock options offer tighter spreads and smoother execution, reducing trading costs.
Professionals prefer liquid markets because they allow quick entry and exit without significant slippage. They also pay attention to rollover dates in futures contracts and changes in open interest to gauge market sentiment and participation.
Understanding how institutions operate within derivatives markets provides insight into price behavior that retail traders often miss.
Timing Is More Important Than Prediction
Many traders believe success depends on predicting market direction accurately. In reality, timing and execution matter far more. Even a correct market view can result in losses if entries and exits are poorly timed.
Derivatives trading secrets include waiting for confirmation, trading with the trend, and aligning multiple time frames. Traders often enter positions when momentum aligns with broader market structure, rather than trying to catch tops and bottoms.
Patience is a hidden advantage. The ability to wait for high-probability setups separates professionals from impulsive traders.
Psychology Determines Long-Term Success
The most powerful secret in derivatives trading lies in the trader’s mindset. Fear, greed, overconfidence, and revenge trading are responsible for most losses. Because derivatives move quickly, emotional mistakes are amplified.
Successful traders develop emotional discipline. They accept losses as part of the business and do not attach ego to individual trades. They follow predefined rules even after a series of losses or wins.
Keeping a trading journal, reviewing mistakes, and focusing on process rather than outcome are common habits among consistently profitable derivatives traders.
Adaptability Is Essential
Markets evolve, and strategies that work today may fail tomorrow. Another critical secret is adaptability. Professional traders continuously monitor market conditions and adjust their strategies accordingly. They know when to be aggressive and when to step back.
They also understand that no single strategy works in all market environments. Trend-following strategies perform well in strong directional markets, while range-bound strategies work better during consolidation phases.
Flexibility and continuous learning keep traders aligned with the market rather than fighting it.
Conclusion
Derivatives trading secrets are not about shortcuts or guaranteed profits. They are about mastering leverage, respecting risk, understanding volatility, and maintaining psychological discipline. Derivatives offer immense potential, but only to those who approach them with preparation, patience, and professionalism.
By focusing on risk management, controlled leverage, market structure, and mindset, traders can transform derivatives from dangerous instruments into powerful tools. In the end, the true secret of derivatives trading is not predicting the market—but managing yourself within it.

How News Drives Price Action and Trading DecisionsThe Role of Stock Market News in Trading
Stock market news refers to all information that can impact the valuation, performance, or perception of companies, sectors, or the broader economy. This includes corporate announcements, economic data releases, central bank decisions, geopolitical events, policy changes, and global financial developments. Markets are forward-looking, meaning prices often move based not only on current news but also on expectations of future outcomes.
When news is released, traders quickly reassess risk and reward. Positive news can trigger buying interest, while negative news can spark selling pressure. In highly liquid markets, this reaction can occur within seconds, driven by institutional traders, algorithms, and high-frequency trading systems. Retail traders often react slightly later, which is why understanding news flow is critical to avoid emotional or late entries.
Types of Stock Market News That Affect Trading
One of the most important categories is economic news. This includes data such as GDP growth, inflation numbers, interest rates, employment reports, industrial production, and consumer confidence. For example, higher-than-expected inflation may lead traders to anticipate interest rate hikes, causing selling pressure in equity markets. Conversely, strong economic growth data may boost confidence and push stock prices higher.
Corporate news is another major driver. Quarterly earnings results, revenue guidance, mergers and acquisitions, management changes, share buybacks, and dividend announcements directly affect individual stocks. A company beating earnings expectations often experiences a sharp price rise, while missing estimates can lead to steep declines. Traders closely monitor earnings seasons because volatility tends to increase significantly during these periods.
Central bank and policy-related news has a broad market impact. Decisions by central banks such as interest rate changes, liquidity measures, or policy statements can influence entire indices. In India, announcements from the Reserve Bank of India (RBI) affect banking, real estate, and rate-sensitive sectors. Globally, policies from the US Federal Reserve often impact emerging markets, currencies, and capital flows.
Geopolitical and global news also plays a significant role. Wars, trade tensions, sanctions, elections, and diplomatic developments can cause uncertainty, leading to risk-off behavior in markets. During such times, traders often shift money into safer assets, while equity markets may experience sharp swings.
How News Impacts Market Psychology
Stock market news does not affect prices only through facts; it also influences trader psychology. Markets are driven by fear, greed, hope, and uncertainty. Positive news can create optimism and fear of missing out (FOMO), pushing prices higher than fundamentals might justify in the short term. Negative news can trigger panic selling, even if the long-term impact is limited.
This psychological reaction often leads to overreactions. Skilled traders understand that the first move after news may not always be the best opportunity. Sometimes, prices spike sharply and then retrace as the market digests the information more rationally. Recognizing this behavior helps traders avoid chasing trades and instead wait for confirmation.
News Trading vs Technical Trading
News trading and technical trading are often seen as separate approaches, but in reality, they are deeply connected. News provides the catalyst, while technical analysis shows how price reacts to that catalyst. A strong resistance level may break only after positive news, confirming a bullish breakout. Similarly, bad news near a support zone may cause a breakdown, accelerating a downtrend.
Intraday traders often use news to anticipate volatility and then rely on charts for precise entries and exits. Swing traders may use news to confirm the direction of a trend, while long-term investors use it to reassess fundamentals. The key is not to trade news blindly but to combine it with market structure, volume, and risk management.
Challenges of Trading Based on News
While news creates opportunities, it also carries risks. One major challenge is speed. Institutional traders and algorithms react faster than retail traders, which means the initial move may already be over by the time many traders act. Another challenge is misinterpretation. News headlines can be misleading, and the market reaction may differ from what logic suggests.
There is also the risk of false news or rumors, which can cause temporary price spikes. Traders who react without confirmation may get trapped when prices reverse. Additionally, markets sometimes move in the opposite direction of news due to prior expectations already being priced in. For example, good news may lead to selling if the market expected even better results.
Managing Risk During News-Based Trading
Risk management becomes even more important when trading around news. Volatility can increase spreads, trigger slippage, and hit stop-loss orders quickly. Traders should reduce position size, avoid overleveraging, and be prepared for sudden price swings. Using predefined stop-loss levels and sticking to a trading plan helps protect capital during uncertain conditions.
Some traders prefer to avoid trading during major news releases, while others specialize in news-driven strategies. Both approaches are valid, as long as the trader understands their risk tolerance and skill level.
Importance of Staying Informed
Successful traders maintain a habit of staying informed through reliable sources such as financial news platforms, exchange announcements, and official economic calendars. However, information overload can be harmful. The goal is not to follow every headline but to focus on news that is relevant to the markets and instruments being traded.
Understanding the context of news is equally important. A single data point should be viewed within the broader economic and market environment. This helps traders make balanced decisions rather than reacting emotionally.
Conclusion
Stock market news is a powerful force in trading, shaping price movements, market sentiment, and volatility. Whether it is economic data, corporate earnings, policy decisions, or global events, news acts as a catalyst that drives market behavior. For traders, the key lies in understanding not just the news itself, but how the market reacts to it.
By combining news awareness with technical analysis, disciplined risk management, and emotional control, traders can turn information into opportunity. Instead of fearing news-driven volatility, skilled traders learn to respect it, prepare for it, and use it wisely as part of a well-rounded trading strategy.
PARAGMILK 1 Week Time Frame 📌 Current Price (approx)
~₹315 – ₹320 on NSE (latest trading range)
📊 Weekly Time‑Frame Levels
🔹 Key Weekly Pivot & Levels
These are useful for the next few sessions (week):
Weekly Pivot Point (approx): ~₹318 – ₹320 (central reference for trend this week)
Weekly Support Levels:
S1: ~₹295 – ₹300
S2: ~₹283 – ₹288
S3: ~₹260 – ₹275 (deeper support if heavy pullback)
Weekly Resistance Levels:
R1: ~₹323 – ₹326
R2: ~₹331 – ₹335
R3: ~₹350 – ₹355 (secondary target zone)
(Pivot & weekly support/resistance based on aggregated pivot frameworks)
🔸 Short‑Term/Weekly Trading Zones
Bullish Scenario (uptrend holds):
✔ Stay above ₹320‑318 → next upside targets
→ ₹326‑₹331 (near‑term resistance)
→ ₹345‑₹350+ (medium‑term / breakout target)
Bearish Scenario (correction):
❌ Drop below ₹300‑295 → next support zone
→ ₹283‑₹288
→ ₹260‑₹275 (deeper demand zone)
📉 Simple Pivot Levels (Daily/Shorter)
Daily pivot range for context this week:
R1 ~₹311–₹315
R2 ~₹315–₹320
R3 ~₹320–₹325
S1 ~₹302–₹305
S2 ~₹297–₹300
S3 ~₹292–₹295
(Classic pivot ranges also align with weekly S1/S2)
📅 What to Watch This Week
🔹 Hold above ₹318–₹320: strengthens bullish outlook
🔹 Break below ₹295: possible deeper correction
🔹 Volume & daily closes: confirm breakout or reversal

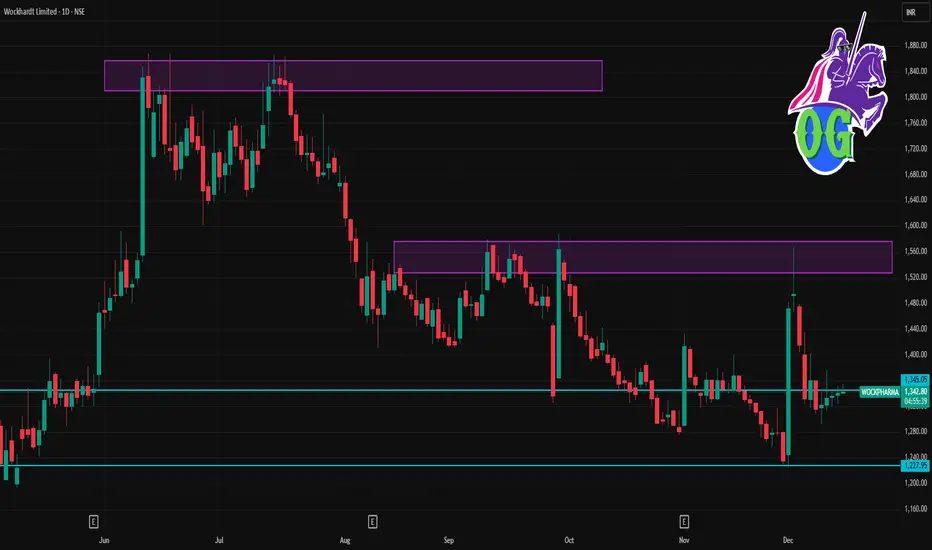
WOCKPHARMA 1 Day Time Frame 📌 Live Current Price (Approx)
≈ ₹1,341 on NSE (latest available market data) 📊
📈 Daily Pivot & Support/Resistance Levels (Today)
Using standard pivot calculation (based on previous day range) — reliable for 1D intraday view:
🔹 Pivot Point (PP): ~ ₹1,360.07
🔹 Resistance Levels:
R1: ₹1,401.93
R2: ₹1,443.87
R3: ₹1,485.73
🔹 Support Levels:
S1: ₹1,318.13
S2: ₹1,276.27
S3: ₹1,234.33
🧠 Alternate Intraday Levels (from technical screener)
Pivot Speed Levels
R1: ~ ₹1,353.53
R2: ~ ₹1,365.87
R3: ~ ₹1,381.13
S1: ~ ₹1,325.93
S2: ~ ₹1,310.67
S3: ~ ₹1,298.33
🔍 Intraday Price Range (Observed Today)
Day’s Low: ~ ₹1,323
Day’s High: ~ ₹1,350+
Managing Trading Risk: Foundation of Long-Term Market SuccessUnderstanding Trading Risk
Trading risk refers to the possibility of losing capital due to unfavorable market movements, poor decisions, or unexpected events. Every trade carries risk, whether in stocks, derivatives, forex, or crypto markets. Market volatility, news events, economic data, and geopolitical factors can cause sudden price fluctuations. A trader’s goal is not to eliminate risk—because that is impossible—but to control and manage it effectively.
Risk management begins with accepting that losses are inevitable. Many beginners enter the market focusing only on profits, ignoring the downside. This mindset often leads to emotional trading, oversized positions, and account blow-ups. Professional traders, on the other hand, think first about how much they can lose before considering how much they can gain.
Capital Preservation Comes First
The primary objective of risk management is capital preservation. Without capital, there is no opportunity to trade. A trader who loses 50% of their account needs a 100% return just to break even. This mathematical reality highlights why controlling losses is more important than chasing big gains.
Successful traders usually risk only a small percentage of their total capital on a single trade, commonly between 1% and 2%. This approach ensures that even a series of losing trades does not significantly damage the trading account. Preserving capital provides the psychological confidence to continue trading rationally rather than emotionally.
Position Sizing and Risk Per Trade
Position sizing is one of the most powerful risk management tools. It determines how many shares, contracts, or lots to trade based on account size and risk tolerance. Proper position sizing aligns the potential loss of a trade with predefined risk limits.
For example, if a trader has a capital of ₹10,00,000 and decides to risk 1% per trade, the maximum loss allowed per trade is ₹10,000. Based on the stop-loss distance, the trader calculates the appropriate position size. This systematic approach removes guesswork and emotional bias from trading decisions.
Ignoring position sizing often leads to overtrading and excessive exposure. Even a high-probability setup can fail, and oversized positions can turn small mistakes into catastrophic losses.
The Role of Stop-Loss Orders
A stop-loss is a predefined price level at which a losing trade is exited automatically. It acts as a safety net, limiting losses and protecting capital. Using stop-loss orders is not a sign of weakness but a mark of discipline and professionalism.
Effective stop-loss placement is based on market structure, volatility, and technical levels rather than arbitrary values. Stops placed too tight may result in frequent premature exits, while stops placed too wide may expose the trader to unnecessary losses. A well-planned stop-loss balances risk control with market behavior.
More importantly, traders must respect their stop-losses. Moving or removing a stop-loss due to hope or fear often leads to larger losses. Discipline in executing stop-losses is essential for consistent performance.
Risk-to-Reward Ratio
The risk-to-reward ratio compares the potential loss of a trade to its potential profit. A favorable risk-to-reward ratio ensures that even if a trader is right only a portion of the time, they can still be profitable.
For instance, a 1:2 risk-to-reward ratio means risking ₹1 to make ₹2. With this ratio, a trader can be profitable even with a win rate below 50%. Focusing on high-quality setups with positive risk-to-reward characteristics helps traders avoid overtrading and low-probability opportunities.
However, risk-to-reward should not be viewed in isolation. It must align with the trader’s strategy, market conditions, and realistic profit targets.
Emotional and Psychological Risk Management
Risk management is not only technical but also psychological. Fear, greed, overconfidence, and revenge trading are major contributors to trading losses. Emotional decisions often lead to breaking rules, increasing position sizes impulsively, and holding losing trades for too long.
Developing a trading plan and strictly following it reduces emotional interference. A clear plan defines entry rules, exit rules, risk limits, and trade management guidelines. Journaling trades and reviewing mistakes also helps traders identify emotional patterns and improve discipline over time.
Maintaining realistic expectations is another key aspect of psychological risk management. Markets do not provide consistent profits every day. Accepting drawdowns as part of the process helps traders stay calm and focused.
Diversification and Exposure Control
Diversification reduces risk by spreading exposure across different instruments, sectors, or strategies. Relying heavily on a single stock, asset class, or market condition increases vulnerability to unexpected events.
However, diversification should be meaningful. Holding multiple positions that are highly correlated does not significantly reduce risk. Traders must monitor overall exposure, especially during volatile periods, to avoid excessive concentration.
Adapting Risk to Market Conditions
Market conditions are dynamic. Volatility levels, liquidity, and trend strength change over time. Effective risk management requires flexibility. During high-volatility periods, reducing position size or tightening risk limits can protect capital. In stable market environments, traders may cautiously increase exposure within predefined limits.
Ignoring changing conditions and applying the same risk approach blindly can lead to unnecessary losses. Adaptability is a hallmark of experienced traders.
Conclusion
Managing trading risk is the backbone of sustainable success in financial markets. It is not about avoiding losses but about controlling them intelligently. Through capital preservation, proper position sizing, disciplined stop-loss usage, favorable risk-to-reward ratios, emotional control, and adaptability, traders can survive market uncertainty and grow steadily over time.
In the long run, consistent risk management matters more than finding the perfect strategy. Markets reward discipline, patience, and respect for risk. Traders who master risk management build resilience, confidence, and the foundation for lasting profitability.

Retail Trading vs Institutional Trading1. Who Are Retail Traders?
Retail traders are individual participants who trade financial instruments such as stocks, commodities, forex, cryptocurrencies, or derivatives using their own capital. They usually trade through online brokerage platforms and operate independently.
Key Characteristics of Retail Trading
Capital Size: Small to medium. Most retail traders trade with limited funds compared to institutions.
Access to Markets: Via discount brokers, trading apps, and online platforms.
Decision Making: Personal judgment, often influenced by technical analysis, news, social media, and market sentiment.
Time Horizon: Ranges from intraday trading to long-term investing.
Technology: Basic charting tools, indicators, and retail-level analytics.
Retail trading has grown rapidly due to easy internet access, low brokerage fees, mobile trading apps, and financial education available through online platforms.
2. Who Are Institutional Traders?
Institutional traders are large organizations that trade on behalf of clients or for their own accounts. These include mutual funds, hedge funds, pension funds, insurance companies, banks, proprietary trading firms, and foreign institutional investors (FIIs).
Key Characteristics of Institutional Trading
Capital Size: Very large, often running into millions or billions.
Access to Markets: Direct market access (DMA), dark pools, and over-the-counter (OTC) markets.
Decision Making: Team-based, involving analysts, economists, risk managers, and traders.
Time Horizon: From high-frequency trading (milliseconds) to long-term investing (years).
Technology: Advanced algorithms, high-frequency trading systems, AI models, and proprietary data.
Institutions are the dominant force in most financial markets and are responsible for the majority of trading volume.
3. Capital and Position Size Differences
One of the most significant differences between retail and institutional trading is capital size.
Retail traders typically trade small quantities due to limited funds and higher risk exposure.
Institutional traders trade in large volumes, which can influence price movements, liquidity, and volatility.
Because of their size, institutions must be careful when entering or exiting positions. They often break large orders into smaller ones to avoid moving the market too aggressively, a process known as order slicing.
4. Information and Research Access
Retail Traders
Depend on publicly available information: news, earnings reports, charts, and social media.
Use standard indicators like RSI, MACD, moving averages, and candlestick patterns.
Often react to market news after it becomes public.
Institutional Traders
Have access to deep research, including industry reports, macroeconomic models, and company management interactions.
Employ dedicated research teams and sometimes alternative data such as satellite data, supply chain analysis, or consumer behavior data.
Can anticipate trends earlier due to superior information processing.
This information asymmetry gives institutions a strong edge over retail participants.
5. Trading Strategies and Styles
Retail Trading Strategies
Intraday trading
Swing trading
Positional trading
Options buying (calls and puts)
Momentum and breakout strategies
Retail traders often focus on short-term price movements and technical patterns. Emotional decision-making and overtrading are common challenges.
Institutional Trading Strategies
Long-term portfolio allocation
Arbitrage strategies
Statistical and quantitative trading
Market making
Hedging using derivatives
High-frequency trading (HFT)
Institutions focus heavily on risk-adjusted returns, diversification, and consistency rather than frequent speculative trades.
6. Risk Management Practices
Risk management is another major area of difference.
Retail traders often risk a large percentage of their capital on single trades, sometimes due to lack of discipline or experience.
Institutional traders follow strict risk management rules, including position limits, stop-loss frameworks, portfolio diversification, and regulatory compliance.
Institutions prioritize capital preservation, whereas many retail traders focus primarily on profit, sometimes ignoring downside risk.
7. Emotional vs Systematic Trading
Retail traders are more prone to:
Fear and greed
Revenge trading
Overconfidence after wins
Panic during drawdowns
Institutional trading is largely systematic and rule-based. Decisions are backed by models, committees, and predefined rules, reducing emotional bias.
This psychological discipline is a major reason institutions outperform most retail traders over the long term.
8. Market Impact and Liquidity
Retail traders usually have negligible market impact due to small trade sizes. Their trades rarely move prices significantly.
Institutional traders, on the other hand:
Create liquidity in some cases (market makers).
Cause sharp price movements when large orders hit the market.
Influence trends, breakouts, and major support-resistance levels.
Many price movements that retail traders react to are actually initiated by institutional activity.
9. Costs, Fees, and Execution
Retail traders:
Pay brokerage fees, taxes, and slippage.
Often experience slower execution and wider spreads.
Institutional traders:
Enjoy lower transaction costs due to high volumes.
Get better execution quality and tighter spreads.
Use smart order routing to minimize costs.
Lower costs significantly improve institutional profitability over time.
10. Regulatory Environment
Institutional traders operate under strict regulatory oversight, including reporting requirements, compliance audits, and risk disclosures.
Retail traders face fewer regulations but also have fewer protections in terms of information and execution advantages.
11. Why Retail Traders Often Lose
Studies across global markets show that a large percentage of retail traders lose money. Key reasons include:
Lack of education and realistic expectations
Poor risk management
Emotional trading
Overtrading
Competing against well-capitalized institutions
This does not mean retail traders cannot succeed, but success requires discipline, patience, and continuous learning.
12. How Retail Traders Can Compete Smarter
Retail traders can improve their chances by:
Following institutional footprints like volume, open interest, and price action
Focusing on risk management over profits
Trading fewer, high-quality setups
Avoiding excessive leverage
Aligning trades with higher-timeframe trends
Instead of fighting institutions, smart retail traders try to trade alongside institutional direction.
Conclusion
Retail trading and institutional trading operate in the same markets but under vastly different conditions. Retail traders bring flexibility, speed, and independence, while institutional traders dominate with capital, technology, research, and discipline. Markets are largely shaped by institutional behavior, and retail traders who understand this dynamic stand a better chance of survival and success.

Intraday Trading vs Swing Trading1. What is Intraday Trading?
Intraday trading, also known as day trading, involves buying and selling financial instruments—such as stocks, indices, commodities, or currencies—within the same trading day. All positions are closed before the market closes, and no trades are carried forward to the next day.
Key Characteristics of Intraday Trading
Time frame: Minutes to hours
Holding period: Same day only
Charts used: 1-minute, 5-minute, 15-minute
Objective: Capture small price movements
Frequency: High number of trades
Intraday traders focus on short-term volatility. Even small price changes can result in profits when traded with proper position sizing and leverage.
2. What is Swing Trading?
Swing trading aims to capture short- to medium-term price movements, typically lasting from a few days to several weeks. Traders hold positions overnight and sometimes through market fluctuations to benefit from a “swing” in price.
Key Characteristics of Swing Trading
Time frame: Days to weeks
Holding period: More than one day
Charts used: Daily, 4-hour, weekly
Objective: Capture larger price moves
Frequency: Fewer trades
Swing traders rely more on trend analysis, chart patterns, and broader market structure rather than minute-by-minute price changes.
3. Time Commitment and Lifestyle
Intraday Trading
Intraday trading requires full-time attention during market hours. Traders must constantly monitor price action, news, and order flow. Quick decision-making is critical, leaving little room for error.
Suitable for full-time traders
Demanding and mentally exhausting
Not ideal for those with regular jobs
Swing Trading
Swing trading is more flexible. Trades are planned after market hours, and positions are monitored periodically.
Suitable for part-time traders
Less screen time required
Ideal for working professionals
4. Capital Requirements
Intraday Trading
Intraday trading often requires:
Higher capital for margin trading
Ability to absorb frequent losses
Broker leverage (which increases risk)
Because profits per trade are usually small, traders often increase position size to make meaningful gains.
Swing Trading
Swing trading can be started with:
Relatively lower capital
No dependency on high leverage
Better risk-to-reward ratios
Holding positions for longer allows traders to benefit from bigger price movements without excessive leverage.
5. Risk and Volatility
Intraday Trading Risk
High exposure to market noise
Sudden price spikes due to news or algorithmic trading
Slippage and execution risk
Emotional stress due to fast-moving prices
Even a few seconds of delay can turn a profitable trade into a loss.
Swing Trading Risk
Overnight risk due to gaps caused by news or global markets
Broader stop-loss levels
Lower impact of intraday volatility
While swing traders face gap risk, they are less affected by random intraday fluctuations.
6. Analysis and Strategy
Intraday Trading Strategies
Scalping
Momentum trading
Breakout and breakdown trades
VWAP and volume-based setups
Intraday traders rely heavily on technical indicators, price action, and volume. Fundamental analysis has minimal impact due to the short holding period.
Swing Trading Strategies
Trend-following strategies
Support and resistance trading
Chart patterns (flags, triangles, head & shoulders)
Moving average crossovers
Swing traders combine technical analysis with fundamental cues, such as earnings, sector strength, or macroeconomic trends.
7. Transaction Costs and Brokerage
Intraday Trading
High brokerage due to frequent trading
Exchange fees and taxes add up
Costs can significantly reduce net profitability
Swing Trading
Fewer trades mean lower transaction costs
Easier to maintain consistent profitability
Better cost efficiency
Over time, lower trading frequency can make a substantial difference in returns.
8. Psychology and Emotional Control
Intraday Trading Psychology
Requires extreme discipline
Fear and greed act very quickly
Overtrading is a common problem
Quick losses can lead to revenge trading
Mental fatigue is one of the biggest challenges for intraday traders.
Swing Trading Psychology
More time to think and plan
Less emotional pressure
Requires patience and trust in analysis
Easier to follow predefined rules
Swing trading suits traders who prefer calm, structured decision-making.
9. Profit Potential
Intraday Trading
Daily income potential
Compounding possible with consistent performance
However, consistency is difficult to achieve
Swing Trading
Larger profit per trade
Fewer but more meaningful opportunities
Suitable for wealth-building over time
Both styles can be profitable, but long-term success depends on discipline, risk management, and realistic expectations.
10. Which is Better: Intraday or Swing Trading?
There is no universal “best” trading style. The right choice depends on individual factors:
Factor Intraday Trading Swing Trading
Time availability High Moderate
Stress level Very high Moderate
Capital needed Higher Lower
Holding period Same day Days to weeks
Suitable for beginners Less suitable More suitable
Conclusion
Intraday trading and swing trading are two distinct approaches to market participation. Intraday trading is fast-paced, demanding, and highly stressful but can offer daily income opportunities for disciplined traders with sufficient time and experience. Swing trading, on the other hand, is calmer, more flexible, and better suited for traders who cannot monitor markets constantly.
For beginners and working professionals, swing trading often provides a smoother learning curve and more sustainable results. Intraday trading may be suitable for those who can dedicate full attention to markets and handle intense psychological pressure.
Earnings Season Trading – A Complete Guide1. What Is Earnings Season?
Earnings season is the period when companies release their quarterly financial performance, including:
Revenue (sales)
Net profit or loss
Earnings per share (EPS)
Operating margins
Management guidance and outlook
In India, earnings seasons usually begin shortly after the end of each quarter:
Q1: April–June (results from July)
Q2: July–September (results from October)
Q3: October–December (results from January)
Q4: January–March (results from April/May)
During this time, stocks can experience sudden and large price movements due to surprises in results or guidance.
2. Why Earnings Season Is Important for Traders
Earnings are the primary driver of long-term stock value. While news, sentiment, and macro factors matter, earnings confirm whether a company’s business is actually performing.
For traders, earnings season matters because:
Volatility increases – Sharp price swings create trading opportunities.
Volume rises – Institutional participation increases liquidity.
Trend changes occur – Stocks may break out or break down decisively.
Repricing happens – Stocks are revalued based on future expectations.
A single earnings announcement can move a stock 5–20% in one session, especially in mid-cap and small-cap stocks.
3. How Markets React to Earnings
Stock price movement during earnings is not only about whether results are good or bad. The reaction depends on expectations vs reality.
Common Earnings Reactions:
Results better than expectations
→ Stock may rise sharply.
Results in line with expectations
→ Stock may remain flat or even fall (profit booking).
Results below expectations
→ Stock often declines sharply.
Strong results but weak guidance
→ Stock may fall.
Weak results but strong future outlook
→ Stock may rise.
This is why traders say:
“Markets trade on expectations, not just numbers.”
4. Types of Earnings Season Traders
1. Pre-Earnings Traders
These traders take positions before results, betting on:
Strong earnings surprise
Sector momentum
Insider or institutional accumulation
Technical breakout ahead of results
Risk is high because outcomes are uncertain.
2. Post-Earnings Traders
These traders wait for results and then trade:
Breakouts after earnings
Trend continuation
Gap-up or gap-down moves
This approach reduces uncertainty but may miss part of the move.
3. Options Traders
Options traders focus on:
Volatility expansion
Implied volatility crush after results
Directional or non-directional strategies
Earnings season is especially important for options due to volatility changes.
5. Popular Earnings Season Trading Strategies
1. Earnings Breakout Strategy
Identify stocks consolidating near resistance before earnings
Strong results trigger a breakout with high volume
Entry after breakout confirmation
Stop-loss below breakout level
Best suited for momentum traders.
2. Gap-Up / Gap-Down Trading
After earnings, stocks often open with a gap.
Gap-up with volume and follow-through → bullish continuation
Gap-up but weak volume → possible fade
Gap-down below key support → bearish continuation
This strategy is popular among intraday and short-term traders.
3. Buy the Rumor, Sell the News
Stock rises before earnings due to expectations
Even good results lead to profit booking
Traders exit positions before or immediately after results
This strategy requires understanding sentiment and positioning.
4. Post-Earnings Drift Strategy
Some stocks continue moving in the same direction for days or weeks after earnings.
Strong earnings + strong close = bullish drift
Weak earnings + weak close = bearish drift
Swing traders often use this strategy.
5. Options Volatility Strategy
Before earnings:
Implied volatility (IV) increases
After earnings:
IV collapses
Common strategies:
Straddle or strangle (for big moves)
Iron condor or credit spreads (to benefit from IV crush)
Options traders must manage risk carefully due to sudden moves.
6. Key Factors to Analyze Before Trading Earnings
Before taking any earnings trade, traders should analyze:
1. Historical Earnings Reaction
How much does the stock usually move after earnings?
Is it volatile or stable?
2. Market and Sector Trend
Bullish markets reward good earnings more
Weak markets punish even decent results
3. Expectations and Estimates
Compare analyst estimates with company guidance
Higher expectations mean higher risk of disappointment
4. Technical Levels
Support and resistance
Trend direction
Volume patterns
5. Management Commentary
Often, price moves more on:
Future guidance
Margin outlook
Demand visibility
than on current quarter numbers.
7. Risks in Earnings Season Trading
Earnings trading is not easy and carries unique risks:
Overnight risk – Results are often announced after market hours.
Whipsaws – Initial reaction may reverse quickly.
False breakouts – Emotional reactions can trap traders.
Volatility crush in options – Wrong options strategy can cause losses even if direction is right.
Because of these risks, position sizing and stop-loss discipline are critical.
8. Risk Management During Earnings
Smart traders follow strict risk rules:
Trade smaller quantities
Avoid overexposure to one stock
Use predefined stop-loss
Avoid revenge trading after losses
Prefer post-earnings confirmation if risk-averse
Professional traders focus on survival first, profits second.
9. Earnings Season for Long-Term Investors vs Traders
Investors use earnings to validate fundamentals and hold through volatility.
Traders use earnings for short-term price movements and momentum.
A trader may exit quickly, while an investor may add on dips caused by short-term disappointment.
Understanding your role is essential before trading earnings.
10. Conclusion
Earnings season trading is one of the most exciting and challenging aspects of the stock market. It offers exceptional opportunities due to high volatility, volume, and strong price discovery. However, it also carries higher risk because markets react not just to results, but to expectations, guidance, and sentiment.
Successful earnings traders combine:
Fundamental understanding
Technical analysis
Volatility awareness
Strict risk management
Rather than trading every result, disciplined traders focus only on high-probability setups. With experience, patience, and proper risk control, earnings season trading can become a powerful tool in a trader’s strategy arsenal.

Real Kowledge of Chart Pattern Key Principles for Chart Pattern Analysis
A. Trend Context
Patterns are more reliable when analyzed in the context of prevailing trends. For instance, reversal patterns in strong trends may fail without sufficient volume confirmation.
B. Volume Confirmation
Volume often provides confirmation for patterns:
Breakouts with high volume are more reliable.
Low volume breakouts can indicate false signals.
C. Time Frame
Patterns may appear differently across time frames. For example, a double top on a daily chart is more significant than one on a 5-minute chart due to higher trading participation and reduced noise.
D. Pattern Failure
Not all patterns result in expected outcomes. False breakouts or trend reversals can occur due to market news, unexpected events, or low liquidity. Risk management, stop-losses, and position sizing are crucial.

Sensex 1 Week Time Frame 📌 Live Index Level (Approximate Current Price)
Sensex today: ~85,268 points (trading slightly up) — this is the live market value you’re seeing right now.
📅 Weekly Time-Frame Snapshot
Based on recent daily closing prices (last week), the weekly movement looks like this (approximate):
Monday: ~85,712
Tuesday: ~85,102
Wednesday: ~84,666
Thursday: ~84,818
Friday (Latest): ~85,267
This suggests the week range is roughly:
Weekly High: ~85,700–85,720
Weekly Low: ~84,650–84,700
Current/Weekly Close (latest): ~85,250–85,300

Part 1 Intraday Master Class Income-Generating Option Strategies
1. Covered Call Strategy
A covered call involves holding the underlying stock and selling a call option against it.
Market View: Mildly bullish or sideways
Risk: Stock downside risk remains
Reward: Limited to premium + price appreciation till strike
This strategy generates regular income and is widely used by long-term investors.
2. Cash-Secured Put Strategy
In this strategy, a trader sells a put option while keeping sufficient cash to buy the stock if assigned.
Market View: Neutral to bullish
Risk: Owning stock below market price
Reward: Premium received
It is a disciplined way to enter stocks at lower prices.

Divergence Secrets Volatility-Based Option Strategies
Long Straddle
A long straddle involves buying both a call and a put at the same strike price and expiration.
Market View: High volatility expected
Risk: Limited to total premium paid
Reward: Unlimited on either side
This strategy works well before major events like earnings, budget announcements, or economic data releases.

Option Trading Strategies Basic Directional Option Strategies
1.1 Long Call Strategy
A long call involves buying a call option with the expectation that the underlying asset will rise significantly before expiration.
Market View: Bullish
Risk: Limited to premium paid
Reward: Unlimited
Best Used When: Strong upward momentum is expected
This strategy benefits from rising prices and increasing volatility. Time decay works against the buyer, so timing is crucial.
1.2 Long Put Strategy
A long put involves buying a put option expecting the price to fall sharply.
Market View: Bearish
Risk: Limited to premium paid
Reward: Substantial if price falls sharply
Best Used When: Strong downtrend or breakdown expected
Long puts are also used as insurance against falling markets.

Candle Patterns How to Use Candlestick Patterns Effectively
Confirm with Trend and Volume: Candlestick patterns are more reliable when combined with trend analysis and volume confirmation. For example, a bullish engulfing pattern is stronger if trading volume is higher than average.
Use Multiple Time Frames: Analyze patterns across multiple time frames for better context. A pattern on a daily chart may carry more weight than one on a 5-minute chart.
Combine with Technical Indicators: Using RSI, MACD, or moving averages alongside candlestick patterns improves decision-making and reduces false signals.
Risk Management: Candlestick patterns provide potential signals, not guarantees. Always use stop-loss orders and proper position sizing.
Practice and Observation: Recognizing patterns takes practice. Backtesting historical charts helps identify the effectiveness of patterns in different market conditions.

Unlocking Market Insights through Volume AnalysisTrading in financial markets is often considered both an art and a science. Among the various analytical tools traders use, volume analysis stands out as a crucial method for understanding market behavior, predicting price movements, and making informed trading decisions. Volume refers to the total number of shares, contracts, or units of an asset traded during a specific time frame. By combining price action with volume, traders can gain insights that are often invisible through price analysis alone.
Understanding Volume in Trading
Volume is essentially a measure of market activity. High trading volume indicates strong participation and interest in a particular security, whereas low volume suggests weak participation. Importantly, volume is not just a number; it reflects the strength or weakness of price movements.
High volume with rising prices typically indicates strong buying interest and can signal the continuation of an upward trend.
High volume with falling prices often signals panic selling or strong bearish sentiment.
Low volume with rising or falling prices may indicate weak conviction, suggesting that the trend may not be sustainable.
Volume analysis is used by both short-term traders, such as day traders and swing traders, and long-term investors. Understanding how to read volume can improve entry and exit timing, risk management, and the identification of market trends.
The Role of Volume in Technical Analysis
Technical analysts use volume to confirm chart patterns, trend reversals, and breakouts. Some of the key methods include:
Volume Confirmation of Trends
A strong trend is often accompanied by increasing volume. For instance, in an uptrend, volume should increase as prices move higher and decrease during minor pullbacks. Conversely, in a downtrend, volume tends to rise on declines and shrink during temporary rallies. This confirms the trend’s legitimacy.
Volume and Breakouts
Breakouts are more reliable when accompanied by a significant increase in volume. If a stock breaks a resistance level on low volume, it could indicate a false breakout. Traders often wait for a spike in volume to confirm the move before entering a position.
Volume Oscillators and Indicators
Several technical indicators help analyze volume, including the On-Balance Volume (OBV), Chaikin Money Flow (CMF), and Volume Weighted Average Price (VWAP). These tools combine price and volume to provide insights about buying and selling pressure.
Volume in Reversal Patterns
Volume plays a key role in identifying reversals. For example, in a double-top pattern, the volume often declines on the second peak, signaling weakening bullish momentum. Similarly, in a head-and-shoulders pattern, rising volume on the breakout confirms the reversal.
Practical Applications of Volume Trading
Volume analysis is not just theoretical; it has practical implications in real trading:
Identifying Institutional Activity: Large institutions, such as mutual funds and hedge funds, leave traces in volume patterns. Sudden spikes in volume without significant news often indicate institutional buying or selling. Retail traders can use this information to anticipate larger market moves.
Improving Entry and Exit Points: Traders can use volume to fine-tune their entry and exit points. Entering trades on low-volume pullbacks in an uptrend reduces risk, while exiting when volume indicates trend exhaustion can protect profits.
Detecting Market Sentiment: Volume reflects market psychology. Rising volume on up moves indicates confidence and optimism, while increasing volume on down moves reflects fear and panic. Traders can gauge sentiment and adjust strategies accordingly.
Supporting Risk Management: Volume can help traders validate stop-loss levels. For example, if a price breaches a support level on high volume, it is more likely a genuine breakdown than a low-volume spike, guiding traders to exit positions promptly.
Volume in Different Market Conditions
Volume analysis can vary depending on market conditions:
Trending Markets: Volume helps confirm the strength of a trend. Traders look for volume expansion during trend continuation and contraction during consolidation periods.
Range-Bound Markets: In sideways markets, volume analysis can identify accumulation (buying) and distribution (selling). A sudden surge in volume at a support or resistance level can hint at a future breakout.
Volatile Markets: During high volatility, volume spikes are common. Traders need to differentiate between normal high-volume fluctuations and significant market moves by considering context and historical volume levels.
Advanced Volume Techniques
Professional traders often combine volume with other tools for a deeper analysis:
Volume Price Trend (VPT): This technique combines price changes with volume to evaluate the strength of a trend.
Volume Spread Analysis (VSA): VSA examines the relationship between volume, price spread, and closing price to detect accumulation or distribution by smart money.
Volume Profiles: These provide a graphical representation of traded volume at different price levels, helping traders identify key support and resistance zones.
Challenges in Trading with Volume
While volume is a powerful tool, it is not foolproof:
Delayed Data: Volume analysis works best with up-to-date and accurate data. Delays in reporting can mislead traders.
Market Manipulation: In some markets, volume can be artificially inflated through wash trades or spoofing, potentially giving false signals.
Context Matters: Volume should always be analyzed in conjunction with price action, market news, and broader economic factors.
Conclusion
Trading with volume is a cornerstone of market analysis. By understanding the relationship between price and volume, traders can gain deeper insights into market dynamics, identify trends, anticipate reversals, and manage risk more effectively. Volume analysis provides a window into market sentiment, revealing the actions of major players and helping traders align their strategies accordingly. While it requires careful observation and practice, mastering volume trading can significantly improve both the accuracy and confidence of trading decisions. For any trader seeking to combine technical analysis with practical market intelligence, volume is an indispensable tool that illuminates the hidden currents beneath price movements.

Technology and Innovation in Trading1. Evolution of Trading Technology
From Open Outcry to Electronic Trading
Earlier, trading occurred through open outcry systems, where traders physically gathered at exchanges to buy and sell assets. This method was slow, prone to human error, and limited participation. The introduction of electronic trading platforms revolutionized markets by allowing orders to be placed digitally, improving speed and accuracy.
Rise of Online Trading Platforms
The emergence of the internet enabled online trading platforms, giving retail investors direct access to markets. Platforms such as terminal-based systems and broker apps democratized trading, reducing dependency on intermediaries and lowering transaction costs.
2. Algorithmic Trading (Algo Trading)
What Is Algorithmic Trading?
Algorithmic trading uses computer programs to execute trades automatically based on predefined rules such as price, volume, time, or technical indicators. These algorithms can process vast amounts of data faster than humans.
Benefits of Algo Trading
Speed: Executes trades in milliseconds
Accuracy: Eliminates emotional bias
Efficiency: Handles large order sizes with minimal market impact
Consistency: Follows rules strictly without fatigue
Types of Trading Algorithms
Trend-following algorithms
Mean reversion strategies
Statistical arbitrage
Execution algorithms (VWAP, TWAP)
Algo trading is now widely used by hedge funds, investment banks, and proprietary trading firms.
3. High-Frequency Trading (HFT)
High-frequency trading is an advanced form of algorithmic trading that relies on ultra-low latency systems and high-speed data connections. HFT firms make profits from tiny price inefficiencies by executing thousands of trades per second.
Key Innovations Behind HFT
Co-location services (servers placed near exchange servers)
Fiber-optic and microwave data transmission
Low-latency hardware and software optimization
While HFT improves market liquidity, it has also raised concerns about market fairness and volatility.
4. Artificial Intelligence and Machine Learning in Trading
Role of AI in Trading
Artificial Intelligence (AI) and Machine Learning (ML) enable systems to learn from historical data, identify complex patterns, and adapt strategies dynamically.
Applications of AI and ML
Predictive price modeling
Pattern recognition in charts
Sentiment analysis from news and social media
Risk management and portfolio optimization
Unlike traditional algorithms, AI-based systems improve over time, making them highly valuable in uncertain and fast-changing markets.
5. Big Data and Data Analytics
Explosion of Market Data
Modern trading relies on big data, including:
Tick-by-tick price data
Order book data
Economic indicators
Corporate fundamentals
News, earnings calls, and social media sentiment
Importance of Data Analytics
Advanced analytics tools help traders:
Identify hidden market trends
Measure volatility and correlations
Optimize entry and exit points
Improve backtesting accuracy
Big data analytics has become a cornerstone of institutional trading strategies.
6. Blockchain Technology and Trading
Blockchain in Financial Markets
Blockchain introduces decentralization, transparency, and immutability into trading systems. It enables peer-to-peer transactions without traditional intermediaries.
Innovations Enabled by Blockchain
Cryptocurrency trading
Decentralized exchanges (DEXs)
Smart contracts for automated settlement
Tokenization of assets (stocks, bonds, real estate)
Blockchain reduces settlement time, lowers costs, and enhances trust, especially in cross-border trading.
7. Cloud Computing and Trading Infrastructure
Cloud computing has transformed trading infrastructure by providing scalable, flexible, and cost-efficient computing resources.
Benefits of Cloud-Based Trading Systems
Real-time data access from anywhere
Faster deployment of trading strategies
Reduced hardware and maintenance costs
Enhanced disaster recovery and data security
Both retail traders and institutions increasingly rely on cloud-based analytics and execution platforms.
8. Mobile Trading and Fintech Innovation
Rise of Mobile Trading
Smartphones have enabled anytime, anywhere trading, increasing market participation. Mobile trading apps offer advanced charting, real-time alerts, and instant execution.
Fintech Disruption
Fintech innovations have introduced:
Zero-commission trading
Fractional investing
Robo-advisors
Integrated trading and banking solutions
These innovations have lowered entry barriers and increased financial inclusion.
9. Risk Management and Technology
Technology-Driven Risk Control
Modern trading systems integrate real-time risk management tools, including:
Automated stop-loss execution
Margin monitoring systems
Stress testing and scenario analysis
Exposure and drawdown limits
Technology helps traders identify risks early and take corrective actions before losses escalate.
10. Regulatory Technology (RegTech)
RegTech uses technology to ensure compliance with complex trading regulations. It enables:
Automated reporting
Trade surveillance
Fraud detection
Market abuse monitoring
As markets grow more complex, RegTech plays a critical role in maintaining transparency and investor protection.
11. Impact on Retail Traders
Technology has empowered retail traders by providing:
Advanced charting and indicators
Low-cost execution
Access to global markets
Educational tools and simulators
However, it also demands discipline and continuous learning, as sophisticated tools can amplify both profits and losses.
12. Challenges and Risks of Technological Trading
Despite its benefits, technology-driven trading comes with risks:
System failures and glitches
Over-optimization of strategies
Cybersecurity threats
Over-reliance on automation
Successful traders combine technology with sound judgment and robust risk management.
Conclusion
Technology and innovation have fundamentally transformed trading into a fast-paced, data-driven, and highly competitive activity. From algorithmic execution and AI-driven insights to blockchain-based settlement and mobile trading platforms, innovation continues to redefine how markets function. While technology enhances efficiency, accessibility, and profitability, it also increases complexity and risk. The future of trading belongs to those who can adapt, learn, and responsibly leverage technology while maintaining discipline and strategic clarity. In an increasingly digital financial world, technology is no longer a support tool—it is the backbone of modern trading.
