BTC/USD 1 Day Time Frame Live intraday BTC/USD price (1‑day timeframe): ~$90,368 USD (with a high near ~$92,705 and low near ~$89,560 today) — updated in real‑time.
Real‑time exchange aggregator sites also show similar live ranges:
• BTC ranges roughly $89,500 – $92,700 (24h low/high) on major exchanges.
• Live price data from CoinMarketCap & CoinGecko shows ~$90,100 – $92,300 in recent pricing.
📊 Daily (1D) Key Levels — BTC/USD
Support Levels (bullish buffers where price may bounce):
S1: ~$90,200 – $90,300 — near current trading zone and pivot support.
S2: ~$87,600 – $88,000 — secondary support zone from recent range structure.
S3: ~$85,500 – $86,000 — stronger support if sellers push deeper.
Resistance Levels (sell pressure zones / breakout targets):
R1: ~$94,800 – $95,000 — first upside resistance from pivot targets.
R2: ~$97,000 – $97,500 — medium‑term resistance from recent range highs.
Psychological / higher area: ~$100,000 round number. Traders watch this as a big breakout level if BTC climbs above R2. (Observed market behavior)
📈 Daily Price Range (Current 24h)
Approximate intraday price band:
Low: ~$89,500
High: ~$92,700
This defines today’s 1‑day candle range — useful for intraday support/resistance decisions.
Trendcontinuationpatterns

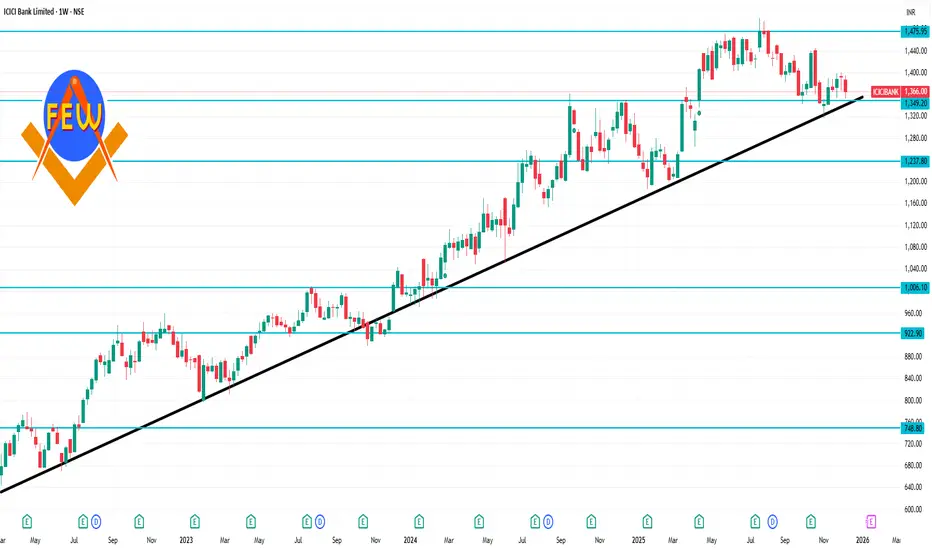
ICICIBANK 1 Week Time Frame 📌 Current Price Snapshot
ICICIBANK ~ ₹1,366 – ₹1,390 (approx) on NSE (recent trading range).
📈 Weekly Pivot Levels (Key Levels for the Week)
(These are calculated using the previous week’s high, low, and close)
Level Type Value
Weekly Pivot (CP) ₹1,337
Weekly Resistance 1 (R1) ₹1,357
Weekly Resistance 2 (R2) ₹1,371
Weekly Resistance 3 (R3) ₹1,391
Weekly Support 1 (S1) ₹1,323
Weekly Support 2 (S2) ₹1,303
Weekly Support 3 (S3) ₹1,289
Central Pivot Range (CPR):
Top CPR: ₹1,340
Bottom CPR: ₹1,334
(CPR is often a good intraday/weekly trend indicator: above CPR = bullish, below = bearish)
SUZLON 1 Day Time Frame 📈 Live Price Snapshot (Today)
Current price: ~₹53.0 per share (approx latest NSE market data).
Today’s range: roughly ₹52.50 – ₹53.10 so far.
📊 Daily Pivot, Support & Resistance Levels
🔹 Daily Pivot (Reference Level)
Pivot Point: ~₹52.03 — this is the key central level to gauge bias.
📉 Support Levels — Daily
S1: ~₹51.24 – ₹51.44 (first support)
S2: ~₹50.69 – ₹50.86
S3: ~₹49.81 – ₹49.01
(Breaks below these are bearish on the daily chart)
📈 Resistance Levels — Daily
R1: ~₹52.67 – ₹53.21
R2: ~₹53.55 – ₹53.88
R3: ~₹54.10 – ₹54.98
(Closes above these points signal short‑term bullish strength)
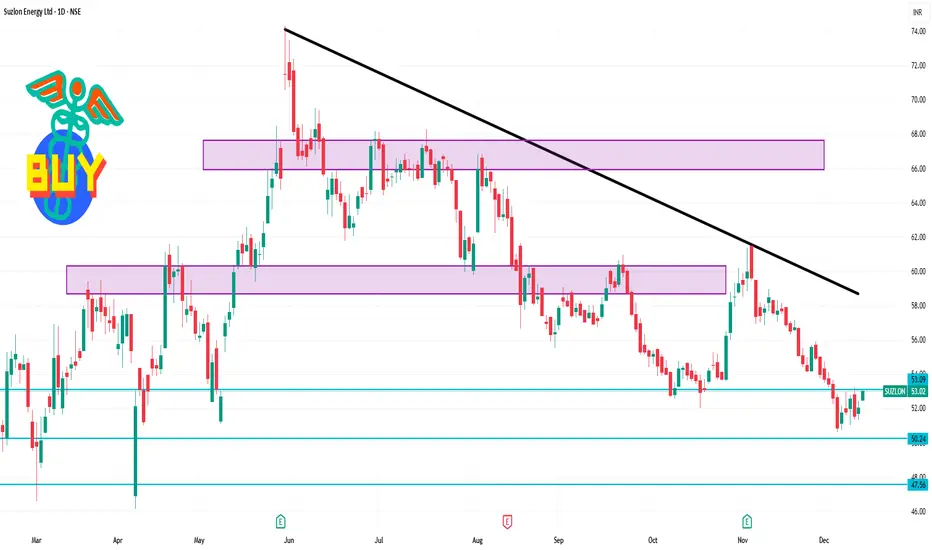
ABB 1 Day Time Frame 📍 Current Price (as of latest market update)
• Around ₹5,278 on NSE/BSE today (Mid-day/last traded level) — up ~0.68% vs previous close.
🔁 Daily Pivot, Support & Resistance Levels (1-Day Frame)
These are dynamic levels derived from recent trades & pivot formulas used by traders to gauge likely intraday turning points:
📊 Standard Daily Pivot Levels (based on recent data):
Level Approx Value
R3 (Strong Resistance) ₹5,377
R2 (Secondary Resistance) ₹5,338
R1 (First Resistance) ₹5,308
Pivot Point (Central) ~₹5,269
S1 (First Support) ₹5,239
S2 (Secondary Support) ₹5,200
S3 (Strong Support) ₹5,170

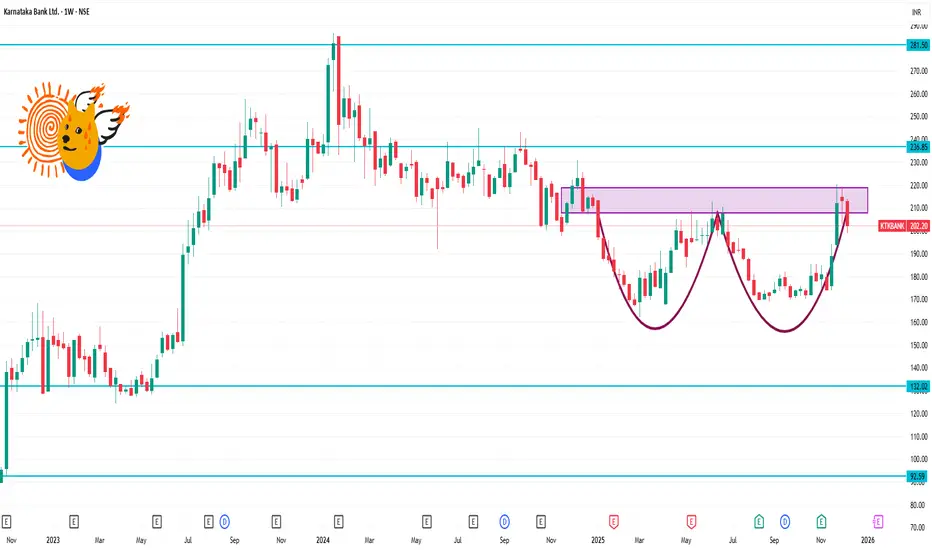
KTKBANK 1 Week Time Frame 📊 Weekly Time-Frame Levels (Support & Resistance)
🔁 Current Context (Price ~ ₹200-₹205 area)
Latest share price is around ₹202-₹206 on NSE.
🛑 Resistance Zones
₹205–₹208 – Near weekly pivot resistance/short-term supply zone
₹210–₹214 – Major horizontal resistance from recent price action
₹220–₹225+ – Next higher resistance cluster / previous swing area
(Break above ₹214/₹220 could signal further strength)
🟩 Support Zones
₹196–₹200 – Immediate weekly support zone
₹188–₹192 – Stronger weekly support (near prior consolidation lows)
₹180–₹185 – Key level if broader pullback continues
(Break below ₹188 could accelerate declines)
Financial Market Types: A Comprehensive Overview1. Capital Markets
Capital markets are financial markets where long-term securities with maturities of more than one year are traded. These markets are crucial for raising funds for long-term investments in projects, infrastructure, and corporate expansion. Capital markets are broadly divided into primary markets and secondary markets.
a. Primary Market
The primary market is also known as the new issue market. In this market, companies and governments raise funds by issuing new securities. Investors purchase these securities directly from the issuer, and the funds raised are utilized for capital expenditure, research and development, or expansion projects. The most common instruments in the primary market include:
Equity shares: Stocks issued by companies to raise ownership capital.
Bonds: Debt instruments issued by corporations or governments.
Debentures and preference shares: Long-term financial instruments that provide fixed income to investors.
The primary market plays a crucial role in facilitating economic growth by channeling savings into productive investments.
b. Secondary Market
Once securities are issued in the primary market, they are traded in the secondary market, also called the stock market. Investors buy and sell existing securities, creating liquidity and price discovery. The secondary market ensures that investors can convert their holdings into cash easily. Prominent examples include:
Stock exchanges: Organized exchanges like the New York Stock Exchange (NYSE), NASDAQ, and National Stock Exchange (NSE) in India.
Over-the-counter (OTC) markets: Decentralized markets where securities are traded directly between parties without an organized exchange.
The secondary market’s efficiency affects the attractiveness of primary market investments, as investors consider the ease of exit before investing.
2. Money Markets
The money market is a segment of the financial market that deals with short-term debt instruments, typically with maturities of less than one year. This market facilitates liquidity management for governments, banks, and corporations. It is considered low-risk and is essential for meeting short-term funding requirements. Key instruments include:
Treasury bills (T-bills): Short-term government securities with maturities ranging from a few days to one year.
Commercial paper (CP): Unsecured short-term debt issued by corporations to meet working capital needs.
Certificates of deposit (CDs): Time deposits issued by banks that offer fixed interest rates.
Repurchase agreements (Repos): Short-term loans backed by securities as collateral.
Money markets are critical for ensuring financial stability, providing a mechanism for central banks to control liquidity and interest rates.
3. Foreign Exchange Markets (Forex)
The foreign exchange market is where currencies are traded. It is the largest financial market in the world, operating 24 hours a day, and plays a vital role in facilitating international trade and investment. Participants include banks, multinational corporations, hedge funds, and individual investors. Major functions include:
Currency conversion: Facilitating global trade by allowing the exchange of one currency for another.
Hedging foreign exchange risk: Protecting businesses and investors from currency fluctuations using forward contracts, options, and swaps.
Speculation: Traders attempt to profit from changes in exchange rates.
The forex market is highly liquid, decentralized, and influenced by economic policies, geopolitical events, and interest rate differentials.
4. Derivatives Markets
Derivatives are financial instruments whose value is derived from an underlying asset, such as stocks, bonds, commodities, currencies, or indices. Derivatives markets provide mechanisms for hedging, speculation, and arbitrage. The two main categories are:
Futures and Forwards: Contracts obligating the purchase or sale of an asset at a predetermined price on a specific future date. Futures are standardized and traded on exchanges, while forwards are customized OTC contracts.
Options: Contracts giving the buyer the right, but not the obligation, to buy or sell an asset at a predetermined price before a specific date.
Swaps: Agreements to exchange cash flows or financial instruments, commonly used for interest rate or currency risk management.
Derivatives markets are critical for risk management in modern financial systems. They allow companies to lock in prices and manage exposure to fluctuating markets.
5. Commodity Markets
Commodity markets are platforms for trading raw materials or primary products. These markets facilitate price discovery, hedging against price volatility, and investment opportunities. They are divided into:
Physical markets: Commodities are bought and sold in tangible form, such as agricultural produce, metals, and energy resources.
Futures markets: Standardized contracts for future delivery of commodities, allowing producers and consumers to hedge against price changes.
Major commodities include gold, silver, crude oil, wheat, and natural gas. Commodity markets are sensitive to supply-demand dynamics, geopolitical events, and global economic trends.
6. Cryptocurrency and Digital Asset Markets
With technological advancement, digital assets like cryptocurrencies, non-fungible tokens (NFTs), and blockchain-based securities have emerged. These markets operate on decentralized platforms, allowing peer-to-peer trading. Key features include:
High volatility: Digital assets can experience rapid price movements.
Decentralization: Transactions are conducted without intermediaries through blockchain technology.
Innovation and adoption: Cryptocurrencies offer alternative investment options and new financial services such as decentralized finance (DeFi).
Though relatively new, cryptocurrency markets are increasingly integrated into traditional financial systems.
7. Bond Markets
Bond markets, also known as debt markets, are segments where fixed-income securities are issued and traded. Governments, municipalities, and corporations issue bonds to finance projects. Types of bonds include:
Government bonds: Considered low-risk and issued by national governments.
Corporate bonds: Issued by companies to raise capital; riskier than government bonds.
Municipal bonds: Issued by local authorities to fund public projects.
Bond markets are critical for long-term financing and provide a stable investment option for risk-averse investors.
8. Over-the-Counter (OTC) Markets
OTC markets are decentralized markets where trading occurs directly between two parties without a formal exchange. They handle securities, derivatives, and currencies. OTC markets are flexible, allowing customized contracts, but they carry higher counterparty risk. OTC trading is essential for assets not listed on exchanges and for large institutional transactions.
9. Interbank Markets
Interbank markets are specialized markets where banks lend to and borrow from one another to manage liquidity. They play a vital role in money market operations and interest rate determination. Instruments traded include overnight loans, certificates of deposit, and foreign exchange swaps. Interbank markets are crucial for banking stability and smooth functioning of the financial system.
10. Emerging Markets
Emerging financial markets refer to rapidly developing economies that are integrating into the global financial system. They offer higher growth potential but carry higher risk due to political, economic, and currency uncertainties. Examples include India, Brazil, and South Africa. These markets include equities, bonds, derivatives, and currency trading and attract both domestic and foreign investors.
Conclusion
Financial markets are the backbone of modern economies, facilitating capital allocation, liquidity, risk management, and economic growth. They range from traditional equity, debt, and money markets to advanced derivative, forex, commodity, and digital asset markets. Each type of market serves a unique function, caters to different participants, and operates under specific regulatory frameworks. By understanding the structure and role of these markets, investors can make informed decisions, companies can access necessary capital, and policymakers can maintain economic stability.
Financial markets continue to evolve with technology, globalization, and innovation. The integration of digital platforms, algorithmic trading, and decentralized finance is transforming traditional market mechanisms, making financial markets more accessible, efficient, and dynamic. For participants, comprehending the diversity and nuances of financial markets is essential to navigate opportunities and risks effectively.

Volume Profile and Market Analysis: A Comprehensive Guide1. Introduction to Volume Profile
Volume Profile is a graphical representation that shows the amount of trading volume that occurred at specific price levels over a given period. Unlike standard volume indicators that display total volume per time period (bars or candles), Volume Profile organizes volume price-wise, highlighting where trading activity has been concentrated.
Key elements of a Volume Profile include:
Point of Control (POC): The price level with the highest traded volume, representing an area of significant interest or consensus between buyers and sellers.
Value Area (VA): The price range where a significant portion of total volume (usually 70%) occurs. This area helps identify fair value for the asset.
High Volume Nodes (HVN): Price zones with high trading activity, often acting as strong support or resistance.
Low Volume Nodes (LVN): Price zones with low trading activity, indicating potential breakout or rejection areas.
By focusing on volume at price rather than volume over time, traders gain a clearer understanding of market sentiment, institutional activity, and potential future price behavior.
2. Importance of Volume Profile in Market Analysis
Volume Profile provides structural clarity that other indicators often miss:
Identifying Key Levels: Volume Profile highlights areas where the market participants have shown the highest interest, forming natural support and resistance zones.
Understanding Market Sentiment: A market trading above its Value Area suggests bullish sentiment, while trading below indicates bearish sentiment.
Spotting Imbalances: Low-volume areas often indicate price rejection or gaps in trading activity, suggesting potential areas for rapid price movement.
Assisting Risk Management: Traders can better define stop-loss and take-profit levels based on high-volume nodes, minimizing the risk of being stopped out by normal market fluctuations.
In essence, Volume Profile provides a macro-level view of price acceptance and rejection, enabling traders to anticipate market behavior with higher precision.
3. How Volume Profile Works
To understand the workings of Volume Profile, consider a market like the Nifty 50 or a stock like Reliance.
Step 1 – Data Collection: Volume Profile uses tick-by-tick or minute-by-minute data to calculate total volume at each price level.
Step 2 – Constructing the Profile: For each price level, the cumulative volume is plotted horizontally. This forms a histogram-like structure over the price axis.
Step 3 – Analyzing the Profile: Traders analyze the histogram to find the POC, HVNs, LVNs, and Value Area. The shape of the profile often reveals market sentiment:
D-Shaped Profile: Indicates a balanced market with equilibrium between buyers and sellers. Price tends to oscillate within the Value Area.
P-Shaped Profile: Suggests strong bullish activity with absorption at lower levels and buying pressure pushing prices higher.
b-Shaped Profile: Reflects bearish sentiment, where sellers dominate and price struggles to move higher.
Understanding these shapes allows traders to anticipate whether the market is likely to trend or remain range-bound.
4. Volume Profile in Conjunction with Market Analysis
Market analysis is broadly divided into technical analysis, fundamental analysis, and sentiment analysis. Volume Profile complements all three.
a. Technical Analysis
Volume Profile enhances traditional technical tools like support/resistance, trendlines, and candlestick patterns by adding the dimension of trading activity concentration.
For example, a resistance level confirmed by a high-volume node is significantly stronger than one identified by price action alone.
Traders can also combine Volume Profile with moving averages or RSI to refine entry and exit points.
b. Fundamental Analysis
While fundamentals like earnings, macroeconomic data, or geopolitical events drive long-term price trends, Volume Profile helps gauge the short-term reaction of market participants.
For instance, if positive earnings lead to a price spike but Volume Profile shows rejection at higher levels (low-volume node), traders might anticipate a pullback.
c. Sentiment Analysis
Volume Profile captures the footprints of institutional trading.
Large participants often accumulate or distribute positions at specific price levels, which appear as high-volume nodes.
Observing these nodes provides clues about market psychology and potential directional bias.
5. Practical Applications of Volume Profile
Support and Resistance Identification:
Traders use high-volume nodes as natural support/resistance levels. Breakouts above or below these nodes are considered significant.
Trend Confirmation and Reversals:
If the price stays above the POC and Value Area, the trend is bullish.
If it drops below, the market may be entering a bearish phase.
Entry and Exit Strategies:
Volume Profile allows precise placement of entries and exits. Buying near LVNs or selling at HVNs can enhance reward-to-risk ratios.
Scalping and Intraday Trading:
Intraday traders use Volume Profile to identify areas of liquidity and price acceptance, helping in quick decision-making for short-term trades.
Gap Analysis:
Low-volume areas act as potential “gaps” where price can move rapidly, enabling traders to exploit breakout opportunities.
6. Limitations of Volume Profile
While powerful, Volume Profile is not without limitations:
Requires Accurate Data: Tick-level or high-resolution volume data is essential for precision.
Doesn’t Predict Market Direction: Volume Profile shows areas of interest but cannot guarantee future movement.
Works Best in Liquid Markets: Illiquid assets may produce misleading volume distributions.
Needs Contextual Analysis: Relying solely on Volume Profile without trend, news, or sentiment analysis can lead to poor decisions.
7. Combining Volume Profile with Other Analysis Tools
To maximize its potential, Volume Profile should be used with complementary tools:
Moving Averages: To confirm trend direction relative to high-volume nodes.
Candlestick Patterns: To validate reversals or breakouts at key levels.
Fibonacci Retracements: To identify confluences between retracement levels and high-volume zones.
Order Flow Analysis: To track live buying/selling pressure in relation to Volume Profile levels.
By integrating these tools, traders achieve a multi-dimensional understanding of market structure, enhancing both timing and accuracy of trades.
8. Conclusion
Volume Profile is a critical tool in modern market analysis, bridging the gap between price action and volume dynamics. By highlighting areas where market participants have concentrated their activity, it provides actionable insights into support, resistance, trend strength, and potential breakout zones. When combined with technical, fundamental, and sentiment analysis, it empowers traders to make informed decisions with a structured approach to risk and reward.
Ultimately, mastering Volume Profile requires practice and observation, but once understood, it becomes a powerful lens for seeing the market’s inner workings, allowing traders to anticipate movements rather than react to them. Whether for intraday scalping, swing trading, or long-term investing, Volume Profile remains a cornerstone for serious market participants aiming for consistency and precision in their trading strategies.
Part 9 Trading Master Class With ExpertsRisks in Option Trading Strategies
Options offer flexibility, but risks vary.
1 Premium Decay
Option buyers lose premium rapidly as expiry approaches.
2 Volatility Crush
IV drops after major events → huge loss for long straddle/strangle buyers.
3 Assignment Risk
Short options may be assigned early in American-style options.
4 Unlimited Loss Potential
Selling naked options exposes traders to large losses.

Part 4 Learn Institutional Trading In the Money (ITM), At the Money (ATM), Out of the Money (OTM)
Depending on the strike price relative to the current market price, options are classified as:
ITM Options
Have intrinsic value.
Call: Strike < Spot
Put: Strike > Spot
ATM Options
Strike = Spot (approximately)
Mostly time value.
OTM Options
No intrinsic value; only time value.
Call: Strike > Spot
Put: Strike < Spot
OTM options are cheaper and used by beginners often, but they carry high risk.

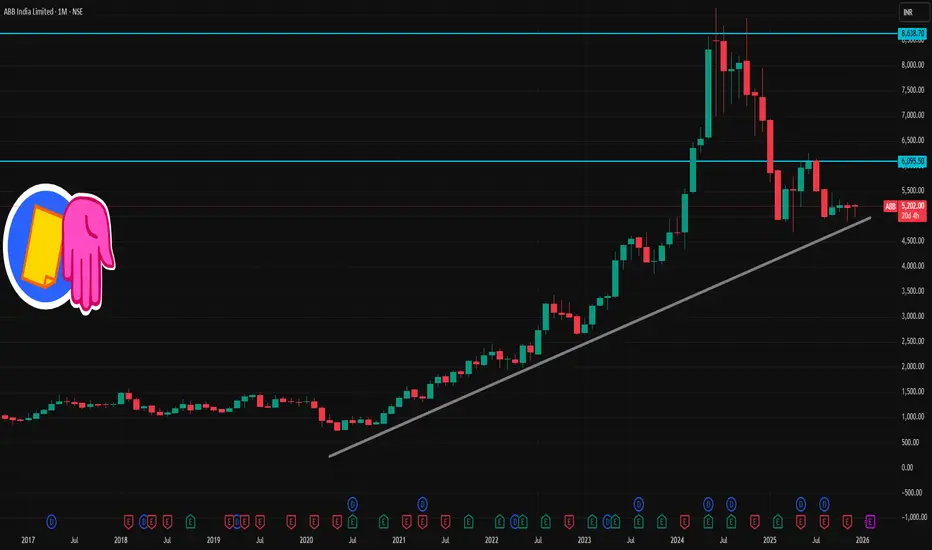
ABB 1 Month Time Frame 📌 Current Snapshot
Latest price — ~ ₹ 5,200–₹ 5,210 (most recent quoted range)
52‑week range: ~ ₹ 7,960 (high) / ₹ 4,684–4,590 (low)
✅ What Traders Might Watch Today / Very Short Term
If price holds above ₹ 5,190–5,210, bias might be slightly positive — see if it tests ₹ 5,260–5,280 (R1).
A drop below ₹ 5,120 could trigger slide toward ₹ 5,110 or even test support around ₹ 5,145 (S1).
A clean breakout above ₹ 5,280 (especially with good volume) may open move toward ₹ 5,320–5,350 (R2).
If broader market turns negative, ₹ 5,110–5,145 zone is a key alert/support area.
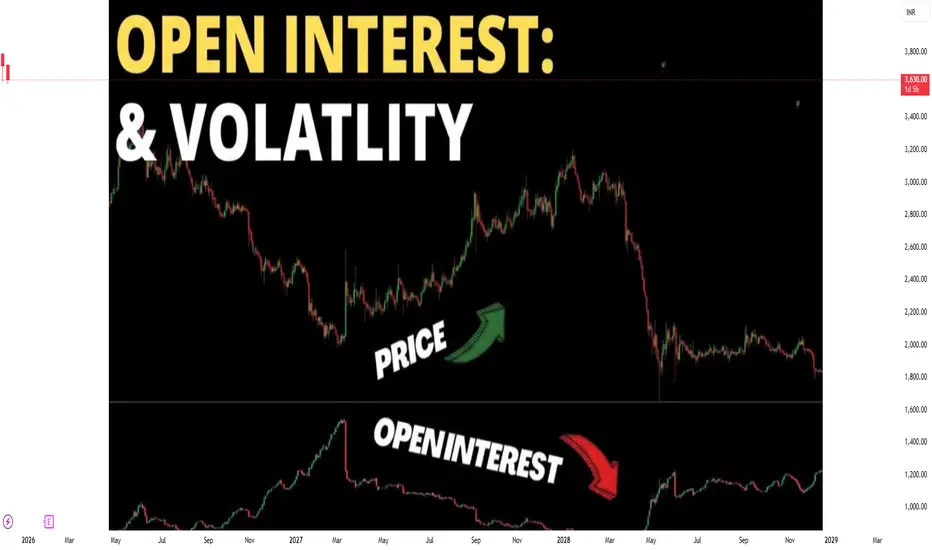
Understanding Open Interest and Volatility1. Open Interest: Definition and Significance
Open interest (OI) refers to the total number of outstanding derivative contracts, such as futures or options, that have not been settled or closed. Unlike trading volume, which measures the number of contracts traded during a specific period, open interest reflects the accumulation of positions in the market.
Key Points about Open Interest:
Indicator of Market Participation:
High open interest suggests a liquid and active market with many participants. Conversely, low open interest can indicate a less active market, where prices may be more susceptible to manipulation or sudden moves.
Trading Strategy Implications:
Trend Confirmation: Rising open interest along with rising prices typically confirms an uptrend. Similarly, rising open interest with falling prices can confirm a downtrend.
Potential Reversals: If open interest decreases while prices continue in the same direction, it may signal a weakening trend and a potential reversal.
Example:
Suppose in Nifty 50 call options, there are 50,000 outstanding contracts for a specific strike price. This is the open interest. If traders open 5,000 new contracts and close 2,000, the updated open interest becomes 53,000.
Types of Open Interest Changes:
Increase in OI with Price Increase: Indicates strong buying and bullish sentiment.
Increase in OI with Price Decrease: Suggests strong selling and bearish sentiment.
Decrease in OI with Price Increase/Decrease: Often shows traders are closing positions, which could signal market consolidation or a trend reversal.
2. Volatility: Definition and Types
Volatility measures the degree of variation of a financial instrument's price over time. It represents uncertainty or risk in price movements and is a fundamental concept in trading, risk management, and option pricing.
Types of Volatility:
Historical Volatility (HV):
It is calculated based on past price movements over a specific period. It indicates how much an asset's price fluctuated in the past.
Historical Volatility
=
Standard Deviation of Price Returns
Historical Volatility=Standard Deviation of Price Returns
Implied Volatility (IV):
Implied volatility is derived from the market price of options. It reflects the market’s expectations of future price fluctuations. High IV indicates the market expects large price movements, while low IV indicates relative calm.
Realized Volatility:
The actual volatility observed during a particular period. This is often compared with implied volatility to assess whether options are overvalued or undervalued.
Significance of Volatility:
Risk Assessment: Higher volatility implies higher risk and potential reward, which is critical for traders and risk managers.
Option Pricing: Volatility is a key input in the Black-Scholes and other option pricing models. Options tend to be more expensive when volatility is high.
Market Sentiment Indicator: Sudden spikes in volatility often reflect uncertainty, news events, or economic shocks.
Example:
If the Nifty 50 index fluctuates between 19,500 and 20,500 over a month, the volatility is measured based on the degree of these price changes. If options on Nifty reflect high implied volatility, traders expect further large swings.
3. Relationship Between Open Interest and Volatility
Open interest and volatility are interconnected in multiple ways:
Market Sentiment Indicator:
Rising open interest accompanied by rising volatility often signals that traders are aggressively taking positions in anticipation of significant price movements.
Liquidity and Price Swings:
Higher open interest can provide better liquidity, which may reduce short-term volatility. Conversely, in low-OI markets, even small trades can lead to sharp price swings.
Option Strategies:
In options trading, the interplay between open interest and implied volatility is crucial:
High OI + High IV = Liquid market but potentially expensive options.
Low OI + High IV = Less liquidity, more risk for entering/exiting trades.
Trend Analysis:
Traders often use the combination of price trend, open interest, and volatility to confirm trends or identify potential reversals.
4. Practical Applications in Trading
A. Futures and Options Trading:
Traders monitor open interest to identify which strike prices have the most open contracts, often referred to as "max pain" points, indicating potential support and resistance levels.
Implied volatility helps in deciding whether to buy or sell options. High IV may favor selling options, while low IV may favor buying options.
B. Risk Management:
Portfolio managers use volatility metrics to assess Value at Risk (VaR) and adjust positions accordingly.
Open interest provides insights into market exposure and liquidity, critical for managing large positions.
C. Intraday and Swing Trading:
Intraday traders often track sudden changes in open interest and volatility to anticipate short-term price moves.
Swing traders use historical volatility to set stop-loss levels and profit targets.
5. Indicators and Tools for Open Interest and Volatility
Open Interest Indicators:
Open Interest Analysis Charts: Show changes in OI for specific contracts.
Put-Call Ratio (PCR) with OI: Helps in gauging market sentiment for options.
Volatility Indicators:
Bollinger Bands: Uses standard deviation to gauge price volatility.
Average True Range (ATR): Measures the average movement of prices over a period.
VIX Index: Measures market-wide expected volatility (e.g., India VIX for Nifty options).
6. Challenges and Misconceptions
Open Interest is not directional: It only shows the number of contracts, not whether the market is bullish or bearish. Context with price movement is essential.
Volatility can be misleading: High volatility does not always imply a falling market; it may also indicate strong upward movements.
Interpreting both together: Correct interpretation requires combining price trends, OI changes, and volatility levels; isolated analysis can lead to false signals.
7. Conclusion
Open interest and volatility are pillars of market analysis for both retail and institutional traders. Open interest provides insight into market participation, liquidity, and potential trend strength, while volatility gauges price fluctuations, market risk, and option pricing dynamics. Together, they help traders:
Confirm trends and anticipate reversals.
Assess market sentiment and liquidity.
Strategize option trades based on risk and reward.
Make informed decisions in futures, options, and stock markets.
A successful trader combines these metrics with technical and fundamental analysis to navigate financial markets effectively. Ignoring either can lead to incomplete understanding and potential losses. Mastery of open interest and volatility allows traders to anticipate market moves, manage risk, and exploit opportunities systematically.
Institutional Trading Secrets: Understanding the Big Players1. The Scale Advantage
One of the most significant “secrets” of institutional trading is scale. Institutions have enormous capital, allowing them to negotiate lower trading costs, access exclusive research, and execute trades with minimal price impact through sophisticated algorithms. Retail traders often overlook the importance of scale, which allows institutions to implement strategies like:
Block Trades: Executing large orders off-exchange to prevent market disruption.
Dark Pools: Private exchanges where institutions can buy or sell large volumes anonymously.
Reduced Slippage: The ability to execute trades with minimal deviation from expected prices.
The scale advantage also allows institutions to diversify extensively across sectors, asset classes, and geographies, reducing risk and increasing the potential for higher returns.
2. Information Edge
Information asymmetry is a key element of institutional trading. Institutions often have access to research, data, and analytics that retail investors simply cannot match. This includes:
Proprietary Research: Many investment banks and funds employ teams of analysts to produce high-quality research on markets, sectors, and individual securities.
Market Intelligence: Institutional traders often receive early information about economic trends, corporate earnings, or mergers and acquisitions.
Alternative Data: Institutions increasingly leverage unconventional data sources like satellite imagery, credit card transactions, social media sentiment, and web traffic to gain an informational edge.
These resources allow institutions to anticipate price movements before they become visible to the broader market.
3. Advanced Trading Strategies
Institutional traders employ complex strategies that maximize profits while minimizing risk. Some of these include:
Algorithmic Trading: Algorithms can automatically execute trades based on pre-defined criteria like price, volume, or time. High-frequency trading (HFT) is a subset where trades occur in milliseconds.
Pairs Trading: Institutions exploit temporary divergences between correlated securities, buying one and shorting another.
Statistical Arbitrage: Using quantitative models to identify mispricings or anomalies across markets.
Options Hedging: Institutions frequently use options to hedge positions, reduce downside risk, or create leverage.
Liquidity Provision: Large institutions sometimes act as market makers, profiting from bid-ask spreads while managing risk exposure.
These strategies often require sophisticated technology and substantial capital—tools generally unavailable to individual traders.
4. Market Psychology Mastery
Institutional traders understand that markets are not purely rational—they are driven by human behavior. They exploit market psychology to their advantage:
Stop Hunting: Institutions may push prices to trigger stop-loss orders of retail traders, creating liquidity for their large trades.
Sentiment Analysis: Using news, social media, and order flow to gauge market sentiment and predict price movements.
Contrarian Approach: Institutions often take positions opposite to crowded retail trades, knowing that mass panic or euphoria can create price distortions.
By understanding retail behavior and psychological tendencies, institutions can strategically enter and exit positions without significantly affecting the market against their interests.
5. Timing and Execution Secrets
Execution timing is a critical aspect of institutional trading. Large orders can significantly impact prices, so institutions use various methods to optimize execution:
VWAP (Volume Weighted Average Price): Institutions execute trades in a way that aligns with average market price throughout the day, reducing market impact.
TWAP (Time Weighted Average Price): Distributing trades evenly over a period to avoid sudden price swings.
Dark Pools & Block Trades: Executing large trades away from public exchanges to prevent signaling intentions to other market participants.
Iceberg Orders: Large orders broken into smaller visible portions to avoid revealing the full size to the market.
Proper execution ensures that institutions can accumulate or liquidate positions without creating unnecessary volatility.
6. Risk Management Expertise
Institutions excel in risk management, using advanced tools to protect portfolios:
Diversification: Spreading investments across various sectors, asset classes, and geographies.
Hedging: Using derivatives like options, futures, and swaps to offset potential losses.
Stress Testing: Simulating market scenarios to evaluate portfolio performance under adverse conditions.
Position Sizing: Allocating capital to minimize exposure to any single trade or market.
Risk management is a cornerstone of institutional trading, ensuring long-term profitability even in volatile markets.
7. Understanding Market Structure
Institutions have an intimate knowledge of how financial markets operate:
Liquidity Pools: They know where and when liquidity exists, allowing efficient trade execution.
Order Flow Analysis: Institutions can read order books, tracking supply and demand imbalances.
Regulatory Knowledge: Understanding rules, circuit breakers, and tax implications allows institutions to trade efficiently without legal issues.
This deep comprehension of market mechanics provides a strategic advantage over retail traders, who often trade without insight into the bigger market picture.
8. The Role of Relationships and Networking
Institutional trading often leverages relationships with brokers, banks, and other institutions to gain preferential access to information or execution. These relationships can provide:
Early Access to IPOs: Institutions often get allocations of high-demand initial public offerings.
Private Placements: Opportunities to buy securities before they reach public markets.
Research Collaboration: Access to joint studies and market insights.
Networking ensures that institutions are always positioned at the forefront of opportunities.
9. Psychological Discipline
Institutional traders emphasize emotional control, a crucial but often overlooked secret. Unlike retail traders who may panic during downturns or chase momentum, institutions:
Follow Rules-Based Strategies: Trades are based on research and predefined rules, not impulses.
Maintain Patience: Institutions often hold positions for months or years, ignoring short-term noise.
Focus on Probabilities: Decision-making is rooted in statistical analysis rather than emotion.
Discipline is as critical as capital in institutional trading, helping sustain profitability over the long term.
10. Why Retail Traders Struggle to Replicate Institutions
Despite access to the same markets, retail traders often fail to emulate institutional success due to:
Capital Limitations: Small trades are vulnerable to slippage and lack influence over prices.
Emotional Trading: Impulsive decisions often lead to losses.
Information Gaps: Retail traders lack the research, data, and networking that institutions enjoy.
Execution Inefficiency: Large trades are harder for retail traders, but small trades can still be impacted by timing and liquidity.
Understanding these limitations helps retail traders set realistic expectations and adopt strategies that work within their constraints.
Conclusion
Institutional trading secrets revolve around scale, information, strategy, execution, risk management, and psychological discipline. Institutions exploit advantages in capital, research, and market insight to navigate complex markets with precision and control. While retail traders cannot fully replicate these advantages, understanding how institutions operate can improve decision-making, timing, and strategy in trading. By observing market patterns, analyzing order flow, and maintaining discipline, retail traders can align more closely with institutional logic—without necessarily having billions to invest.
In essence, institutional trading is less about luck and more about methodical planning, technological leverage, and disciplined execution. Knowing these secrets doesn’t guarantee profits, but it equips traders with a framework to think like the market’s most powerful participants.

Part 2 Intraday Trading Master Class Risk-Management Tips
Even the best strategy fails without discipline. Here’s the real game:
Avoid unlimited risk strategies early in your journey.
Never sell naked options without proper hedging.
Always size positions correctly—use only what you can afford to lose.
Monitor volatility (VIX, IV) before entering.
Know your exit even before you enter a trade.

Part 1 Candle Stick Patterns What Is an Option?
An option is a contract between a buyer and a seller.
The buyer pays a premium to purchase the right.
The seller receives the premium and takes on the obligation.
Every option contract has:
Strike Price – the predetermined price for buying or selling the asset
Expiry Date – the date on which the option contract ends
Premium – the cost of the option
Lot Size – fixed quantity of the underlying asset
Understanding these fundamentals is crucial before diving into live trading.

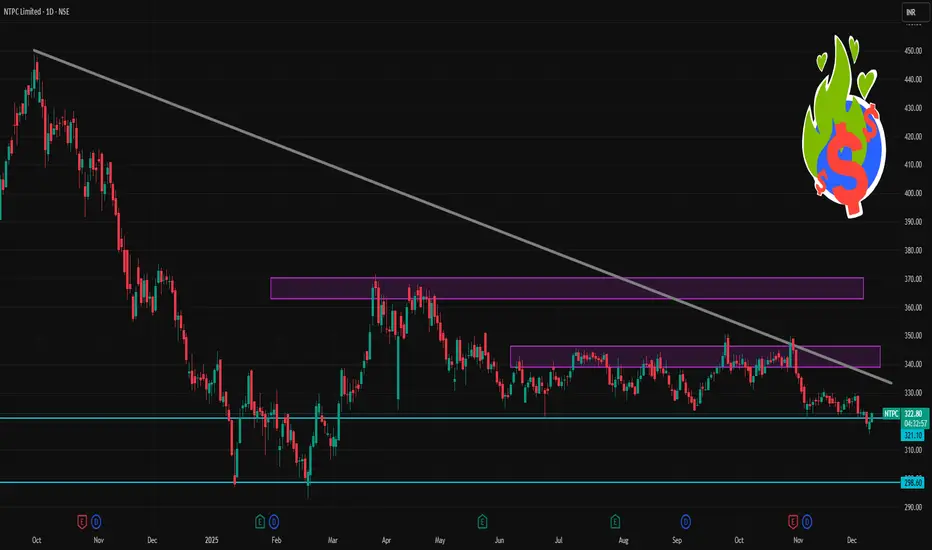
NTPC 1 Day Time Frame 📊 Current Price (Approx)
Trading around ₹319–₹320 on NSE (latest intraday range) — this is the most recent live price you’ll see on charts right now (delayed ~20 sec) and confirmed by TradingView data.
🎯 1-Day Pivot & Support-Resistance Levels
✅ Pivot Point
Central Pivot: ~₹318.9 – ₹319.4 (daily pivot based on recent range)
📈 Resistance Levels
R1: ~₹321–₹322 (first immediate hurdle)
R2: ~₹324–₹325 (stronger resistance)
R3: ~₹327–₹328+ higher barrier if momentum picks up
📉 Support Levels
S1: ~₹316–₹317 — first support zone intraday pivot tests
S2: ~₹313–₹314 — secondary support zone
S3: ~₹310–₹311 — deeper support if the stock weakens sharply
👉 These levels are typical pivot-based support/resistance from standard daily pivot calculations and recent technical tools (Classic/Fibonacci/Camarilla).
Swing Trading Strategies for Indian Stocks1. What Makes Swing Trading Effective in the Indian Market?
The Indian market has certain characteristics that make swing trading powerful:
Trending behaviour: Nifty, Bank Nifty, and sectors show clear medium-term trends.
FII-DII flows impact swings: Foreign inflows cause rallies; domestic booking brings dips.
Sector rotation: IT, Pharma, PSU, Metals, Banks rotate in cycles.
Volatility with direction: Ideal for capturing 3–10 day moves.
High liquidity stocks allow clean chart structures.
Because of these characteristics, stocks like Tata Motors, Reliance, HDFC Bank, L&T, ICICI Bank, BEL, Coal India, LTIM, HAL, and PSU banks offer excellent swing opportunities.
2. Core Swing Trading Concepts
2.1 Trend Structure
Before entering any swing trade, determine the trend:
Higher Highs & Higher Lows (HH-HL) = Uptrend
Lower Highs & Lower Lows (LH-LL) = Downtrend
Sideways consolidation = breakout/breakdown opportunity
Always trade in direction of trend for higher success.
2.2 Pullbacks and Reversals
Swing trades are often taken when:
Price pulls back to support in an uptrend
Price retests resistance in a downtrend
Price breaks out of consolidation
2.3 Support and Resistance Zones
Identify:
Weekly support/resistance
Daily swing highs/lows
Round levels like 100, 200, 500, 1000
50-day or 200-day moving averages
Strong zones = high-probability entries.
3. Best Swing Trading Strategies for Indian Stocks
Below are top-performing swing trading strategies tailor-made for the Indian market.
Strategy 1: Moving Average Pullback Strategy
This is the simplest and most reliable swing strategy.
How it works
Identify a stock in strong uptrend using 20 EMA & 50 EMA
Wait for a pullback to 20 EMA (aggressive) or 50 EMA (conservative)
Price must show bullish candle near EMA
Entry
Buy on bullish confirmation candle
Volume spike increases confidence
Stop Loss
Below recent swing low
Target
2–3x risk
Or next resistance
Best suited for
Trending stocks like PSU, banking, large caps.
Strategy 2: Breakout and Retest Strategy
Breakouts happen often in the Indian market because of strong retail + FII participation.
Steps
Identify a tight consolidation zone (triangle, flag, channel).
Wait for breakout with volume.
Do NOT buy breakout blindly; wait for retest.
Enter when retest shows bullish candle.
Why it works
Retest confirms:
Institutions support the breakout
False breakout is avoided
Best suited for
Midcaps (HAL, BEL, IRFC, JWL)
Momentum stocks
Strategy 3: RSI + Trendline Reversal Strategy
Combines momentum and price structure.
Setup
Draw a trendline connecting swing lows in uptrend.
Wait for price to touch trendline.
Check RSI between 38–45 (oversold in trend).
Entry
Enter when bullish candle appears at trendline.
Stop Loss
Just below trendline
Targets
Recent swing high or 1:2 risk–reward
Why it works
RSI 40 is the “bullish support zone” in strong uptrends.
Strategy 4: Inside Candle (NR4/NR7) Breakout Strategy
NR4/NR7 = Narrow Range candles, which signal volatility contraction.
Indian stocks behave strongly after volatility contraction.
Steps
Identify Inside Candle or NR4/NR7 pattern.
Mark high and low of inside candle.
Buy when price breaks above high.
Sell when price breaks below low.
Works best in
Stocks before results
Momentum phases
Strategy 5: Fibonacci Swing Trading Strategy
Used to find precise swing entries.
Steps
Identify strong impulsive upmove.
Draw Fib retracement.
Key buying zones:
38.2%
50%
61.8%
Confirmation
Bullish candle at zone
RSI above 40
Volume stabilizing
Targets
Previous swing high
127% or 161% extension
This method is widely used by India’s quantitative swing traders.
Strategy 6: Multi-Timeframe Swing Strategy
This increases accuracy by aligning multiple timeframes.
Steps
Check weekly trend (bigger trend)
Identify daily entry (swing pullback or breakout)
Confirm with 4-hour momentum
Example
Weekly shows uptrend
Daily pulls back to support
4H shows breakout candle
This gives extremely high-probability swing trades.
4. How to Select Stocks for Swing Trading in India
Selecting the right stocks matters more than strategy.
4.1 Criteria
High liquidity (above ₹300–500 crore daily turnover)
High relative strength vs Nifty
Stocks above 50-day and 200-day moving averages
Strong sector trend (sector rotation)
Volume patterns showing institutional activity
Best sectors for swing trades
PSU stocks
Banking
Defense
Auto
Metals
FMCG during slow markets
Avoid
Penny stocks
Illiquid stocks
Corporate governance issues
5. Indicators Useful for Swing Trading in India
Use indicators only for confirmation, not as signals.
1. Moving Averages
20 EMA (aggressive swing)
50 SMA (medium)
200 SMA (long trend)
2. RSI
Buy dips when RSI is 40–45 in uptrend
Sell rallies when RSI is 55–60 in downtrend
3. MACD
Confirms trend continuation.
4. Volume
One of the most important indicators:
Breakouts must have high volume
Retests should have low volume
6. Risk Management for Swing Trading
Risk management is the backbone of swing trading.
Position Sizing
Risk only 1–2% of capital per trade.
Stop Loss Placement
Must be based on swing low/high
Never place SL too tight
Profit Target
Maintain at least 1:2 Reward-to-Risk
Trail stop when price moves in your favor
Avoid Overnight Risk
Avoid holding during:
Major events
Budget announcements
RBI policy
Global event risk (US Fed)
7. Tools for Swing Trading
Charting
TradingView
ChartInk (Indian screeners)
Investing.com
Scanners
ChartInk swing scanner
TradingView breakout scanner
Volume surge screeners
Brokerage Platforms
Zerodha Kite
Upstox Pro
ICICI Direct Neo
Angel One Smart
8. Psychology for Swing Trading
Swing trading requires:
Patience to wait for setups
Discipline to exit when stop is hit
Ability to ignore intraday noise
Consistency in following rules
Most swing traders fail because they:
Enter too early
Exit too early
Add to losing trades
Trade too many stocks at once
Focus on quality, not quantity.
9. Example of a Complete Swing Trading Plan
Scan for stocks making higher highs.
Mark support zones on daily chart.
Wait for pullback with decreasing volume.
Enter on bullish candle with volume confirmation.
Place SL below swing low.
Target previous resistance.
Trail stop using 20 EMA.
This simple model can achieve high accuracy.
Final Summary
Swing trading in Indian stocks offers profitable opportunities because of strong trends, sector rotations, and active participation from institutions and retail traders. The most effective strategies include:
Moving average pullbacks
Breakout + retest
RSI + trendline reversals
Inside bar volatility breakouts
Fibonacci retracements
Multi-timeframe confirmation
With proper risk management, psychology, and disciplined execution, swing trading can become one of the most profitable and low-stress trading styles in the Indian equity market.

Part 9 Trading Master ClassWhat Are Options?
An option is a financial contract that gives the buyer the right, but not the obligation, to buy or sell an underlying asset (like Nifty, Bank Nifty, or a stock) at a fixed price before a specific time.
There are two types of options:
1. Call Option
A call option gives the buyer the right to buy the underlying asset at a fixed price (called the strike price).
You buy a call when you expect price to go up.
Example: If Nifty is at 22,000 and you buy a 22,000 CE (Call Option), you profit if Nifty goes above 22,000 (after covering premium).
2. Put Option
A put option gives the buyer the right to sell the underlying asset at a fixed price.
You buy a put when you expect price to fall.
Example: If Bank Nifty is at 48,000 and you buy 48,000 PE (Put Option), you profit if the price falls below 48,000.

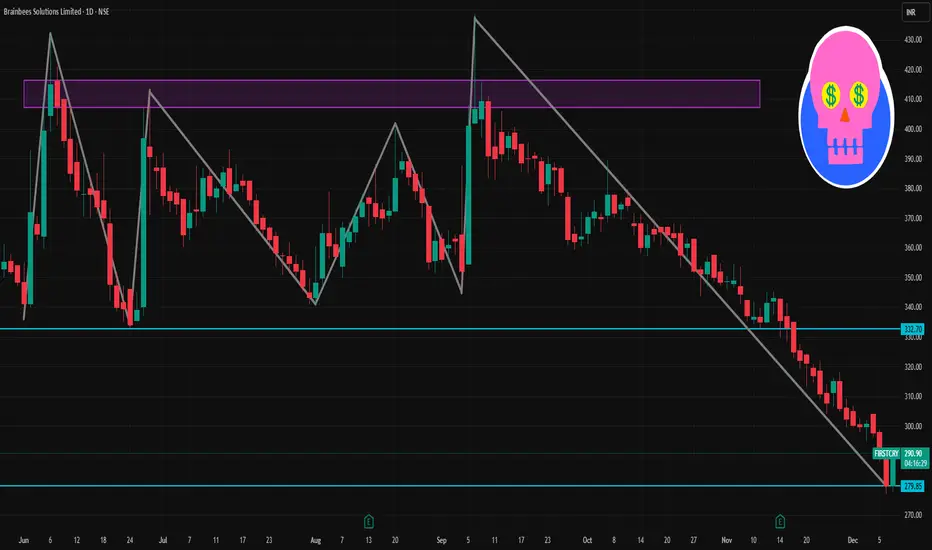
FIRSTCRY 1 Day Time Frame 📊 What the 1‑day chart for Brainbees Solutions currently shows
As of recent trading, the share price of Brainbees Solutions is around ₹ 279–290 on NSE.
The 52‑week high and low band shows a high near ~₹ 664–665 and a low around ~₹ 277–286.
That means at current ~₹ 280–290, the stock is very close to its 52‑week low — which may make the “day‑timeframe level” important for traders looking for a bounce or reversal.
Some technical‑analysis data (on certain days) show bearish momentum: for example, on a recent day the stock hit an all‑time low of ₹ 287, continuing a downtrend.
Part 8 Trading Master Class Option Buyer vs Option Seller
Option Buyer
Pays premium
Risk is limited to premium
Profit potential is unlimited (for call) or large (for put)
Needs a strong directional move
Time decay works against the buyer
Option Seller
Receives premium
Risk can be unlimited (if market moves sharply)
Profit is limited to premium received
Benefits from sideways market
Time decay works in seller’s favour
Option sellers usually need more capital because of higher risk.

Part 7 Trading Master Class How Option Pricing Works
The price of an option (premium) depends on many factors:
1. Underlying Price
If the market moves in the option’s direction (up for call, down for put), the premium rises.
2. Strike Price
Closer the strike to current price, higher the premium.
3. Time to Expiry
More time → higher premium (more chances of movement)
4. Volatility
Higher volatility → higher premium.
5. Interest rates and dividends
These have minor effects but still influence pricing models.

Part 4 Learn Institutional Trading Advantages of Option Trading
1. Limited Risk for Buyers
Buyers can only lose the premium.
2. Leverage
You control a big position with small capital.
3. Flexibility
Can be used for speculation, hedging, income, blending multiple strategies.
4. Huge Earning Potential
Strong moves give massive percentage returns.

Premium Chart Patterns Premium patterns help traders understand:
Smart money manipulation
Market structure transitions
Liquidity-based entries
Institutional imbalances
Reversal and continuation logic
They are more reliable than basic chart patterns because they reflect:
Actual institutional logic
Market psychology
Liquidity engineering
Price inefficiencies and corrections
Premium chart patterns are essential for traders who want to trade professionally and understand the true mechanics behind price movement.

Algo Trading & Backtesting1. What Is Algorithmic Trading?
Algorithmic trading (algo trading or automated trading) uses computer programs to execute buy and sell orders based on predefined rules. These rules are written using logic, mathematics, technical indicators, statistical models, or machine learning.
Key characteristics:
Speed: Algorithms execute trades in milliseconds.
Accuracy: Orders are placed exactly as coded, without emotional interference.
Consistency: Strategies run the same way every time.
Scalability: Algorithms can scan hundreds of stocks simultaneously.
Automation: Removes manual effort and human error.
Examples of algo rules:
Buy when the 50-day moving average crosses above the 200-day moving average.
Enter long if RSI < 30 and exit if RSI > 60.
Execute mean reversion when prices deviate from their statistical average.
Place a market-making order when bid-ask spread widens beyond a threshold.
Algo trading is used widely in equities, commodities, forex, crypto, futures, and options markets.
2. Why Algo Trading Matters
Algo trading is not just for institutions anymore. Retail traders now have access to powerful tools like NinjaTrader, TradingView Pine Script, Amibroker AFL, Python (Pandas, NumPy), Zerodha Streak, AlgoBulls, etc.
There are several advantages:
1. Eliminates emotions
Fear, greed, hesitation, revenge trading—algos remove them completely.
2. Enhances speed & efficiency
A computer can process multiple charts at once—no possibility for manual delays.
3. Reduces costs
Efficient execution reduces slippage, spreads, and missed opportunities.
4. Backtesting improves confidence
You know how your strategy performed historically before risking real capital.
5. Suitable for all market styles
Trending, scalping, intraday, swing trading, options strategies—algos cover everything.
3. Core Components of Algo Trading
1. Strategy Logic
The brain of the algorithm. Types include:
Trend-following strategies
Mean reversion models
Breakout systems
Arbitrage models
Options premium-selling/hedging algorithms
Machine learning predictive models
2. Data
The quality of the data determines the quality of your strategy.
Historical data (OHLC, volumes)
Real-time data (market feed)
Fundamental data
Tick/Orderbook data (advanced)
3. Programming Environment
Most common:
Python
TradingView Pine Script
Amibroker AFL
C++ (HFT level)
MetaTrader MQL
Proprietary platforms
4. Execution Engine
A platform that sends orders to the exchange via API.
5. Risk Management Module
Includes:
Stop-loss
Target
Position sizing (fixed lot, % of capital)
Max daily loss
Drawdown limits
Volatility filters
6. Monitoring & Optimization
Live dashboards help track:
Real-time P&L
Slippage
Latency
Execution errors
4. Backtesting – The Heart of Algo Trading
You cannot run an algorithm blindly. You must test it on past data to understand how it behaves. This process is called backtesting.
What Is Backtesting?
Backtesting is the simulation of a trading strategy on historical price data to evaluate its performance. It answers questions like:
Would the strategy have made money?
How much drawdown would it suffer?
What is the risk-reward ratio?
How consistent are returns?
How often does it win?
How Backtesting Works?
Step 1: Define the rules
Example strategy:
Buy when price closes above 20 EMA
Sell when price closes below 20 EMA
Risk 1% of capital per trade
Stop-loss = 1.5%
Target = 3%
Step 2: Select historical data
A minimum of:
2–5 years for intraday
5–10 years for swing
10–15 years for trend models
Step 3: Run the simulation
The software applies your rules on every candle historically.
Step 4: Analyze metrics
Some essential backtesting metrics:
✔ CAGR (Annual Return)
Measures yearly profit.
✔ Win Rate %
How many trades were profitable vs total bets.
✔ Profit Factor
Total gross profit ÷ total gross loss.
PF > 1.5 = Good; PF > 2 = Strong.
✔ Drawdown %
The maximum fall from peak equity.
Lower drawdown = safer strategy.
✔ Sharpe Ratio
Reward/risk ratio based on volatility.
✔ Average trade return
Shows how much each trade earns.
✔ Expectancy
Average win × win rate − average loss × loss rate.
Step 5: Optimize (carefully!)
Adjust parameters to improve performance, but avoid overfitting.
5. Types of Backtesting
1. Historical Backtesting
Runs strategy on past OHLC data.
2. Walk-Forward Testing
Split data into in-sample (training) and out-of-sample (testing).
3. Monte Carlo Simulation
Tests strategy performance across random variations.
4. Paper Trading / Forward Testing
Real-time simulation in live markets without real money.
6. Why Backtesting Can Mislead (Pitfalls)
Backtesting is powerful but dangerous if not done correctly.
1. Overfitting
Your strategy may perform well on history but fail in real markets.
2. Look-Ahead Bias
Using future data unknowingly, giving unrealistic results.
3. Survivorship Bias
Testing only stocks that survived, ignoring delisted ones.
4. Slippage & Transaction Costs
Real-world execution is worse than simulated execution.
5. Market Regime Changes
A strategy profitable during trending phases may fail during sideways markets.
Professional algo traders spend more time fixing biases than writing strategies.
7. Algo Trading Strategies Common in India
1. Trend-Following on NIFTY Futures
EMA crossover, Supertrend, Donchian breakout.
2. Options Selling Strategies
Short Straddle
Short Strangle
Iron Condor
Delta-neutral hedged selling
3. Mean Reversion in Bank Nifty
Price touches lower Bollinger Band → Buy.
4. Intraday Momentum
Breakout of previous day high/low.
5. Arbitrage Models
Cash–futures arbitrage, index arbitrage.
8. Tools & Platforms to Start Algo Trading
Beginner-Friendly
Zerodha Streak
Dhan Options Trader
Angel Algo
TradingView (Pine Script)
Intermediate
Python (using broker APIs)
Amibroker AFL
MetaTrader MQL
Advanced / Professional
QuantConnect
AlgoQuant
C++ HFT engines
Custom low-latency systems
9. Steps to Build a Profitable Algo Trading System
Step 1: Identify a market inefficiency
Find behaviors that occur consistently:
Monday gap filling
Tuesday volatility
Post-2:30 p.m. breakouts
Overnight momentum
Step 2: Create rules
Clear, unambiguous logic.
Step 3: Backtest
Use extensive and high-quality data.
Step 4: Evaluate metrics
Cut poor strategies early.
Step 5: Forward test
Test in real time without money.
Step 6: Deploy small capital
Scale only after long-term stability.
Step 7: Monitor & refine
Markets change → algos must evolve.
Conclusion
Algo trading and backtesting together form a powerful framework for systematic, disciplined, and scalable trading. Instead of relying on emotions or random decisions, traders build clear rules, test them against history, validate them in real-time, and automate execution to gain precision and consistency. With proper design, risk control, and continuous improvement, algorithmic trading can significantly enhance performance in equities, commodities, forex, indices, and options.