XAUUSD Bullish Continuation | Buy the Dip @ 4400 - 4375Gold (XAUUSD) has delivered a strong bullish impulse following heightened geopolitical tensions involving the US and Venezuela. Price is holding firmly above the 4400 key support zone, signaling sustained bullish strength.
As long as gold maintains acceptance above this level, the bias remains bullish, with upside targets at 4440 and 4470.
We are patiently waiting for a healthy pullback toward support to look for high-probability buy opportunities in line with the prevailing trend.
📌 Disclaimer:
This analysis is for educational purposes only and is not financial advice. Always manage risk and follow your trading plan.
Your feedback drives our content and keeps everyone trading smarter. Let’s make those pips together! 🚀
Happy Trading,
– The InvestPro Team
Trendfollowing

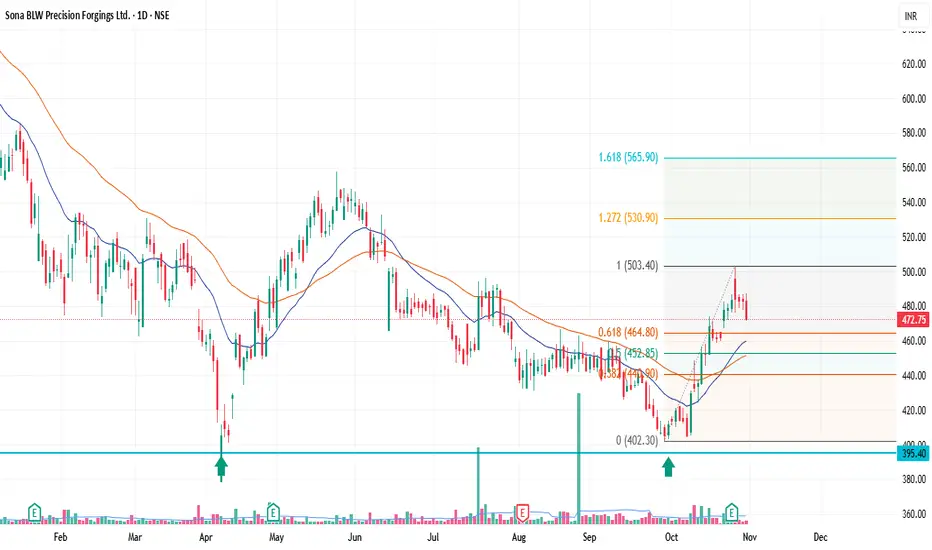
Sona BLW Precision Forgings Ltd. (SONACOMS) — pullback setup(SONACOMS) — Bullish Pullback Setup
📅 Timeframe: 1D | 💰 CMP: ₹472.75 | 📈 Volume: Above average
Technical View
Sona BLW has completed a strong impulse wave from ₹402 → ₹503, followed by a healthy pullback.
Price is now retracing near the 0.618 Fib level (₹464.8), aligning with the 21EMA — a zone that often acts as support during trend continuation.
Volume on the breakout was strong, showing accumulation interest.
Trade Plan
Entry Zone: ₹465–₹470
Stop Loss: ₹450 (below 0.5 Fib and 20EMA)
Targets:
🎯 T1: ₹503
🎯 T2: ₹530 (Fib 1.272)
🎯 T3: ₹566 (Fib 1.618)
Summary
✅ Uptrend resumption likely if ₹450 holds
✅ Rising 21EMA & 50EMA support the structure
✅ Strong breakout volume confirms institutional buying
Bias: Bullish
Risk–Reward: ~1:2.5+
Invalidation: Close below ₹450
Disclaimer : Risk management is crucial in this volatile market, so keep position sizing appropriate. This analysis is intended for educational purposes and not financial advice.
Long Term Long Trade - HCL, Infy, TCSThe IT pack is looking to start up now. HCL has started, Infy and TCS are about to.... Enter above this week's high, stop loss below the previous low as shown in video. Trail your stops. Enjoy. Use your discretion.

Golden EMA Setup – Catch Medium-Term Trends with 50 & 200 EMA!Hello Traders!
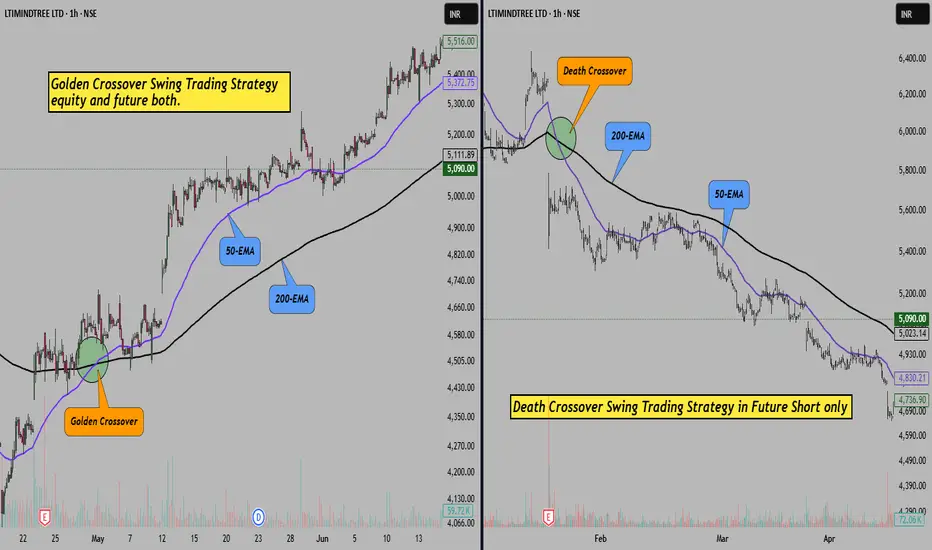
One of the simplest yet most powerful ways to identify long-lasting trends is by using moving averages. And among all combinations, there’s one that stands out for swing and positional trades, the Golden EMA Setup .
It uses just two tools: the 50 EMA and the 200 EMA. When used correctly, this setup helps you ride big trends and avoid choppy zones.
Let’s understand how this works and how you can apply it.
What is the Golden EMA Setup?
It’s a trend-following strategy based on the crossover of two EMAs:
50 EMA (Fast Average): Reacts quicker to price changes
200 EMA (Slow Average): Represents the long-term trend
When 50 EMA crosses above 200 EMA, it’s considered a Golden Crossover , a bullish signal.
When 50 EMA crosses below 200 EMA, it’s a Death Crossover , a bearish signal.
How to Trade This Setup:
Entry:
Buy when 50 EMA crosses above 200 EMA and price is above both.
Stop Loss:
Just below the 200 EMA or recent swing low.
Target:
Trail the stop loss and ride the trend till the crossover reverses or price weakens.
Timeframe:
Works best on daily or 1-hour chart for positional/swing trades.
Rahul Tip:
Golden EMA setup works great during trending phases, but avoid using it in sideways markets — you may get trapped in whipsaws. Always confirm with volume or RSI divergence before entering.
Did you ever used this strategy before, let me know in comment box.
How Richard Dennis Created Millionaires Turtle Trading ExperimntHello Traders!
Imagine you’re a total beginner. No experience. No finance degree. No trading background. Now imagine someone teaches you a simple trading system. Trains you for just two weeks. And then gives you real money to manage. Sounds like a dream, right. But it actually happened in the 1980s. A legendary trader named Richard Dennis did it. And many of the people he trained went on to become millionaires.
This was called the Turtle Trading Experiment .
And it changed the way people looked at trading forever.
Who Was Richard Dennis? (The Trader Who Taught Success)
Richard Dennis started with just $1,600 and grew it to more than $200 million through commodities trading. But his biggest legacy was not his profits. It was his belief that trading success can be taught.
He once said:
“We can grow traders just like they grow turtles in Singapore.” That quote became the foundation of the Turtle experiment.
What Was the Turtle Experiment All About?
Richard Dennis had a debate with his friend William Eckhardt. Dennis believed that anyone, could be trained to trade. Eckhardt disagreed. To settle the argument, Dennis placed an ad and selected a small group of everyday people.,They included teachers, musicians, engineers, and people who had never traded before. He trained them for two weeks. Then gave them real capital to trade.
What Strategy Did the Turtles Follow? (Simple and Powerful)
Breakout Entry:
They entered trades when price crossed a 20-day or 55-day high or low.
Trend Following:
They stayed in the trade until the trend reversed.
Position Sizing:
They calculated trade size based on market volatility.
ATR-Based Stop Loss:
Each trade had a fixed stop loss using Average True Range.
Multi-Market Trading:
They traded futures across different asset classes like gold, oil, corn, currencies, and indices.
How Did the Turtles Perform?
The outcome was unbelievable. Most of them made large profits. Some became hedge fund managers. The average returns were far above industry standards.
What’s important is that these were not naturally gifted traders.
They simply followed the rules, stayed consistent, and trusted the process.
Rahul Tip:
Don’t overcomplicate trading.
Even a basic breakout strategy can make money if traded with discipline and risk control.
Before chasing complex setups, ask yourself: Am I even following one simple system properly?
Conclusion:
The Turtle Trading Experiment proved that trading is not magic.
It’s a skill that can be taught, practiced, and mastered.
All you need is a solid system and the mindset to follow it every single time.
Would you trust a mechanical strategy like the Turtles did? Or do you prefer full control? Let’s talk in the comments!
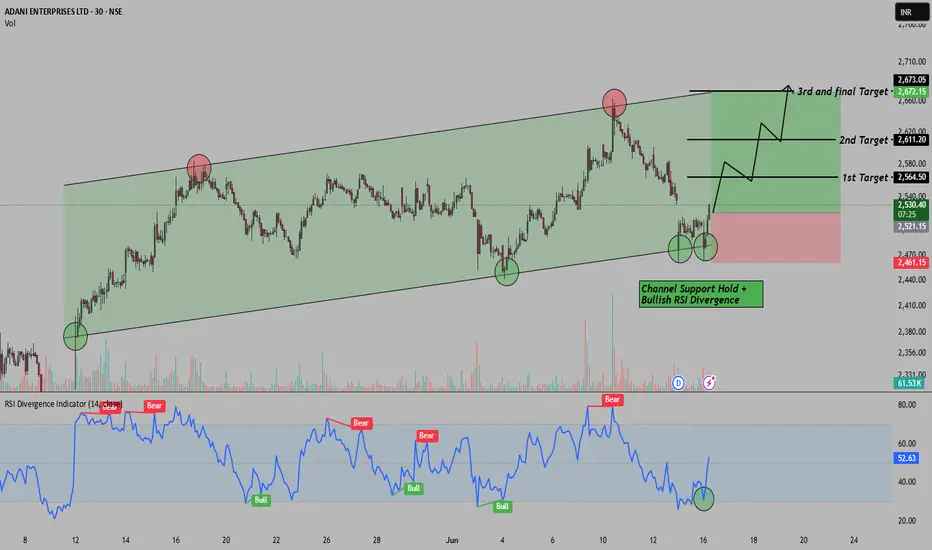
Rising Channel+RSI Divergence=Reversal Setup in Adani EnterpriseHello Everyone, i hope you all will be doing good in your life and your trading as well. Today i have brought a setup in Adani Enterprises , where we’re spotting a short-term reversal opportunity inside a clean rising channel . Price recently tested the channel support for the 3rd time and gave a solid bounce, which is also confirmed by a bullish RSI divergence . This combo often works as a reliable early reversal signal for positional or intraday swing traders. Here we are expecting at least 4%+ move behalf of this setup.
This trade is completely logic based so i placed Stop loss around 2461 for controlled risk. for the targets please check the chart above i have mention there.
Reward-to-Risk Ratio looks favorable here , especially with clear trend structure and momentum support from RSI. Let’s see how this setup plays out!
If you liked this breakdown, don’t forget to LIKE & FOLLOW for more real chart setups, data-backed ideas, and smart money zones.
Disclaimer: This post is for educational purposes only. Do your own research or consult a financial advisor before investing.
Mark Minervini: Master of Trend Following and Risk Management!Mark Minervini: Master of Trend Following and Stock Market Success
Hello everyone! Today, we’re diving into the world of Mark Minervini , a U.S. stock trader and author who has made a significant impact in the trading world. Known for his trend-following strategies and risk management mindset , Minervini is widely respected for his disciplined approach to the market.
Mark Minervini’s philosophy is built around timing the market right, managing risk, and investing in stocks with momentum . His success can be attributed to his ability to combine technical analysis , fundamental analysis , and strict risk management into a coherent strategy.
Mark Minervini’s Key Trading Principles
Buy High, Sell Higher: Minervini’s strategy is focused on buying stocks at breakout points , when they are moving above previous highs, signaling strong momentum and potential for larger gains.
Look for Stocks with Strong Fundamentals and Technicals: He believes in a balanced approach, using both fundamental analysis and technical indicators to identify stocks that have the potential to deliver strong returns.
The 90-90 Rule: Minervini’s 90-90 rule suggests that 90% of the time, the market moves with the top 10% performing stocks , and those top-performing stocks often deliver massive returns.
Cut Losses Quickly and Let Profits Run: A central principle of Minervini’s strategy is risk management . He advocates cutting losses quickly and letting profits run , ensuring that small losses don’t turn into bigger ones.
Risk Management Mindset: Mark Minervini stresses the importance of having a risk management mindset when trading. Managing risk is just as important as identifying profitable trades. He advises traders to always protect capital , as this is the foundation of long-term success in the market.
Stay Disciplined and Follow a System: Minervini’s success is rooted in his disciplined approach. He sticks to his rules and doesn’t deviate from his proven system, regardless of market fluctuations.
Mark Minervini’s Iconic Trades
✔ Stock Breakouts: Minervini made a fortune by buying stocks at breakout points where stocks are showing strong upward momentum.
✔ Growth Stocks in Bull Markets: He focuses on identifying high-growth stocks in strong bull markets, which consistently outperform the broader market.
✔ Precise Entry Points: Minervini does not just buy any stock but waits for specific technical patterns that suggest high-probability entry points.
What This Means for Traders:
By following Minervini’s principles, traders can:
Focus on high-performing stocks with upward momentum that break above key resistance levels.
Prioritize risk management and always be ready to cut losses to protect your capital.
Stay disciplined and follow a systematic approach that relies on precise entry points and controlled risk.
Leverage both technical and fundamental analysis to make smarter, more informed decisions.
Outcome:
Mark Minervini’s success is a result of his comprehensive approach to trading , which includes precise entry points, strong risk management, and a disciplined mindset. Traders who follow these principles can improve their results and take their trading to the next level.
What do you think of Mark Minervini’s trading approach ? Have you implemented any of his strategies in your own trades? Share your thoughts in the comments below!

Ed Seykota: The Trend-Following Legend Every Trader Must Know!Ed Seykota: The Mastermind Behind Trend Following
Hello, traders! 🚀 I hope you're all doing great in life and in your trading journey. Today, I bring you an educational post on Ed Seykota , one of the most successful traders of all time and a pioneer of trend-following strategies . His ability to ride trends and manage risk has made him an inspiration for traders worldwide.
Seykota revolutionized trading in the 1970s by developing one of the first computerized trading systems . He transformed a small trading account into millions using a disciplined, rule-based approach. His philosophy focuses on cutting losses early, riding winning trades, and following the market trend without emotional bias.
🔥 Ed Seykota’s Golden Rules of Trading
The Trend is Your Friend: Trade with the prevailing market trend. Fighting the market leads to unnecessary losses.
Cut Losses Quickly: Holding onto losing trades is a mistake. Accept small losses and move on to the next opportunity.
Ride Winners Until the Trend Ends: Let your profits run. Exiting too early limits your potential gains.
Risk Management is Crucial: Never risk too much on a single trade. Capital preservation is key to long-term success.
Follow a Systematic Approach: Avoid emotional decisions. A well-defined strategy ensures consistency.
Markets are Unpredictable: No trade is certain. Focus on probabilities and proven strategies rather than predictions.
🚀 What This Means for Traders:
By applying trend-following strategies , risk management , and disciplined execution , traders can navigate market uncertainty, avoid emotional decisions, and maximize long-term profitability.
🎯 Final Thought:
Ed Seykota once said: “Win or lose, everybody gets what they want from the market.” The key is to develop the right mindset and stick to a solid strategy .
💡 What’s your biggest takeaway from Seykota’s trading philosophy? Share your thoughts in the comments! 👇

Jesse Livermore’s Trading Secrets: Master the Market Like a ProHello everyone, i hope you all will be doing good in your life and your trading as well. Today again i have brought an educational post on Jesse Livermore and he was a legendary trader known for his market timing, trend-following strategies, and risk management principles. His insights on speculation and discipline remain highly relevant for traders today., So let's Start and apply this in your Trading and Investing to achieve Success.
The Market is Never Wrong: Instead of blaming the market, analyze your own mistakes and improve your strategy.
Trend is Your Friend: Always trade in the direction of the prevailing trend. Avoid going against strong market momentum.
Patience Pays: Wait for the perfect trade setup before entering a position. Rushing into trades leads to losses.
Cut Losses Quickly: Never hold onto losing trades hoping they will recover. Exit bad trades early to protect capital.
Let Profits Run: When you’re in a winning trade, don’t exit too soon. Ride strong trends to maximize gains.
Trade with Conviction: Only enter trades when you have a well-researched, confident strategy—never trade based on emotions.
Avoid Overtrading: Trading too frequently increases risk and reduces profitability. Focus on quality trades, not quantity.
The Market Repeats Itself: Market patterns and cycles tend to repeat. Study history to recognize opportunities.
Control Your Emotions: Fear and greed are a trader’s worst enemies. Maintain discipline and follow your strategy.
What This Means for Traders:
Following Jesse Livermore’s trading principles can help traders develop discipline, manage risk effectively, and build long-term success in the market.
Outcome:
By applying these strategies, you can improve your trading psychology, avoid common pitfalls, and trade more confidently in any market condition.

CUBEX TUBINGS NEAR ALL TIME HIGH BREAKOUT (Positional Trade)The stock has seen great retracement from its Low of 79.95 on the verge of breaking its ATH and a 9 month long resistance from which stock has been in a consolidation zone for a while and in last 3 weeks stock has seen a good buying rally towards its resistance level , the stock can be bought every pull backs .and might seen a long term target off 162/213/240+ , the stock view neglected below 80.

Mankind Pharma Ltd - Cup with handle pattern formationThe cup with handle pattern is a bullish chart formation resembling a cup with a slight consolidation (handle) on the right. A trading strategy involves entering a position when the price breaks above the resistance level at the top of the cup, ideally after confirming bullish momentum.
Mankind Pharma is forming a cup with handle pattern on the hourly timeframe, signaling potential bullish movement. The handle has formed on a flat base, reinforcing the bullish setup. Where the prior resistance become support (Support-Resistance Flip).
Chart Structure: Price is creating higher tops and higher bottoms, indicating a strong uptrend where as RSI is trending higher and remains above 50, confirming positive momentum.
Trade execution planned above 2835,anticipated target is above 3000, suggesting substantial upside potential if the breakout is confirmed. SL would be the last higher swing low.

🚀 Swing Trading Idea: Buy Position in GalaxySurf 🚀Analysis: GalaxySurf shows strong uptrend potential with solid fundamentals and technical indicators.
Entry: Consider current price
Disclaimer: For informational purposes only. Do your research or consult a financial advisor.

18 Mar ’24 — Is Nifty above or below 22051? Check Chart closelyNifty Analysis - Stance Bearish⬇️
Recap from yesterday: “The only reason we pushed through the resistance yesterday was because of NiftyIT. And today NiftyIT started with cuts of -0.9%. Do you agree with me now that the main villain is NiftyIT which is preventing Nifty50 for a smooth directional trend?”
4mts chart
Is Nifty above or below 22051? I must change the stance from bearish to neutral if it's above. If it's below - then the bearishness continues. As per the chart, Nifty closed at 22051 while the weighted average close was 22055. For some reason or another, I did not feel like punching manual orders today, I just let the algo orders do their magic and was keenly watching the chart and doing nothing. I got a bit excited when Nifty started falling i.e. 11.11 and 11.15 candles when Nifty went till 21916. My marked support was at 21913, so the eagerness was to check if we would break that or not.
If you take a look at the chart, we had multiple instances of touches at 22051 levels, by 14.19 I almost felt we were breaking out and then the bearish positions may go into deep losses. Somehow or the other, I am not able to relate to the price actions of Nifty50, NiftyIT, and BankNifty these days. All 3 of them are never in agreement and you club the “weak hands” holding the CE shorts - a recipe for disaster. The CALL sellers run for cover now and then creating the quick ripples, and then it fades out 30mts hence.
You won't believe me if I said Nifty50 has made a W pattern (double bottom) on the 63mts timeframe. Take a look, you could spell the entire “W”. Interestingly it has formed at the crucial support of 21913. The only thing that could override this W pattern is the lower high, lower low formation. LH, LL will take precedence over a short-duration pattern all the time. For tomorrow, I would like to start the day with the bearish tone itself and see how the 22051 resistance holds.
63mts chart

SWING Trade idea || Go Long in NEWGENFundamentally NEWGEN is a good stock and it has fallen more than 50% since All time High and currently at weekly support.
Risk/Reward Ratio is 9.39 which is excellent in this swing trade idea.


USDJPY Downtrend AnalysisTrade Analysis : Swing USDJPY Downtrend
Trendline analysis on USDJPY
Trend Identification: Swing Downtrend USDJPY.
Support/Resistance Levels: Identify key levels on the chart for potential entry and exit points.
Price Behavior: Daily Bullish pullback with market structure.
Targets: T1 = 143.375, T2 - 143.00. Check for Entry and Stop-loss.
Risk Management: Set appropriate stop-loss levels to manage risk and protect against adverse price movements.
Confirmation Indicators: Support/Resistance Levels, Higher High, Higher Lows.
Conclusion: Based on the chart analysis of , USDJPY is Downtrend has been identified. Combine this analysis with thorough research and risk management strategies to make well-informed trading decisions. Avoid counter-trend trading. Happy trading!
(Note: Trading is subject to market risk. This is analysis not an trade idea for trade.)

USDJPY Swing Downtrend AnalysisTrade Analysis : Swing USDJPY Downtrend
Channel analysis on USDJPY
Trend Identification: Swing Downtrend USDJPY.
Support/Resistance Levels: Identify key levels on the chart for potential entry and exit points.
Price Behavior: Daily Bullish pullback with market structure.
Targets: T1 = 139.00, T2 - 137.50.
Risk Management: Set appropriate stop-loss levels to manage risk and protect against adverse price movements.
Confirmation Indicators: Support/Resistance Levels, Higher High, Higher Lows.
Conclusion: Based on the chart analysis of , USDJPY is Downtrend has been identified. Combine this analysis with thorough research and risk management strategies to make well-informed trading decisions. Avoid counter-trend trading. Happy trading!
(Note: Trading is subject to market risk. This is analysis not an trade idea for trade.)

NIFTY - AnalysisThe key levels for NIFTY are as follows.
The move is just started.
Buy - 18314
Target - 18882

LTIMINDTREE - AnalysisThe key levels for LTIMINDTREE are as follows.
The move is already in progress.
Buy - 4680
Target - 4830

INFY - AnalysisThe key levels for INFY are as follows.
The move is ready to take off.
Buy - 1247
Target - 1365

RELIANCE - AnalysisThe key levels for RELIANCE are as follows.
The move is Just started.
Buy - 2482
Target - 2600


BANKNIFTY 01/03/2023ANALYSIS FOR 01 MARCH 2023. Market is at at important level where it can move upwards or downwards with equal opportunity.
