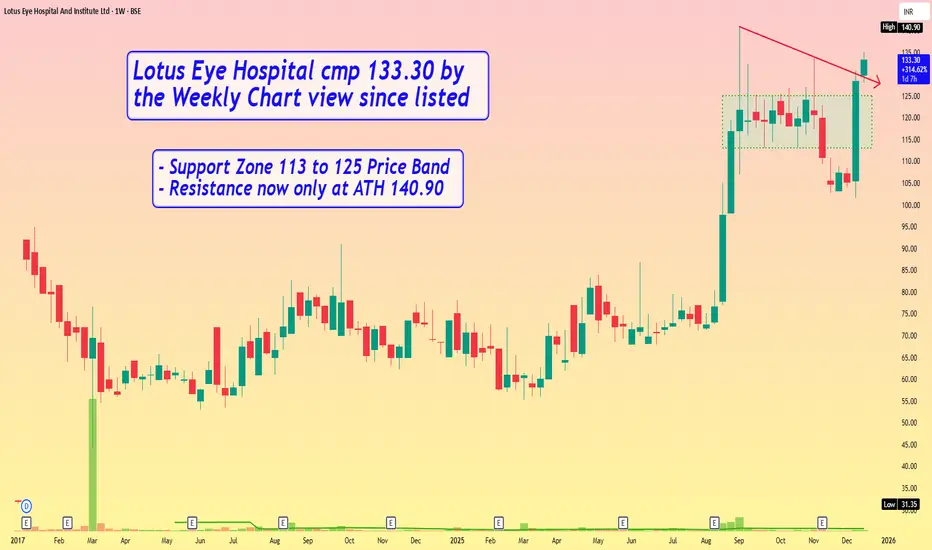
Lotus Eye Hospital cmp 133.30 by Weekly Chart view since listedLotus Eye Hospital cmp 133.30 by Weekly Chart view since listed
- Support Zone 113 to 125 Price Band
- Resistance now only at ATH 140.90
Trendlineanalysis
Part 8 Trading Master Class Option Pricing and the Role of Greeks
Option prices are influenced by multiple factors, not just price direction. These influences are measured by Option Greeks:
Delta – Measures how much the option price changes for a 1-point move in the underlying
Gamma – Measures the rate of change of delta
Theta – Measures time decay; options lose value as expiry approaches
Vega – Measures sensitivity to changes in volatility
Rho – Measures impact of interest rate changes
Understanding Greeks helps traders manage risk, select strategies, and anticipate how options behave under different market conditions.

Part 4 Learn Institutional Trading What Is Option Trading?
An option is a financial derivative whose value is derived from an underlying asset such as a stock, index, commodity, or currency. Option trading involves buying or selling contracts that give the holder the right, but not the obligation, to buy or sell the underlying asset at a predetermined price within a specified time period.
Each option contract has key elements:
Underlying asset – Stock, index (NIFTY, BANKNIFTY), commodity, etc.
Strike price – The price at which the asset can be bought or sold
Expiry date – The date on which the option contract expires
Premium – The price paid by the buyer to the seller (writer) of the option
Options are traded on exchanges and are standardized in terms of lot size and expiry.

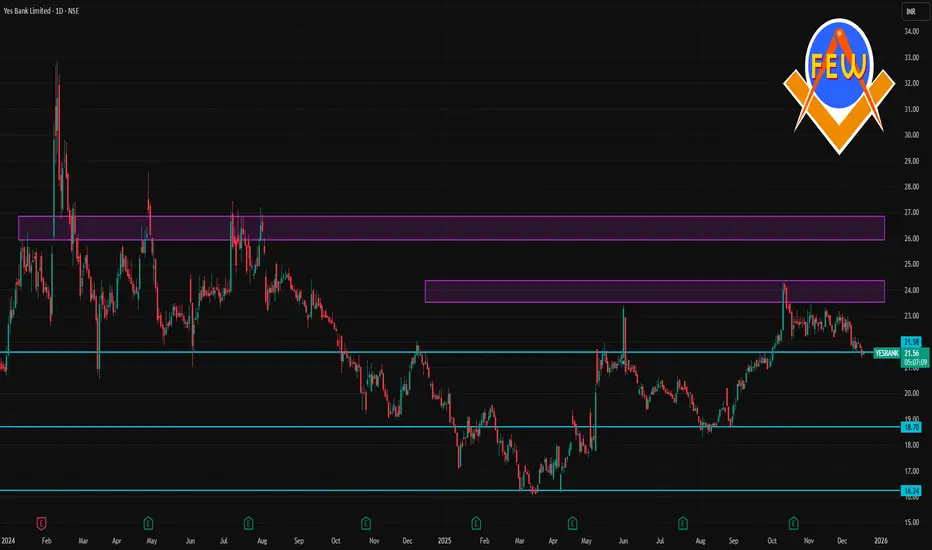
YESBANK 1 Day Time Frame 📊 Daily Time Frame Levels (1 D)
Current approximate price: ~₹21.7–₹22.7 (varies by source)
🔹 Pivot & Daily Reference Level
Daily pivot (Classic): ~ ₹22.58–₹22.60
🧱 Resistance Levels
Immediate resistance: ~ ₹24.00–₹24.03 (1st major upside barrier)
Above that, psychologically significant levels are near recent 52-week highs around ₹24.30
📉 Support Levels
Short-term support: ~ ₹22.22
Medium/stronger support: ~ ₹20.97
Lower support zones (broader view): ~ ₹19.17–₹18.50 (from broader multi-period analysis)
📈 Technical Indicator Snapshot (Daily)
RSI appears mid-range (neutral/slightly weak) on some chart summaries (~40–46), indicating no strong overbought/oversold condition on the daily chart.
Some aggregators still show a general sell bias based on moving averages and oscillator signals (especially if price < longer-term MAs).
🧠 How Traders Often Use These Levels
Bullish scenario: A sustained break above ₹24.00–₹24.30 with volume could target higher levels.
Bearish scenario: Failure below ₹20.97/₹20 may open the way toward ₹19–₹18 region.
Pivot plays: Near daily pivot (~₹22.58), intraday traders often watch for bounces or breaks for direction.
Trade Crypto Like a ProA Complete Guide to Mastering Cryptocurrency Markets
Trading cryptocurrency like a professional is not about luck, hype, or chasing the next trending coin. It is a disciplined process that combines market knowledge, technical skills, risk management, psychology, and continuous learning. The crypto market operates 24/7, is highly volatile, and reacts instantly to global news, making it both an opportunity-rich and risk-heavy environment. Professional crypto traders approach this market with structure, patience, and a well-defined strategy, treating trading as a business rather than a gamble.
Understanding the Crypto Market Structure
To trade crypto like a pro, the first step is understanding how the market works. Cryptocurrencies trade on centralized exchanges (like Binance, Coinbase, or OKX) and decentralized exchanges (DEXs). Prices are driven by supply and demand, liquidity, market sentiment, macroeconomic trends, regulations, and technological developments. Unlike traditional markets, crypto has no closing bell, which means price movements can happen anytime. Professionals account for this by using alerts, stop-losses, and predefined trading plans instead of constantly watching charts.
Market cycles are another critical concept. Crypto moves through accumulation, markup (bull phase), distribution, and markdown (bear phase). Professional traders focus on identifying which phase the market is currently in and align their strategies accordingly. They do not fight the trend; instead, they trade with it.
Choosing the Right Trading Style
Professional traders clearly define their trading style. Some focus on scalping, making small profits from quick trades. Others prefer day trading, closing all positions within a day. Swing traders hold positions for days or weeks, capturing medium-term trends, while position traders ride long-term market moves. There is no “best” style—only what suits your capital, time availability, and emotional tolerance.
Pros avoid overtrading. They understand that fewer high-quality trades often outperform frequent impulsive trades. Patience is considered a skill, not a weakness.
Technical Analysis: The Trader’s Core Skill
Technical analysis is the backbone of professional crypto trading. It involves studying price charts, trends, support and resistance levels, volume, and indicators. Pro traders focus more on price action than on cluttering charts with too many indicators. Key tools include moving averages, RSI, MACD, Fibonacci levels, and volume profile.
Support and resistance zones are especially important in crypto due to its volatility. Professionals wait for confirmation near these levels instead of chasing breakouts blindly. They also understand false breakouts and fake pumps, which are common in crypto markets due to low liquidity in some altcoins.
Fundamental and Narrative Analysis
While technicals help with entries and exits, fundamentals provide context. Professional traders track blockchain upgrades, tokenomics, developer activity, institutional adoption, regulatory news, and macro factors like interest rates and global liquidity. Narratives such as DeFi, AI tokens, Layer-2 scaling, or Web3 gaming often drive sector-wide rallies.
Pros do not marry narratives blindly. They use them to filter opportunities and time trades, not to justify holding losing positions. When the narrative changes, they adapt quickly.
Risk Management: The Pro’s Biggest Edge
What truly separates professionals from amateurs is risk management. Pro traders never risk a large portion of their capital on a single trade. They define risk before entering a trade, typically risking only 1–2% of total capital per trade. Stop-losses are non-negotiable.
Position sizing is calculated, not guessed. Even with high-confidence setups, professionals accept that losses are part of the game. Survival comes first; profits come second. They aim for favorable risk-to-reward ratios, often targeting at least 1:2 or 1:3.
Psychology and Emotional Control
Crypto markets are emotional battlegrounds. Fear, greed, FOMO, and panic selling destroy more accounts than bad strategies. Professional traders build emotional discipline by following rules, journaling trades, and reviewing mistakes objectively.
They do not revenge trade after losses or become overconfident after wins. Every trade is treated as one of many in a long series. Consistency matters more than excitement.
Using Leverage Wisely (or Avoiding It)
Leverage can amplify profits, but it can destroy accounts just as fast. Professional traders either avoid high leverage or use it very conservatively. They understand liquidation mechanics and never rely on leverage to compensate for poor setups.
Many pros focus on spot trading during uncertain market conditions and use derivatives only when volatility, liquidity, and trend clarity align.
Building a Professional Trading Routine
Professional trading is systematic. It includes pre-market analysis, setting alerts, planning trades in advance, executing with discipline, and post-trade reviews. Journaling trades helps identify patterns, strengths, and recurring mistakes.
Pros continuously refine their strategies based on data, not emotions. They backtest ideas, forward test with small capital, and scale only after consistent performance.
Security, Tools, and Long-Term Growth
Security is a professional priority. Using hardware wallets, two-factor authentication, and avoiding suspicious links is essential. Tools like charting platforms, on-chain analytics, and news aggregators help professionals stay informed without noise.
Finally, professional crypto traders invest in education. Markets evolve, strategies stop working, and new instruments emerge. Adaptability is the ultimate edge.
Conclusion
Trading crypto like a pro is not about predicting every move or getting rich overnight. It is about process, discipline, risk control, and continuous improvement. Professionals respect the market, manage risk relentlessly, and stay emotionally neutral. By approaching crypto trading as a serious business and committing to skill development, patience, and structure, traders can steadily move from amateur behavior to professional-level performance in one of the most dynamic markets in the world.

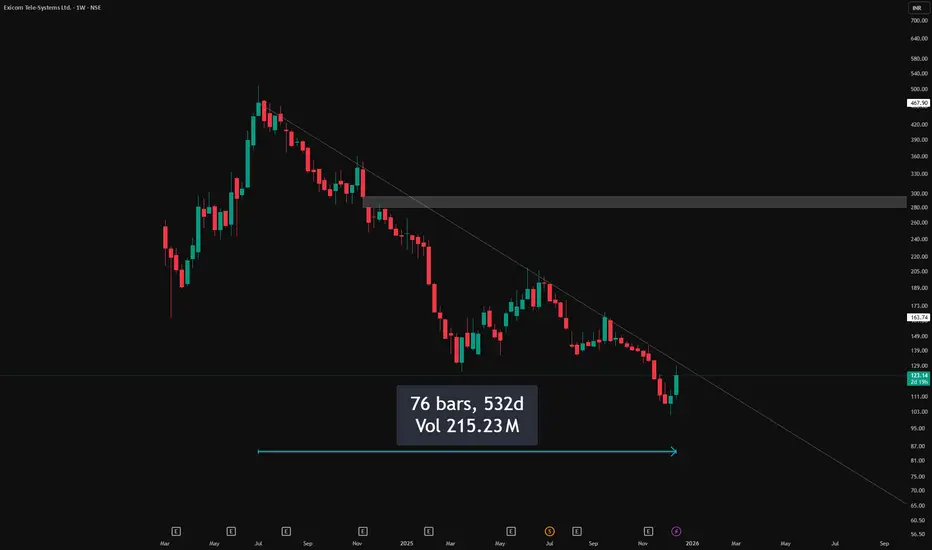
Clean Trendline Respect on Weekly Chart – 500 DaysPattern Context
Price has been respecting a well-defined descending trendline on the weekly timeframe, with each rally stalling below the previous swing high and reinforcing the broader lower‑high, lower‑low sequence.
Candlestick Behavior
Showing how supply continues to respond at the same diagonal zone. This reaction visually confirms how aggressively the market has been defending the pattern’s upper boundary without implying what comes next, keeping the focus strictly on how price has behaved historically around this line.
Observational Takeaway
This chart serves as a clear example of how a simple, clean trendline can organize price behavior over multiple months and frame where participation repeatedly shifts. The emphasis here is on observing how consistently the structure has been respected and how each touch has shaped the ongoing sequence, allowing traders to study price interaction with a dominant trend rather than anticipate future outcomes.
Disclaimer
This post is for educational and informational purposes only and is not investment advice, stock tips, or a recommendation to buy or sell any security. Readers should do their own research, consider their personal risk tolerance, and consult a registered financial professional if needed before making any trading or investment decisions.
Candle Patterns The Power of Context: Where Patterns Truly Work
Patterns are not standalone signals. Their effectiveness depends on context:
Trend Direction: Patterns aligned with the higher-timeframe trend have higher probability.
Support and Resistance: Patterns near key levels carry more weight.
Volume: Breakouts with volume confirm participation.
Market Structure: Higher highs and higher lows validate bullish patterns; lower highs and lower lows validate bearish ones.
A bullish engulfing in the middle of nowhere is noise. The same pattern at a weekly support level is opportunity.

Part 3 Learn Institutional Trading Spread Strategies (Risk-Defined Trades)
Spread strategies reduce risk by combining buy and sell options.
Bull Call Spread
Concept: Buy lower strike call + Sell higher strike call.
Profit: Limited
Risk: Limited
Best Market Condition: Moderate uptrend
Benefit:
Lower cost than buying a naked call.

Part 2 Ride The Big Moves Iron Condor Strategy
Concept: Combination of bull put spread + bear call spread.
Profit: Limited
Risk: Limited
Best Market Condition: Range-bound market
Use Case:
Preferred by professional traders due to defined risk.

Part 2 Intraday Trading Master ClassNon-Directional (Range-Bound) Strategies
These strategies profit when the market does not move much.
Short Straddle Strategy
Concept: Sell Call + Sell Put at same strike.
Profit: Premium received
Risk: Unlimited
Best Market Condition: Low volatility, sideways market
Use Case:
When expecting very low movement, typically before event expiry.
Warning:
High-risk strategy, requires strict risk management.

Part 1 Intraday Trading Master Class Covered Call Strategy (Moderately Bullish)
Concept: Hold shares and sell a call option.
Profit: Limited
Risk: Stock downside risk remains
Best Market Condition: Mild uptrend or sideways
Use Case:
Ideal for long-term investors to earn regular income.

Positional Trading vs. Swing Trading in the Indian MarketUnderstanding Positional Trading
Positional trading is a medium- to long-term trading style where traders hold positions for several weeks to a few months. The goal is to benefit from a larger directional move driven by strong trends, fundamental changes, or long-term technical breakouts.
In the Indian market, positional traders often focus on:
Strong sectoral themes (banking, IT, pharma, PSU, metals)
Macroeconomic trends (interest rates, inflation, GDP growth)
Company fundamentals (earnings growth, balance sheet strength)
Long-term technical structures on weekly or monthly charts
For example, a positional trader may buy a banking stock when interest rate cuts are expected and hold it for three to six months as the sector re-rates.
Key Characteristics of Positional Trading:
Holding period: Weeks to months
Charts used: Daily, weekly, monthly
Trade frequency: Low
Stop loss: Wider
Target size: Large
Stress level: Comparatively low
Positional traders are less affected by daily market noise. Short-term volatility caused by global cues or intraday news does not usually force them out of trades unless the broader trend changes.
Understanding Swing Trading
Swing trading is a short- to medium-term strategy where traders aim to capture price swings within a trend. Positions are usually held from a few days to a few weeks. Swing traders actively trade market fluctuations and are more sensitive to technical signals.
In the Indian market, swing trading is extremely popular because:
Volatility is high, especially in mid-cap and small-cap stocks
Weekly option expiry cycles create frequent momentum
Retail participation leads to sharp price swings
Technical patterns work well on short time frames
Swing traders typically rely on:
Support and resistance levels
Chart patterns (flags, triangles, double tops/bottoms)
Indicators like RSI, MACD, moving averages
Volume and price action
For instance, a swing trader may buy a stock near a strong support level after a pullback and exit within 5–10 days once resistance is reached.
Key Characteristics of Swing Trading:
Holding period: 2 days to 2–3 weeks
Charts used: Hourly, 4-hour, daily
Trade frequency: Moderate to high
Stop loss: Tight
Target size: Moderate
Stress level: Higher than positional trading
Swing trading requires regular monitoring of positions and quick decision-making.
Time Commitment and Lifestyle Differences
One of the biggest differences between positional and swing trading in India is time involvement.
Positional trading is suitable for working professionals, business owners, or investors who cannot watch markets daily. Once a trade is planned, only periodic review is required.
Swing trading demands more screen time. Traders must track price movements, adjust stop losses, and respond to market changes, especially around events like RBI policy announcements or global market moves.
If you can spend only limited time on markets, positional trading is often more practical.
Risk Management and Capital Requirements
Risk management plays a crucial role in both styles, but it is applied differently.
Positional Trading Risk Profile:
Wider stop losses due to long-term volatility
Lower position size per trade
Fewer trades reduce transaction costs
Overnight and weekend gap risk exists
Swing Trading Risk Profile:
Tighter stop losses
Higher position turnover
More brokerage and taxes due to frequent trading
Lower gap risk due to shorter holding period
In the Indian context, where sudden news (budget announcements, election results, global market shocks) can cause gaps, positional traders must be mentally prepared for drawdowns.
Role of Fundamentals vs. Technicals
Positional traders give higher importance to fundamentals combined with technicals. They often enter trades only when both align.
Swing traders rely primarily on technical analysis. Fundamentals are secondary and mainly used to avoid weak stocks.
For example, a swing trader may trade a technically strong stock even if long-term fundamentals are average, whereas a positional trader may avoid it.
Impact of Indian Market Structure
The Indian market has some unique features that influence both styles:
Weekly and monthly F&O expiry increases short-term volatility (benefits swing traders)
High retail participation leads to emotional price swings
Sector rotation is frequent, creating positional opportunities
Global dependency (US markets, crude oil, dollar index) affects both styles differently
Swing traders often benefit from expiry-related momentum, while positional traders benefit from broader economic and sectoral trends.
Psychology and Discipline
Psychology is where many traders fail.
Positional trading psychology requires patience, conviction, and the ability to sit through temporary drawdowns.
Swing trading psychology demands quick execution, emotional control, and acceptance of frequent small losses.
In India, where social media tips and news-driven trading are common, swing traders are more prone to overtrading, while positional traders risk holding losing positions for too long.
Which Is Better for Indian Traders?
There is no universally “better” approach. The choice depends on:
Your time availability
Risk tolerance
Capital size
Personality and patience level
Market experience
Positional trading is better if you:
Prefer low-frequency trades
Have limited screen time
Believe in macro and sectoral trends
Can handle longer drawdowns
Swing trading is better if you:
Can actively monitor markets
Enjoy technical analysis
Prefer faster results
Are comfortable with frequent decision-making
Many successful Indian traders use a hybrid approach, combining positional trades in strong sectors with swing trades for short-term opportunities.
Conclusion
In the Indian market, both positional trading and swing trading offer excellent opportunities when applied correctly. Positional trading focuses on capturing big trends with patience and discipline, while swing trading aims to profit from short-term price movements with active involvement. Understanding your personality, market conditions, and risk management skills is more important than choosing one style over the other. Ultimately, consistency, discipline, and continuous learning determine success—regardless of whether you are a positional trader or a swing trader.
Option Trading Strategies Directional Option Trading Strategies
Directional strategies are used when the trader has a clear bullish or bearish view on the underlying asset.
Long Call Strategy (Bullish)
Concept: Buy a call option expecting the price to rise.
Maximum Loss: Premium paid
Maximum Profit: Unlimited
Best Market Condition: Strong uptrend
Use Case:
When you expect sharp upside movement with high momentum.
Risk:
If price does not move fast enough, time decay erodes option value.

Narrative-Driven MarketsHow Stories Move Prices More Than Numbers
Financial markets are often described as rational systems where prices reflect hard data such as earnings, interest rates, cash flows, and economic indicators. Yet, anyone who has observed markets closely knows that prices frequently move far ahead of fundamentals—or even in the opposite direction. This apparent contradiction is best explained by the concept of the narrative-driven market, where stories, beliefs, and collective imagination shape market behavior more powerfully than spreadsheets and models.
A narrative-driven market is one in which stories dominate decision-making. These stories can be about growth, disruption, fear, recovery, nationalism, technology, or even survival. Investors, traders, media, analysts, and policymakers all contribute to building and spreading these narratives. Once a narrative gains momentum, it influences expectations, risk appetite, capital flows, and ultimately prices.
The Power of Stories in Financial Markets
Human beings are natural storytellers. We understand the world not just through data, but through meaning. Markets are no exception. A balance sheet tells us what is, but a narrative tells us what could be. Investors do not buy stocks for past earnings; they buy them for future possibilities. Narratives fill the gap between uncertainty and action.
For example, the narrative of “a fast-growing digital economy” can lift valuations of technology companies even when profits are weak. Similarly, a narrative of “economic slowdown” can crush fundamentally strong stocks because fear overrides logic. In both cases, the story becomes stronger than the numbers.
How Narratives Are Born
Market narratives usually emerge from a combination of events and interpretation. A new technology, a policy change, a geopolitical conflict, a pandemic, or a central bank decision can act as the spark. Media headlines, expert opinions, social media discussions, and institutional reports then shape how that event is understood.
Over time, repetition reinforces belief. The more a narrative is discussed, the more credible it appears. Eventually, it becomes the “accepted truth” of the market—even if the underlying facts are still uncertain.
For instance, during periods of global liquidity, the narrative often becomes “buy every dip because central banks will support markets.” This belief itself encourages buying, making the narrative self-fulfilling.
Narratives and Market Cycles
Narratives evolve with market cycles.
Early cycle: Narratives are quiet and skeptical. Only a few believe in the new story.
Expansion phase: The narrative gains traction. Data starts supporting it, and prices rise steadily.
Euphoria: The narrative becomes extreme. Valuations are justified with phrases like “this time is different.” Risks are ignored.
Breakdown: Reality challenges the story. A trigger event causes doubt.
Collapse: The narrative reverses. Fear replaces optimism, often overshooting on the downside.
Understanding where a narrative sits in this cycle helps traders and investors avoid emotional decisions and crowd behavior.
Media and Social Amplification
In modern markets, narratives spread faster than ever. Financial news channels, Twitter (X), YouTube, Telegram, and WhatsApp groups amplify stories instantly. Algorithms prioritize emotional and sensational content, which often strengthens extreme narratives—both bullish and bearish.
Retail participation has further intensified narrative-driven moves. Coordinated belief, even without strong fundamentals, can drive sharp rallies or crashes. Price action then becomes the “proof” that the narrative is correct, attracting even more participants.
Fundamentals vs Narratives
It is important to note that narratives do not permanently replace fundamentals. In the long run, cash flows, profitability, and economic reality matter. However, in the short to medium term, narratives can stretch valuations far beyond fair value.
Successful market participants understand this balance. They do not dismiss fundamentals, but they also do not underestimate the power of belief. A fundamentally cheap stock can remain cheap if the narrative is negative. A fundamentally expensive stock can keep rising if the narrative remains strong.
Narratives in Different Asset Classes
Narrative-driven behavior is not limited to equities.
Commodities react strongly to stories of shortages, wars, or super cycles.
Currencies move on narratives of economic strength, capital flows, and political stability.
Crypto markets are almost entirely narrative-based, driven by adoption stories, regulation fears, and technological promises.
Bond markets respond to narratives around inflation, growth, and central bank credibility.
Each asset class has its own dominant storytellers and belief systems.
Trading and Investing in Narrative-Driven Markets
To operate effectively in narrative-driven markets, one must shift mindset. Instead of asking only “Is this cheap or expensive?”, a better question is “What story is the market currently believing?”
Key skills include:
Listening to dominant themes across media and market commentary
Observing price reaction to news rather than the news itself
Identifying when a narrative is strengthening or weakening
Recognizing emotional extremes such as greed and panic
Traders often benefit by aligning with strong narratives but exiting when signs of saturation appear. Long-term investors may wait for narrative collapse to accumulate quality assets at discounted prices.
The Risk of Blind Storytelling
While narratives create opportunity, they also create danger. Blind faith in a story can lead to bubbles and heavy losses. When narratives disconnect completely from reality, even small disappointments can cause violent reversals.
Discipline, risk management, and independent thinking are essential. The goal is not to reject narratives, but to use them consciously rather than emotionally.
Conclusion
A narrative-driven market reflects the deeply human nature of finance. Markets are not just mechanisms of capital allocation; they are arenas of belief, hope, fear, and imagination. Prices move not only on what is known, but on what is believed.
Those who understand narratives gain a powerful edge. They see markets not just as charts and ratios, but as evolving stories. By learning to read, question, and anticipate these stories, traders and investors can navigate volatility with greater clarity, confidence, and control.

Stories Shape the TradeMarkets move on belief before they move on numbers.
Behind every price movement is a story shaping how traders think, feel, and act. Below is a clear, point-wise and impressive explanation of how stories shape the trade in financial markets.
1. Markets Are Built on Human Psychology
Traders are humans, not machines.
Humans understand the world through stories, not raw data.
Prices reflect collective emotions—hope, fear, greed, and doubt.
2. Data Creates Facts, Stories Create Direction
Economic data shows what happened.
Stories explain what it means for the future.
Trades are placed based on expectations, not history.
3. Every Trend Has a Dominant Story
Bull markets thrive on stories of growth, innovation, and opportunity.
Bear markets feed on narratives of risk, slowdown, and collapse.
As long as the story survives, the trend continues.
4. News Is Powerful Because It Builds Narratives
A single headline can change market mood instantly.
The same news can be bullish or bearish depending on the story behind it.
Markets react more to interpretation than information.
5. Stocks Are Valued on Future Stories
Price is not just about current earnings.
Markets buy future potential wrapped in a compelling narrative.
Strong stories attract capital even before profits arrive.
6. Technical Levels Work Because Traders Believe Them
Support and resistance are psychological zones.
Breakouts succeed when the story says “momentum is strong.”
Charts work because belief becomes action.
7. Sentiment Moves Faster Than Fundamentals
Stories spread faster than financial reports.
Social media accelerates narrative-driven trades.
Price often moves first; fundamentals follow later.
8. Institutions Trade Stories at Scale
Big money positions itself before narratives go mainstream.
Retail traders usually enter once the story becomes popular.
Early story recognition creates the biggest profits.
9. Fake Stories Create Traps
Not all stories are true or sustainable.
Overhyped narratives lead to bubbles and sharp reversals.
Smart traders watch price confirmation, not just excitement.
10. Price Reveals Whether the Story Is Working
Strong story + weak price = warning sign.
Bad news + strong price = hidden strength.
Price action exposes belief strength.
11. Market Cycles Are Story Cycles
Accumulation: “No one cares”
Expansion: “This is the future”
Distribution: “It can’t fall”
Collapse: “It was obvious”
12. Successful Traders Trade Story Shifts
The biggest moves happen when the story changes.
Fear turning into confidence creates rallies.
Confidence turning into doubt creates crashes.
13. Emotional Control Beats Story Addiction
Traders lose when they fall in love with narratives.
Professionals stay flexible as stories evolve.
Adaptation is more powerful than conviction.
14. Stories Explain Volatility
Sudden moves happen when stories clash.
Markets reprice instantly when belief changes.
Volatility is the sound of narratives breaking.
15. Master the Story, But Follow the Price
Stories guide understanding.
Price decides truth.
Profitable trading lives at the intersection of both.
🔑 Final Insight
Markets don’t trade facts—they trade beliefs.
Those who understand stories early shape profits.
Those who ignore them chase prices.

Trading Breakouts and Fakeouts How to Identify Real Opportunities and Avoid Traps
Trading breakouts and fakeouts is one of the most popular yet challenging approaches in the financial markets. Traders across equities, commodities, forex, and derivatives closely watch key price levels where the market is expected to make a decisive move. While breakouts can lead to strong, profitable trends, fakeouts often result in losses and emotional frustration. Understanding the difference between the two, and learning how to trade them systematically, is critical for long-term trading success.
What Is a Breakout in Trading?
A breakout occurs when the price of an asset moves decisively above a resistance level or below a support level with increased momentum. These levels are usually formed by prior highs, lows, consolidation ranges, trendlines, or chart patterns such as triangles, rectangles, and head-and-shoulders formations.
Breakouts signal a potential shift in market sentiment. When resistance is broken, it suggests buyers have overpowered sellers. When support breaks, it indicates sellers have gained control. Traders aim to enter positions early in these moves to benefit from the expansion in volatility and price.
Why Breakouts Work
Breakouts work because markets tend to alternate between consolidation and expansion. During consolidation, price moves in a narrow range as buyers and sellers reach temporary balance. Once this balance breaks, price often moves rapidly as:
Stop-loss orders get triggered
New traders enter positions
Institutional traders increase exposure
This chain reaction creates momentum, which can lead to sustained trends.
Common Breakout Strategies
One of the simplest breakout strategies involves identifying a clear support or resistance level and entering a trade once price closes beyond that level. Traders often use:
Horizontal support and resistance
Chart patterns (flags, triangles, ranges)
Highs and lows of previous sessions
Volatility-based levels
Stops are usually placed just inside the broken range, while targets can be based on pattern projection, risk–reward ratios, or trailing stops.
The Role of Volume in Breakouts
Volume is a key confirmation tool in breakout trading. A genuine breakout is usually accompanied by higher-than-average volume, showing strong participation from market players. Low-volume breakouts are more likely to fail, as they indicate a lack of conviction.
In derivatives or futures markets, open interest combined with volume can further validate whether new positions are being built or existing ones are being closed.
What Is a Fakeout?
A fakeout occurs when price briefly breaks above resistance or below support but fails to sustain the move and quickly reverses back into the previous range. Fakeouts are common, especially in sideways or low-volatility markets.
These moves are often driven by:
Stop-loss hunting
False news reactions
Low liquidity periods
Retail trader overreaction
Fakeouts trap breakout traders and reward traders who take the opposite side at the right time.
Why Fakeouts Happen So Often
Markets are designed to find liquidity. Obvious support and resistance levels attract a large number of stop-loss and entry orders. Smart money or institutional players may push price beyond these levels to trigger orders, only to reverse the move once liquidity is absorbed.
Fakeouts are more frequent:
In choppy or range-bound markets
Near major economic announcements
During low-volume sessions
When levels are too obvious
How to Identify a Real Breakout vs a Fakeout
Distinguishing between a breakout and a fakeout requires combining multiple factors rather than relying on a single signal.
Key factors to analyze include:
Candle close: Strong breakouts usually close decisively beyond the level, not just wick through it
Volume confirmation: Higher volume supports breakout validity
Retest behavior: Real breakouts often retest the broken level and hold
Market context: Breakouts in trending markets have higher success rates
Time spent near the level: Strong bases lead to stronger breakouts
Trading Fakeouts as a Strategy
Instead of avoiding fakeouts, some traders specialize in trading them. Fakeout trading involves entering in the opposite direction once price fails to hold beyond a key level.
For example:
Price breaks above resistance
Fails to hold and closes back below
Seller enters short with stop above the fake breakout high
This strategy works best in range-bound markets and requires patience and strict risk control.
Risk Management in Breakout and Fakeout Trading
Risk management is crucial because not all breakouts will succeed. Traders should:
Risk only a small percentage of capital per trade
Use predefined stop-loss levels
Avoid overtrading multiple breakouts at once
Maintain a favorable risk–reward ratio (at least 1:2)
Without proper risk management, even a high win-rate strategy can result in losses.
Psychology Behind Breakouts and Fakeouts
Breakout trading tests trader psychology. Fear of missing out (FOMO) often pushes traders to enter too early, while fear of loss causes premature exits. Fakeouts exploit emotional decision-making, especially among inexperienced traders.
Successful traders remain disciplined, wait for confirmation, and accept that losses are part of the process. Emotional neutrality and consistency are more important than predicting every move correctly.
Best Timeframes for Breakout Trading
Breakouts occur on all timeframes, but their reliability varies. Higher timeframes (daily, weekly) tend to produce more reliable breakouts due to institutional participation. Lower timeframes (5-minute, 15-minute) have more noise and fakeouts but offer more frequent opportunities.
Traders should align breakout strategies with their trading style—scalping, day trading, or swing trading.
Breakouts in Different Markets
Stocks: Earnings, news, and sector momentum often drive breakouts
Forex: Breakouts frequently occur around sessions opens and macro news
Commodities: Supply-demand imbalances and global events fuel strong moves
Options: Breakouts often lead to volatility expansion, benefiting option buyers
Understanding market-specific behavior improves breakout accuracy.
Conclusion
Trading breakouts and fakeouts is both an art and a science. Breakouts offer the potential for strong trends and high rewards, while fakeouts serve as reminders that markets are unpredictable and often deceptive. The key to success lies in confirmation, context, and discipline.
By combining price action, volume analysis, market structure, and solid risk management, traders can improve their ability to identify genuine breakouts and avoid common traps. Rather than trying to be right every time, successful traders focus on consistency, probability, and long-term growth.

Option Trading Strategies for Smart Market Participation1. What Are Option Trading Strategies?
Option trading strategies are planned combinations of call and put options.
They are designed to control risk, reduce cost, and improve probability.
Each strategy matches a specific market condition—bullish, bearish, neutral, or volatile.
The goal is not prediction, but risk-adjusted profitability.
2. Core Building Blocks of Options
Call Option: Profits when price moves upward.
Put Option: Profits when price moves downward.
Strike Price: Pre-decided buy/sell price.
Expiry Date: Time limit for the option.
Premium: Cost paid or received for the option.
3. Bullish Option Strategies (Rising Market)
Long Call
Buy a call option when expecting strong upside.
Risk is limited to premium; profit potential is unlimited.
Bull Call Spread
Buy lower strike call, sell higher strike call.
Lower cost and controlled risk with limited profit.
Cash-Secured Put
Sell put to earn premium while planning to buy stock at lower price.
4. Bearish Option Strategies (Falling Market)
Long Put
Buy put when expecting sharp downside.
Limited risk with high profit potential.
Bear Put Spread
Buy higher strike put, sell lower strike put.
Ideal for moderate downtrend with reduced cost.
Call Credit Spread
Sell call spread to benefit from falling or stagnant prices.
5. Sideways Market Strategies (Range-Bound Market)
Covered Call
Hold stock and sell call for regular income.
Iron Condor
Sell out-of-the-money call and put spreads.
Profits from low volatility and time decay.
Short Strangle (Advanced)
Sell OTM call and put when market is stable.
6. Volatility-Based Strategies (Big Move Expected)
Long Straddle
Buy call and put at same strike.
Profits from strong movement in any direction.
Long Strangle
Buy OTM call and put; cheaper than straddle.
Calendar Spread
Profit from changes in volatility and time decay.
7. Option Selling Strategies (Time Decay Advantage)
Sellers benefit from Theta (time decay).
Credit Spreads offer limited risk with consistent income.
High probability strategies when market remains stable.
Requires strong risk management and margin control.
8. Role of Option Greeks in Strategies
Delta: Measures price sensitivity.
Theta: Measures time decay (favors sellers).
Vega: Measures volatility impact.
Gamma: Measures speed of Delta change.
Greeks help select, manage, and adjust strategies.
9. Risk Management in Option Trading
Always use defined-risk strategies.
Risk only 1–2% of capital per trade.
Avoid naked selling without protection.
Set predefined exit rules.
Adjust positions instead of panicking.
10. Capital Allocation & Position Sizing
Diversify across multiple strategies and expiries.
Avoid all-in trades.
Keep cash reserve for adjustments.
Focus on consistency, not jackpots.
11. Psychological Discipline in Options
Small frequent losses are normal.
Avoid revenge trading.
Follow strategy logic, not emotions.
Patience and discipline beat prediction skills.
12. Adapting Strategies to Market Conditions
High volatility → Prefer option selling after spike.
Low volatility → Buy options or calendar spreads.
Trending market → Directional spreads.
Sideways market → Income strategies.
13. Beginner vs Professional Approach
Beginners should start with spreads and hedged strategies.
Professionals focus on probability, risk-reward, and consistency.
Strategy selection matters more than market prediction.
14. Key Advantages of Option Trading Strategies
Limited and defined risk.
Profit in any market condition.
Lower capital requirement.
Multiple ways to adjust losing trades.
Income generation opportunity.
15. Final Conclusion
Option trading strategies are not about complexity—they are about structure, discipline, and probability. When used correctly, they allow traders to control risk, adapt to market behavior, and build consistent returns over time. Success in options comes from understanding strategy logic, respecting risk, and maintaining emotional discipline. Master these elements, and option trading becomes a powerful weapon in your trading journey.

Chumtrades XAUUSD Trading Plan NF todayMarket Psychology
Expect price to range sideways before a clear breakdown.
Market is waiting for NFP, smart money stays cautious → focus on range trading (4330–4280).
🔴 Resistance (Key Resistance)
4335 – 4340
4318 – 4322
Support (Key Support)
4260 → Short-term lower range
424X → Swing BUY zone
4204 → Deep pullback, strong swing BUY area
🎯 Trading Expectation
Before news:
Trade the range
Sell high – Buy low
Avoid FOMO in the middle
After news / Breakdown:
Look for deep BUY entries
Focus on 424X – 4204

Chart Patterns 🔸 What Are Chart Patterns?
Chart patterns are formed by price movements over time. They represent market structure and help traders anticipate breakouts, breakdowns, or reversals.
🔹 Types of Chart Patterns
1️⃣ Reversal Chart Patterns
2️⃣ Continuation Chart Patterns
3️⃣ Neutral Chart Patterns
4️⃣ Bilateral Chart Patterns
🔹 Key Components of Chart Patterns
✔ Trendlines
✔ Support and resistance
✔ Volume confirmation
✔ Breakout strength

Part 1 Candle Stick patterns Option Trading in Indian Markets
In India, option trading is highly active in:
NIFTY
BANK NIFTY
FINNIFTY
Select stocks
Weekly expiries, high liquidity, and volatility make options attractive—but also challenging for beginners.

Part 1 Support and Resistance Put Option Explained
A Put Option gives the buyer the right to sell the underlying asset at a fixed price before or on expiry.
Example:
If NIFTY is trading at 22,000 and you buy a 21,800 Put Option, you expect the market to move down.
If NIFTY falls to 21,500 → You profit
If NIFTY stays above 21,800 → Option may expire worthless
Maximum loss = Premium paid
Profit potential = High but limited
Put options are used when traders are bearish or want to protect their portfolio from downside risk.

Derivatives Trading SecretsMastering Leverage, Risk, and Market Psychology
Derivatives trading is often seen as a complex and high-risk area of financial markets, reserved only for professionals. However, when understood correctly, derivatives can become powerful tools for profit generation, risk management, and strategic positioning. The real “secrets” of derivatives trading are not hidden formulas or insider tricks, but a deep understanding of leverage, disciplined risk control, market structure, and trader psychology. This article раскрыts the core principles that successful traders consistently apply to gain an edge in derivatives markets.
Understanding the True Nature of Derivatives
Derivatives are financial contracts whose value is derived from an underlying asset such as stocks, indices, commodities, currencies, or cryptocurrencies. Common derivatives include futures, options, and swaps. The first secret of derivatives trading is recognizing that these instruments amplify both opportunity and risk. Because derivatives often require only a margin instead of full capital, traders gain leverage. This leverage magnifies profits, but it also magnifies losses with equal force.
Many beginners focus only on potential returns and overlook how quickly losses can accumulate. Successful traders, on the other hand, treat derivatives as precision instruments. They understand that derivatives are not investments in the traditional sense but tactical tools designed for specific objectives such as hedging, speculation, or arbitrage.
Leverage Is a Double-Edged Sword
One of the most important derivatives trading secrets is knowing how to use leverage responsibly. High leverage is attractive because it allows traders to control large positions with relatively small capital. However, excessive leverage is the primary reason most derivative traders fail.
Professional traders rarely use maximum leverage. Instead, they calculate position size based on acceptable risk per trade, usually limiting losses to a small percentage of total capital. They understand that survival comes first. In derivatives trading, staying in the game long enough is more important than chasing extraordinary gains in a single trade.
The secret lies in controlled leverage—using just enough to enhance returns while maintaining enough margin to withstand normal market volatility.
Risk Management Is the Real Edge
If there is one universal truth in derivatives trading, it is that risk management matters more than strategy. Many traders spend years searching for the perfect setup while ignoring basic risk principles. Successful traders think in probabilities, not certainties.
They define risk before entering a trade by setting stop-loss levels, understanding margin requirements, and planning exit strategies. They also account for gap risk, volatility spikes, and event-driven movements such as earnings, economic data, or policy announcements.
Another key secret is consistency. Instead of risking large amounts on a few trades, disciplined traders risk small, repeatable amounts over many trades. This approach allows the law of large numbers to work in their favor.
Volatility Is a Friend, Not an Enemy
In derivatives markets, volatility is not something to fear—it is something to understand. Futures and options traders, in particular, thrive on volatility. The secret is not predicting direction alone but understanding how volatility impacts pricing.
Options traders focus heavily on implied volatility, time decay, and volatility cycles. They know when to buy options during low volatility and when to sell or structure spreads during high volatility. Futures traders adjust position sizes based on volatility to avoid being shaken out by normal price swings.
Rather than avoiding volatile markets, experienced traders adapt their strategies to changing volatility conditions.
Market Structure and Liquidity Matter
Another often-overlooked secret is the importance of market structure. Liquidity, bid-ask spreads, open interest, and contract specifications play a major role in derivatives trading success. Highly liquid contracts such as index futures or major stock options offer tighter spreads and smoother execution, reducing trading costs.
Professionals prefer liquid markets because they allow quick entry and exit without significant slippage. They also pay attention to rollover dates in futures contracts and changes in open interest to gauge market sentiment and participation.
Understanding how institutions operate within derivatives markets provides insight into price behavior that retail traders often miss.
Timing Is More Important Than Prediction
Many traders believe success depends on predicting market direction accurately. In reality, timing and execution matter far more. Even a correct market view can result in losses if entries and exits are poorly timed.
Derivatives trading secrets include waiting for confirmation, trading with the trend, and aligning multiple time frames. Traders often enter positions when momentum aligns with broader market structure, rather than trying to catch tops and bottoms.
Patience is a hidden advantage. The ability to wait for high-probability setups separates professionals from impulsive traders.
Psychology Determines Long-Term Success
The most powerful secret in derivatives trading lies in the trader’s mindset. Fear, greed, overconfidence, and revenge trading are responsible for most losses. Because derivatives move quickly, emotional mistakes are amplified.
Successful traders develop emotional discipline. They accept losses as part of the business and do not attach ego to individual trades. They follow predefined rules even after a series of losses or wins.
Keeping a trading journal, reviewing mistakes, and focusing on process rather than outcome are common habits among consistently profitable derivatives traders.
Adaptability Is Essential
Markets evolve, and strategies that work today may fail tomorrow. Another critical secret is adaptability. Professional traders continuously monitor market conditions and adjust their strategies accordingly. They know when to be aggressive and when to step back.
They also understand that no single strategy works in all market environments. Trend-following strategies perform well in strong directional markets, while range-bound strategies work better during consolidation phases.
Flexibility and continuous learning keep traders aligned with the market rather than fighting it.
Conclusion
Derivatives trading secrets are not about shortcuts or guaranteed profits. They are about mastering leverage, respecting risk, understanding volatility, and maintaining psychological discipline. Derivatives offer immense potential, but only to those who approach them with preparation, patience, and professionalism.
By focusing on risk management, controlled leverage, market structure, and mindset, traders can transform derivatives from dangerous instruments into powerful tools. In the end, the true secret of derivatives trading is not predicting the market—but managing yourself within it.

Trading the Future of Financial MarketsUnderstanding Futures Contracts
A futures contract is a standardized agreement traded on an exchange. It specifies the underlying asset, quantity, quality, expiration date, and settlement method. Because contracts are standardized, they are highly liquid and transparent. Futures can be settled either by physical delivery (common in commodities like crude oil or agricultural products) or by cash settlement (common in index futures).
One of the defining features of futures trading is leverage. Traders are required to deposit only a fraction of the contract’s total value as margin. This enables participation with relatively lower capital, but it also amplifies both profits and losses. Therefore, futures trading demands a strong understanding of risk management.
Types of Futures Markets
Futures trading spans multiple asset classes:
Commodity Futures: Include agricultural products (wheat, rice, cotton), energy (crude oil, natural gas), and metals (gold, silver, copper).
Equity Index Futures: Such as NIFTY, BANK NIFTY, S&P 500, and Dow Jones futures, which track stock market indices.
Currency Futures: Allow trading in currency pairs like USD/INR or EUR/USD.
Interest Rate Futures: Based on bonds or treasury instruments, widely used by institutional participants.
Each market serves different participants, from farmers and manufacturers hedging price risks to traders seeking short-term opportunities.
Participants in Futures Trading
Futures markets attract a diverse set of participants:
Hedgers use futures to protect against adverse price movements. For example, a farmer may sell futures to lock in crop prices, while an airline may buy fuel futures to hedge fuel costs.
Speculators aim to profit from price fluctuations. They assume risk in exchange for potential returns and provide liquidity to the market.
Arbitrageurs exploit price differences between spot and futures markets or across exchanges to earn low-risk profits.
The interaction of these participants ensures efficient price discovery.
Advantages of Futures Trading
Futures trading offers several advantages:
Leverage allows traders to control large positions with limited capital.
Liquidity ensures easy entry and exit in popular contracts.
Two-way trading enables profit opportunities in both rising and falling markets.
Price discovery helps markets reflect future expectations of supply and demand.
Hedging efficiency provides businesses and investors with tools to manage uncertainty.
These benefits make futures trading attractive, but they also require discipline and knowledge.
Risks Involved in Futures Trading
Despite its advantages, futures trading carries significant risks:
High leverage risk can lead to substantial losses if the market moves against the position.
Margin calls require additional funds if losses exceed initial margins.
Market volatility can cause rapid price swings, especially around economic data or geopolitical events.
Overtrading and emotional decisions often result in poor outcomes for inexperienced traders.
Understanding these risks is essential before entering the futures market.
Futures Trading Strategies
Successful futures trading relies on well-defined strategies:
Trend following focuses on identifying and trading in the direction of prevailing market trends.
Range trading works in sideways markets by buying near support and selling near resistance.
Spread trading involves taking opposite positions in related contracts to reduce risk.
Hedging strategies aim to offset potential losses in spot positions.
Scalping and intraday trading seek small profits from short-term price movements.
Each strategy requires different time horizons, skills, and risk tolerance.
Role of Technical and Fundamental Analysis
Futures traders commonly use both technical and fundamental analysis. Technical analysis involves studying price charts, indicators, and patterns to predict future price movements. Fundamental analysis examines economic data, supply-demand dynamics, interest rates, inflation, and global events. Combining both approaches often leads to better decision-making.
Importance of Risk Management
Risk management is the backbone of futures trading success. This includes setting stop-loss levels, maintaining proper position sizing, avoiding excessive leverage, and diversifying trades. A disciplined trader focuses on capital preservation first, knowing that consistent profits come over time rather than from single trades.
Conclusion
Futures trading is a powerful financial tool that shapes global markets and offers opportunities for hedging and speculation. While it provides high liquidity, leverage, and flexibility, it also demands deep market understanding, emotional discipline, and strict risk control. For traders who invest time in learning market behavior, developing strategies, and managing risk effectively, futures trading can be a valuable component of a long-term trading or investment journey. However, beginners should approach it cautiously, gain experience gradually, and treat futures trading not as gambling, but as a structured and professional market activity.
