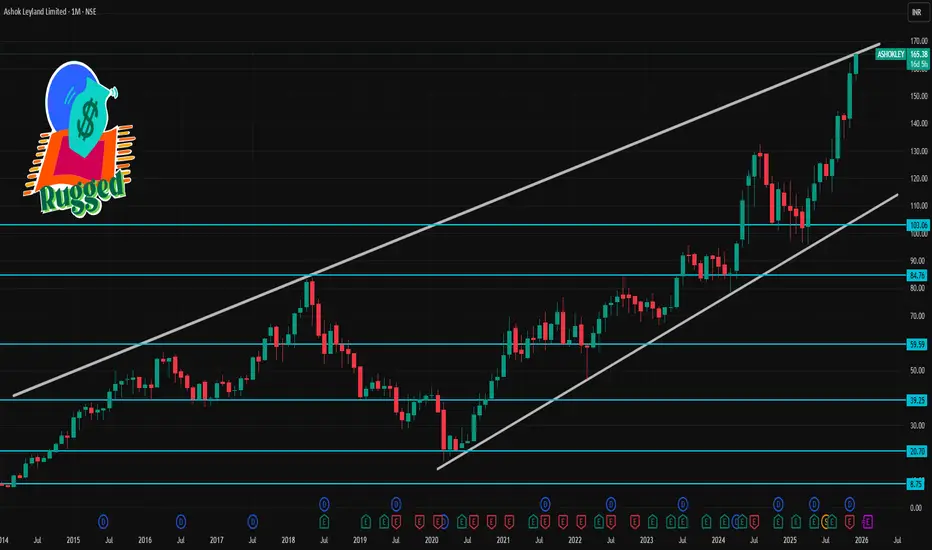
ASHOKLEY 1 Month Time Frame 📊 Current Price & Trend (as of latest market close)
Current trading level: ~₹163‑164 on NSE.
Price has rallied strongly and recently hit a 52‑week/all‑time high.
📈 1‑Month Key Levels (Short‑Term Technicals)
🔹 Immediate Resistance (Upside Targets)
R1 ~ ₹165‑167: Short‑term pivot resistance zone.
R2 ~ ₹167‑170: Key near‑term resistance above current.
R3 ~ ₹170‑176: Stronger upside area (if momentum continues).
🔻 Immediate Support (Downside Floors)
S1 ~ ₹161: Nearest short‑term support.
S2 ~ ₹158: Stronger support zone if price tests lower.
S3 ~ ₹156: Major initial support level before deeper pullback.
🧠 What This Means for 1‑Month Outlook
Bullish case (short term):
Holding above ₹158–161 supports continuation.
Clear break above ₹170–176 with strong volume could extend moves toward new highs.
Bearish/Neutral case:
Failure below ₹156–158 puts pressure on short‑term trend.
RSI nearing overbought suggests a possible pullback or consolidation first.
Trendlineanalysis
PARAGMILK 1 Week Time Frame 📌 Current Price (approx)
~₹315 – ₹320 on NSE (latest trading range)
📊 Weekly Time‑Frame Levels
🔹 Key Weekly Pivot & Levels
These are useful for the next few sessions (week):
Weekly Pivot Point (approx): ~₹318 – ₹320 (central reference for trend this week)
Weekly Support Levels:
S1: ~₹295 – ₹300
S2: ~₹283 – ₹288
S3: ~₹260 – ₹275 (deeper support if heavy pullback)
Weekly Resistance Levels:
R1: ~₹323 – ₹326
R2: ~₹331 – ₹335
R3: ~₹350 – ₹355 (secondary target zone)
(Pivot & weekly support/resistance based on aggregated pivot frameworks)
🔸 Short‑Term/Weekly Trading Zones
Bullish Scenario (uptrend holds):
✔ Stay above ₹320‑318 → next upside targets
→ ₹326‑₹331 (near‑term resistance)
→ ₹345‑₹350+ (medium‑term / breakout target)
Bearish Scenario (correction):
❌ Drop below ₹300‑295 → next support zone
→ ₹283‑₹288
→ ₹260‑₹275 (deeper demand zone)
📉 Simple Pivot Levels (Daily/Shorter)
Daily pivot range for context this week:
R1 ~₹311–₹315
R2 ~₹315–₹320
R3 ~₹320–₹325
S1 ~₹302–₹305
S2 ~₹297–₹300
S3 ~₹292–₹295
(Classic pivot ranges also align with weekly S1/S2)
📅 What to Watch This Week
🔹 Hold above ₹318–₹320: strengthens bullish outlook
🔹 Break below ₹295: possible deeper correction
🔹 Volume & daily closes: confirm breakout or reversal

Managing Trading Risk: Foundation of Long-Term Market SuccessUnderstanding Trading Risk
Trading risk refers to the possibility of losing capital due to unfavorable market movements, poor decisions, or unexpected events. Every trade carries risk, whether in stocks, derivatives, forex, or crypto markets. Market volatility, news events, economic data, and geopolitical factors can cause sudden price fluctuations. A trader’s goal is not to eliminate risk—because that is impossible—but to control and manage it effectively.
Risk management begins with accepting that losses are inevitable. Many beginners enter the market focusing only on profits, ignoring the downside. This mindset often leads to emotional trading, oversized positions, and account blow-ups. Professional traders, on the other hand, think first about how much they can lose before considering how much they can gain.
Capital Preservation Comes First
The primary objective of risk management is capital preservation. Without capital, there is no opportunity to trade. A trader who loses 50% of their account needs a 100% return just to break even. This mathematical reality highlights why controlling losses is more important than chasing big gains.
Successful traders usually risk only a small percentage of their total capital on a single trade, commonly between 1% and 2%. This approach ensures that even a series of losing trades does not significantly damage the trading account. Preserving capital provides the psychological confidence to continue trading rationally rather than emotionally.
Position Sizing and Risk Per Trade
Position sizing is one of the most powerful risk management tools. It determines how many shares, contracts, or lots to trade based on account size and risk tolerance. Proper position sizing aligns the potential loss of a trade with predefined risk limits.
For example, if a trader has a capital of ₹10,00,000 and decides to risk 1% per trade, the maximum loss allowed per trade is ₹10,000. Based on the stop-loss distance, the trader calculates the appropriate position size. This systematic approach removes guesswork and emotional bias from trading decisions.
Ignoring position sizing often leads to overtrading and excessive exposure. Even a high-probability setup can fail, and oversized positions can turn small mistakes into catastrophic losses.
The Role of Stop-Loss Orders
A stop-loss is a predefined price level at which a losing trade is exited automatically. It acts as a safety net, limiting losses and protecting capital. Using stop-loss orders is not a sign of weakness but a mark of discipline and professionalism.
Effective stop-loss placement is based on market structure, volatility, and technical levels rather than arbitrary values. Stops placed too tight may result in frequent premature exits, while stops placed too wide may expose the trader to unnecessary losses. A well-planned stop-loss balances risk control with market behavior.
More importantly, traders must respect their stop-losses. Moving or removing a stop-loss due to hope or fear often leads to larger losses. Discipline in executing stop-losses is essential for consistent performance.
Risk-to-Reward Ratio
The risk-to-reward ratio compares the potential loss of a trade to its potential profit. A favorable risk-to-reward ratio ensures that even if a trader is right only a portion of the time, they can still be profitable.
For instance, a 1:2 risk-to-reward ratio means risking ₹1 to make ₹2. With this ratio, a trader can be profitable even with a win rate below 50%. Focusing on high-quality setups with positive risk-to-reward characteristics helps traders avoid overtrading and low-probability opportunities.
However, risk-to-reward should not be viewed in isolation. It must align with the trader’s strategy, market conditions, and realistic profit targets.
Emotional and Psychological Risk Management
Risk management is not only technical but also psychological. Fear, greed, overconfidence, and revenge trading are major contributors to trading losses. Emotional decisions often lead to breaking rules, increasing position sizes impulsively, and holding losing trades for too long.
Developing a trading plan and strictly following it reduces emotional interference. A clear plan defines entry rules, exit rules, risk limits, and trade management guidelines. Journaling trades and reviewing mistakes also helps traders identify emotional patterns and improve discipline over time.
Maintaining realistic expectations is another key aspect of psychological risk management. Markets do not provide consistent profits every day. Accepting drawdowns as part of the process helps traders stay calm and focused.
Diversification and Exposure Control
Diversification reduces risk by spreading exposure across different instruments, sectors, or strategies. Relying heavily on a single stock, asset class, or market condition increases vulnerability to unexpected events.
However, diversification should be meaningful. Holding multiple positions that are highly correlated does not significantly reduce risk. Traders must monitor overall exposure, especially during volatile periods, to avoid excessive concentration.
Adapting Risk to Market Conditions
Market conditions are dynamic. Volatility levels, liquidity, and trend strength change over time. Effective risk management requires flexibility. During high-volatility periods, reducing position size or tightening risk limits can protect capital. In stable market environments, traders may cautiously increase exposure within predefined limits.
Ignoring changing conditions and applying the same risk approach blindly can lead to unnecessary losses. Adaptability is a hallmark of experienced traders.
Conclusion
Managing trading risk is the backbone of sustainable success in financial markets. It is not about avoiding losses but about controlling them intelligently. Through capital preservation, proper position sizing, disciplined stop-loss usage, favorable risk-to-reward ratios, emotional control, and adaptability, traders can survive market uncertainty and grow steadily over time.
In the long run, consistent risk management matters more than finding the perfect strategy. Markets reward discipline, patience, and respect for risk. Traders who master risk management build resilience, confidence, and the foundation for lasting profitability.

Quarterly Result Trading: Strategy, Opportunities, and RisksUnderstanding Quarterly Results
Quarterly results provide a snapshot of a company’s financial health and operational performance over the previous three months. The most closely watched parameters include:
Revenue (Sales): Indicates business growth and demand.
Net Profit: Reflects overall profitability after expenses.
Operating Margins: Show cost efficiency and pricing power.
Earnings Per Share (EPS): Used for valuation comparisons.
Guidance and Management Commentary: Signals future expectations.
Markets do not react only to absolute numbers; they react to how results compare with expectations. If results exceed expectations, the stock may rally. If they fall short, even slightly, the stock can decline sharply.
Why Quarterly Results Move Stock Prices
Stock prices are forward-looking. Investors and traders price stocks based on future growth prospects rather than past performance. Quarterly results help the market reassess these expectations. A strong result can lead to earnings upgrades, higher valuations, and increased institutional buying. Weak results may trigger downgrades, selling pressure, and loss of confidence.
Additionally, results often resolve uncertainty. Before announcements, traders speculate, leading to volatility. Once results are out, prices adjust quickly to new information.
Types of Quarterly Result Trading Strategies
Pre-Result Trading
Traders take positions before results based on expectations, rumors, sector trends, or analyst forecasts. This strategy aims to capture a price run-up ahead of the announcement. However, it is risky because unexpected numbers can reverse gains instantly.
Post-Result Trading
This involves trading after results are announced, once the market reaction becomes clearer. Traders analyze whether the reaction is justified or overdone. For example, if results are strong but the stock falls due to profit booking, it may present a buying opportunity.
Result Day Momentum Trading
On the day of results, stocks can move strongly in one direction with high volume. Momentum traders ride this move using intraday or short-term setups, relying on price action and volume rather than deep fundamentals.
Expectation vs Reality Trading
Sometimes even good results lead to a fall because expectations were too high. Skilled traders focus on the gap between expectations and actual numbers rather than the numbers alone.
Role of Derivatives in Quarterly Result Trading
Options and futures are widely used during result season due to high volatility.
Options Trading: Traders use strategies like straddles, strangles, and spreads to benefit from volatility without predicting direction.
Futures Trading: Directional traders take leveraged positions expecting a strong move.
However, implied volatility usually rises before results and collapses after the announcement, which can lead to option value erosion. Understanding volatility dynamics is crucial.
Importance of Volume and Price Action
During quarterly results, volume plays a critical role. A price move accompanied by high volume signals strong conviction from institutional players. Breakouts or breakdowns near key support and resistance levels often gain reliability during result-driven moves. Candlestick patterns formed after results can indicate continuation or reversal.
Sector and Market Context
Quarterly result trading should not be done in isolation. Broader market sentiment and sector performance matter. For example, even strong results from a company may not lead to a rally if the overall market is weak or the sector is under pressure. Conversely, average results may lead to a rally in a strong bull market.
Risks in Quarterly Result Trading
High Volatility: Prices can swing sharply within minutes, leading to slippage and losses.
Gap Openings: Stocks may open far above or below the previous close, limiting stop-loss effectiveness.
Emotional Trading: Fast price movements can trigger fear and greed, leading to impulsive decisions.
Information Asymmetry: Institutional investors may interpret results faster and more accurately than retail traders.
False Reactions: Initial market reactions can reverse once detailed analysis emerges.
Risk Management Techniques
Effective risk management is essential in quarterly result trading:
Use strict stop-losses and predefined position sizing.
Avoid over-leveraging, especially in derivatives.
Focus on liquid stocks to reduce slippage.
Trade fewer but high-quality setups rather than chasing every result.
Long-Term vs Short-Term Perspective
While quarterly result trading is mostly short-term, it can also help long-term investors. Consistently strong quarterly performance builds confidence in a company’s growth story. Traders who understand results deeply can transition into positional or swing trades based on improving fundamentals.
Conclusion
Quarterly result trading is one of the most exciting and challenging forms of market participation. It blends fundamentals, technical analysis, market psychology, and risk management. The biggest price moves often occur during result season, but so do the biggest mistakes. Successful traders focus not just on profits and losses, but on expectations, positioning, and disciplined execution. When approached with preparation and caution, quarterly result trading can become a powerful tool in a trader’s overall strategy—but without discipline, it can quickly turn into a high-risk gamble.

Chumtrades XAUUSD Trading PlanMarket Context
During Friday’s session, after the previous range breakout, the market saw strong profit-taking pressure from buyers.
Large capital exits triggered a sharp sell-off of ~96 prices, while the 426X base zone supported price very well.
Overall structure remains bullish.
👉 Session Expectation
Price is likely to move in a sideways range, with the upper–lower boundary around 423X – 428X (personal expectation).
🟢 Key Support Zones
• 4280 – 4282
• 4264 – 4266
• 4255 – 4257
• Deeper support: 424X
🔴 Key Resistance Zones
• 4330 – 4336
• 4347 – 4351 (±4353)
Good day, traders 🤝

Part 7 Trading Master ClassIntermediate Strategies
1. Bull Call Spread
Buying a call at a lower strike and selling another at a higher strike. This reduces cost but limits maximum profit.
2. Bear Put Spread
Buying a higher strike put and selling a lower strike put. It profits from moderate downside movement with controlled risk.
3. Straddle
Buying a call and a put at the same strike and expiry. This strategy profits from high volatility regardless of direction.
4. Strangle
Similar to a straddle but uses different strike prices, making it cheaper but requiring larger price movement.

Part 6 Institutional Trading Common Option Trading Strategies
a) Basic Strategies
1. Long Call
Used when a trader expects strong upside movement. Risk is limited to the premium paid, while reward potential is theoretically unlimited.
2. Long Put
Used when expecting a sharp decline. Risk is limited to the premium, and profits increase as the underlying falls.
3. Covered Call
Involves holding the underlying stock and selling a call option. It generates regular income but caps upside potential.
4. Protective Put
Buying a put option against an existing long position. This acts as insurance, limiting downside risk.

Part 4 institutional Trading Why Traders Use Options
Option trading serves multiple purposes:
Speculation: Leveraged bets on price direction.
Hedging: Protecting portfolios against adverse price movements.
Income Generation: Earning premiums through option selling.
Risk Management: Structuring trades with defined risk and reward.
Because options can be combined in various ways, traders can design strategies suited for bullish, bearish, or sideways markets.

Part 3 Institutional Trading Understanding Option Trading
An option is a derivative financial contract that gives the buyer the right, but not the obligation, to buy or sell an underlying asset (such as stocks, indices, commodities, or currencies) at a predetermined price (strike price) on or before a specific date (expiry date).
There are two main types of options:
Call Option: Gives the right to buy the underlying asset at the strike price.
Put Option: Gives the right to sell the underlying asset at the strike price.
The buyer pays a premium to the option seller (writer). This premium represents the maximum loss for the buyer and the maximum gain for the seller.
Key components of options include:
Underlying Asset
Strike Price
Expiry Date
Premium
Lot Size
Intrinsic Value and Time Value
Options derive their value from price movement, volatility, time decay, and interest rates, making them multi-dimensional instruments.

Retail Trading vs Institutional Trading1. Who Are Retail Traders?
Retail traders are individual participants who trade financial instruments such as stocks, commodities, forex, cryptocurrencies, or derivatives using their own capital. They usually trade through online brokerage platforms and operate independently.
Key Characteristics of Retail Trading
Capital Size: Small to medium. Most retail traders trade with limited funds compared to institutions.
Access to Markets: Via discount brokers, trading apps, and online platforms.
Decision Making: Personal judgment, often influenced by technical analysis, news, social media, and market sentiment.
Time Horizon: Ranges from intraday trading to long-term investing.
Technology: Basic charting tools, indicators, and retail-level analytics.
Retail trading has grown rapidly due to easy internet access, low brokerage fees, mobile trading apps, and financial education available through online platforms.
2. Who Are Institutional Traders?
Institutional traders are large organizations that trade on behalf of clients or for their own accounts. These include mutual funds, hedge funds, pension funds, insurance companies, banks, proprietary trading firms, and foreign institutional investors (FIIs).
Key Characteristics of Institutional Trading
Capital Size: Very large, often running into millions or billions.
Access to Markets: Direct market access (DMA), dark pools, and over-the-counter (OTC) markets.
Decision Making: Team-based, involving analysts, economists, risk managers, and traders.
Time Horizon: From high-frequency trading (milliseconds) to long-term investing (years).
Technology: Advanced algorithms, high-frequency trading systems, AI models, and proprietary data.
Institutions are the dominant force in most financial markets and are responsible for the majority of trading volume.
3. Capital and Position Size Differences
One of the most significant differences between retail and institutional trading is capital size.
Retail traders typically trade small quantities due to limited funds and higher risk exposure.
Institutional traders trade in large volumes, which can influence price movements, liquidity, and volatility.
Because of their size, institutions must be careful when entering or exiting positions. They often break large orders into smaller ones to avoid moving the market too aggressively, a process known as order slicing.
4. Information and Research Access
Retail Traders
Depend on publicly available information: news, earnings reports, charts, and social media.
Use standard indicators like RSI, MACD, moving averages, and candlestick patterns.
Often react to market news after it becomes public.
Institutional Traders
Have access to deep research, including industry reports, macroeconomic models, and company management interactions.
Employ dedicated research teams and sometimes alternative data such as satellite data, supply chain analysis, or consumer behavior data.
Can anticipate trends earlier due to superior information processing.
This information asymmetry gives institutions a strong edge over retail participants.
5. Trading Strategies and Styles
Retail Trading Strategies
Intraday trading
Swing trading
Positional trading
Options buying (calls and puts)
Momentum and breakout strategies
Retail traders often focus on short-term price movements and technical patterns. Emotional decision-making and overtrading are common challenges.
Institutional Trading Strategies
Long-term portfolio allocation
Arbitrage strategies
Statistical and quantitative trading
Market making
Hedging using derivatives
High-frequency trading (HFT)
Institutions focus heavily on risk-adjusted returns, diversification, and consistency rather than frequent speculative trades.
6. Risk Management Practices
Risk management is another major area of difference.
Retail traders often risk a large percentage of their capital on single trades, sometimes due to lack of discipline or experience.
Institutional traders follow strict risk management rules, including position limits, stop-loss frameworks, portfolio diversification, and regulatory compliance.
Institutions prioritize capital preservation, whereas many retail traders focus primarily on profit, sometimes ignoring downside risk.
7. Emotional vs Systematic Trading
Retail traders are more prone to:
Fear and greed
Revenge trading
Overconfidence after wins
Panic during drawdowns
Institutional trading is largely systematic and rule-based. Decisions are backed by models, committees, and predefined rules, reducing emotional bias.
This psychological discipline is a major reason institutions outperform most retail traders over the long term.
8. Market Impact and Liquidity
Retail traders usually have negligible market impact due to small trade sizes. Their trades rarely move prices significantly.
Institutional traders, on the other hand:
Create liquidity in some cases (market makers).
Cause sharp price movements when large orders hit the market.
Influence trends, breakouts, and major support-resistance levels.
Many price movements that retail traders react to are actually initiated by institutional activity.
9. Costs, Fees, and Execution
Retail traders:
Pay brokerage fees, taxes, and slippage.
Often experience slower execution and wider spreads.
Institutional traders:
Enjoy lower transaction costs due to high volumes.
Get better execution quality and tighter spreads.
Use smart order routing to minimize costs.
Lower costs significantly improve institutional profitability over time.
10. Regulatory Environment
Institutional traders operate under strict regulatory oversight, including reporting requirements, compliance audits, and risk disclosures.
Retail traders face fewer regulations but also have fewer protections in terms of information and execution advantages.
11. Why Retail Traders Often Lose
Studies across global markets show that a large percentage of retail traders lose money. Key reasons include:
Lack of education and realistic expectations
Poor risk management
Emotional trading
Overtrading
Competing against well-capitalized institutions
This does not mean retail traders cannot succeed, but success requires discipline, patience, and continuous learning.
12. How Retail Traders Can Compete Smarter
Retail traders can improve their chances by:
Following institutional footprints like volume, open interest, and price action
Focusing on risk management over profits
Trading fewer, high-quality setups
Avoiding excessive leverage
Aligning trades with higher-timeframe trends
Instead of fighting institutions, smart retail traders try to trade alongside institutional direction.
Conclusion
Retail trading and institutional trading operate in the same markets but under vastly different conditions. Retail traders bring flexibility, speed, and independence, while institutional traders dominate with capital, technology, research, and discipline. Markets are largely shaped by institutional behavior, and retail traders who understand this dynamic stand a better chance of survival and success.

Quantitative Trading: A Comprehensive Explanation1. Introduction to Quantitative Trading
Quantitative trading, often called quant trading, is a trading approach that uses mathematical models, statistical techniques, and computer algorithms to identify and execute trading opportunities in financial markets. Unlike discretionary trading, which relies on human judgment, experience, and intuition, quantitative trading is rule-based, data-driven, and systematic.
In quantitative trading, decisions such as when to buy, when to sell, how much to trade, and how to manage risk are determined by predefined formulas and models. These strategies are widely used by hedge funds, proprietary trading firms, investment banks, and increasingly by retail traders due to advances in technology and data availability.
2. Core Philosophy of Quantitative Trading
The foundation of quantitative trading rests on three key beliefs:
Markets exhibit patterns – Prices, volumes, volatility, and correlations often show recurring behaviors.
These patterns can be measured mathematically – Using statistics, probability, and machine learning.
Automation removes emotional bias – Algorithms execute trades without fear, greed, or hesitation.
The goal is not to predict the future with certainty but to identify probabilistic edges that perform well over a large number of trades.
3. Key Components of Quantitative Trading
a) Data Collection
Quantitative trading begins with data. Common data types include:
Historical price data (open, high, low, close)
Volume and liquidity data
Order book data
Volatility data
Fundamental data (earnings, ratios)
Alternative data (news sentiment, satellite data, social media)
High-quality, clean data is critical because poor data leads to flawed models.
b) Strategy Development
A quant strategy defines precise trading rules. Examples:
Buy when a stock’s 20-day moving average crosses above the 50-day average
Sell when volatility exceeds a certain threshold
Trade mean reversion when prices deviate statistically from historical averages
Strategies are expressed in mathematical or logical form, allowing computers to execute them automatically.
c) Backtesting
Backtesting involves testing a strategy on historical data to evaluate:
Profitability
Drawdowns
Win rate
Risk-adjusted returns (Sharpe ratio)
This step helps determine whether a strategy has a statistical edge or if its performance is random.
d) Risk Management
Risk control is central to quantitative trading. Techniques include:
Position sizing models
Stop-loss and take-profit rules
Portfolio diversification
Maximum drawdown limits
A strong risk framework ensures long-term survival, even during losing streaks.
e) Execution
Execution algorithms place trades efficiently by:
Reducing transaction costs
Minimizing market impact
Optimizing order timing
In high-frequency trading, execution speed measured in milliseconds or microseconds is crucial.
4. Types of Quantitative Trading Strategies
a) Trend-Following Strategies
These strategies aim to profit from sustained price movements.
Use indicators like moving averages, breakout levels, and momentum
Work well in trending markets
Struggle during sideways or choppy markets
Trend following is popular due to its simplicity and long-term robustness.
b) Mean Reversion Strategies
Mean reversion assumes prices eventually return to their historical average.
Buy oversold assets
Sell overbought assets
Based on statistical measures like z-scores and Bollinger Bands
These strategies perform well in range-bound markets.
c) Arbitrage Strategies
Arbitrage exploits price inefficiencies between related instruments.
Statistical arbitrage
Pair trading
Index arbitrage
Though theoretically low risk, arbitrage requires fast execution and large capital.
d) Market-Making Strategies
Market makers provide liquidity by placing buy and sell orders simultaneously.
Earn profits from bid-ask spreads
Heavily dependent on speed and inventory control
These strategies are common among high-frequency trading firms.
e) Machine Learning-Based Strategies
Advanced quant systems use:
Regression models
Decision trees
Neural networks
Reinforcement learning
Machine learning helps uncover non-linear relationships in large datasets, though it increases complexity and overfitting risk.
5. Role of Technology in Quantitative Trading
Technology is the backbone of quant trading. Key elements include:
Programming languages (Python, R, C++)
Databases for storing large datasets
Cloud computing and GPUs
Trading APIs and execution platforms
Automation enables:
24/7 monitoring
High-speed execution
Consistent rule enforcement
Without technology, quantitative trading is practically impossible.
6. Advantages of Quantitative Trading
Emotion-free trading – Eliminates fear and greed.
Consistency – Same rules applied every time.
Scalability – Strategies can be applied across multiple markets.
Backtesting capability – Performance can be tested before risking capital.
Speed and efficiency – Faster reaction to market changes.
These advantages make quantitative trading highly attractive to professional traders.
7. Limitations and Risks of Quantitative Trading
Despite its strengths, quant trading has challenges:
Overfitting – Models may perform well in the past but fail in live markets.
Regime changes – Market behavior changes over time.
Data snooping bias – Excessive testing increases false confidence.
Execution risk – Slippage and latency can reduce profits.
Black swan events – Extreme events may invalidate models.
Successful quant traders continuously adapt and update their strategies.
8. Quantitative Trading vs Discretionary Trading
Aspect Quantitative Trading Discretionary Trading
Decision Making Rule-based Human judgment
Emotion Minimal High
Speed Very fast Slower
Scalability High Limited
Flexibility Lower in real-time Higher
Many modern traders combine both approaches, known as hybrid trading.
9. Quantitative Trading in Modern Markets
Quantitative trading dominates global markets today. A significant portion of equity, futures, forex, and crypto trading volume is generated by algorithms. In India, quantitative strategies are increasingly used in:
Index futures
Options trading
Statistical arbitrage
Volatility strategies
Retail participation is also rising due to affordable data and computing power.
10. Conclusion
Quantitative trading represents the fusion of finance, mathematics, and technology. It transforms trading from an art into a structured scientific process based on probability and data analysis. While it does not eliminate risk, it provides a disciplined framework for identifying and exploiting market inefficiencies.
Success in quantitative trading requires strong analytical skills, robust risk management, continuous research, and the ability to adapt to changing market conditions. As financial markets evolve, quantitative trading will continue to grow in importance, shaping the future of global investing and trading.
Real Kowledge of Chart Pattern Key Principles for Chart Pattern Analysis
A. Trend Context
Patterns are more reliable when analyzed in the context of prevailing trends. For instance, reversal patterns in strong trends may fail without sufficient volume confirmation.
B. Volume Confirmation
Volume often provides confirmation for patterns:
Breakouts with high volume are more reliable.
Low volume breakouts can indicate false signals.
C. Time Frame
Patterns may appear differently across time frames. For example, a double top on a daily chart is more significant than one on a 5-minute chart due to higher trading participation and reduced noise.
D. Pattern Failure
Not all patterns result in expected outcomes. False breakouts or trend reversals can occur due to market news, unexpected events, or low liquidity. Risk management, stop-losses, and position sizing are crucial.

Best Knowledge Of Candle Patterns Single-Candle Patterns
1. Doji:
A Doji forms when the opening and closing prices are virtually identical, resulting in a very small body. It represents indecision in the market. There are variations, such as the Long-Legged Doji, indicating high volatility with indecision, and the Gravestone Doji, often signaling a bearish reversal after an uptrend.
2. Hammer:
A Hammer has a small body near the top of the trading range and a long lower shadow. It typically appears at the bottom of a downtrend and suggests a potential bullish reversal, as sellers pushed the price lower but buyers regained control.
3. Hanging Man:
Resembling the Hammer but occurring after an uptrend, the Hanging Man signals potential bearish reversal. The long lower shadow shows that sellers tried to push the price down, and the market may weaken.
4. Inverted Hammer:
This candle has a small body at the lower end with a long upper shadow, appearing after a downtrend. It indicates potential bullish reversal if followed by confirmation from subsequent candles.
5. Shooting Star:
Opposite of the Inverted Hammer, the Shooting Star appears at the top of an uptrend, signaling a potential bearish reversal. The long upper shadow shows buyers tried to push the price higher but failed.
6. Marubozu:
A Marubozu has no shadows, only a solid body. A bullish Marubozu opens at the low and closes at the high, signaling strong buying pressure. A bearish Marubozu opens at the high and closes at the low, showing strong selling pressure.

Part 2 Ride The Big Moves Risk Management in Option Trading
Successful option trading depends heavily on risk management:
Position sizing
Defined stop-loss
Avoid over-leveraging
Understand implied volatility
Trade liquid instruments
Never risk large capital on naked option selling without protection.

Part 1 Intraday Master Class Income-Generating Option Strategies
1. Covered Call Strategy
A covered call involves holding the underlying stock and selling a call option against it.
Market View: Mildly bullish or sideways
Risk: Stock downside risk remains
Reward: Limited to premium + price appreciation till strike
This strategy generates regular income and is widely used by long-term investors.
2. Cash-Secured Put Strategy
In this strategy, a trader sells a put option while keeping sufficient cash to buy the stock if assigned.
Market View: Neutral to bullish
Risk: Owning stock below market price
Reward: Premium received
It is a disciplined way to enter stocks at lower prices.

Option Trading Strategies Basic Directional Option Strategies
1.1 Long Call Strategy
A long call involves buying a call option with the expectation that the underlying asset will rise significantly before expiration.
Market View: Bullish
Risk: Limited to premium paid
Reward: Unlimited
Best Used When: Strong upward momentum is expected
This strategy benefits from rising prices and increasing volatility. Time decay works against the buyer, so timing is crucial.
1.2 Long Put Strategy
A long put involves buying a put option expecting the price to fall sharply.
Market View: Bearish
Risk: Limited to premium paid
Reward: Substantial if price falls sharply
Best Used When: Strong downtrend or breakdown expected
Long puts are also used as insurance against falling markets.

Volatility Index Trading: Understanding and Strategies1. Introduction to the Volatility Index
A volatility index, commonly known as the VIX, is often referred to as the “fear gauge” of the market. It measures the expected price fluctuation of a stock market index over a specific period, usually 30 days. For instance, the most widely recognized VIX is the CBOE Volatility Index, which tracks the implied volatility of the S&P 500 index options.
Implied volatility is derived from option prices and reflects the market’s expectations of future market movements rather than historical price changes. When markets are calm, the VIX tends to be low, suggesting minimal expected price swings. Conversely, during periods of market stress, uncertainty, or geopolitical tension, the VIX often spikes, signaling heightened investor fear.
The concept of trading the volatility index appeals to investors because it provides opportunities to profit in both rising and falling markets, especially during high volatility periods when traditional strategies may struggle.
2. How Volatility Index Trading Works
Unlike conventional assets, the volatility index is not directly tradable. Traders cannot buy or sell the VIX itself; instead, they use derivative instruments such as futures, options, and exchange-traded products (ETPs) based on the VIX.
VIX Futures: These are contracts that speculate on the future value of the VIX. Each futures contract has an expiration date, and traders can profit from changes in the VIX level. The futures market allows for hedging and speculation in anticipation of market turbulence.
VIX Options: Similar to options on stocks or indices, VIX options give traders the right, but not the obligation, to buy or sell VIX futures at a predetermined strike price. Options offer flexibility to construct sophisticated strategies, including spreads and hedges against market downturns.
Exchange-Traded Products (ETPs): ETPs, such as VIX ETFs and ETNs, provide exposure to the volatility index without directly trading futures. These instruments are popular among retail investors due to their accessibility and simplified trading mechanics.
3. Characteristics of Volatility Trading
Volatility trading has unique characteristics that differentiate it from traditional asset trading:
Inverse Correlation with Equities: Typically, the VIX rises when stock markets fall and decreases when markets are bullish. This negative correlation allows traders to use the VIX as a hedge against market downturns.
Mean-Reverting Nature: The VIX generally exhibits mean-reverting behavior, meaning extreme spikes or dips tend to normalize over time. Traders often use this feature to design strategies that anticipate the index returning to its average level.
High Sensitivity to Market News: Economic data releases, central bank policies, geopolitical conflicts, and corporate earnings can trigger rapid VIX movements. Traders must stay informed to capture opportunities effectively.
Time Decay in Derivatives: Since VIX derivatives are tied to futures contracts, the value of options and ETPs is affected by contango (when future prices are higher than the spot) or backwardation (when future prices are lower). Understanding this is crucial for timing trades.
4. Common VIX Trading Strategies
Volatility index trading requires specialized strategies, as it behaves differently from equities. Here are several popular approaches:
a) Hedging Strategies
Investors use VIX instruments to protect their portfolios from sudden market declines. By taking a long position in VIX futures or ETFs, traders can offset losses in equities during market crashes. This is particularly effective for institutional investors holding large stock positions.
b) Directional Trading
Traders can take positions based on anticipated market volatility:
Long Volatility: Buy VIX futures or options expecting an increase in market volatility, often during economic uncertainty or political events.
Short Volatility: Sell VIX derivatives anticipating low volatility or market stability, profiting from premium decay.
c) Spread Strategies
Traders often use calendar spreads and straddles to exploit VIX volatility patterns:
Calendar Spread: Buying a longer-dated VIX future while selling a shorter-dated one to benefit from convergence or divergence in contract prices.
Straddle/Strangle: Buying options with the same strike (straddle) or different strikes (strangle) to profit from significant volatility swings, regardless of direction.
d) Mean Reversion Plays
Since the VIX is mean-reverting, traders may buy when the index is unusually low and sell when it spikes excessively. Technical analysis indicators like Bollinger Bands or moving averages are commonly applied to identify entry and exit points.
5. Advantages of VIX Trading
Diversification: VIX derivatives allow investors to diversify portfolios beyond traditional asset classes.
Risk Management: Provides an effective hedge against market downturns.
Profit in Bear Markets: Unlike long-only equity strategies, VIX trading offers profit potential even when markets decline.
Leverage Opportunities: Futures and options allow for amplified returns, although with increased risk.
6. Risks in Volatility Index Trading
Despite its benefits, trading the VIX carries significant risks:
Complexity: Derivatives on volatility are highly complex and require deep understanding of futures markets and options pricing.
Time Decay and Roll Costs: Long-term VIX strategies may incur costs due to contango and options’ theta decay.
Rapid Price Swings: The VIX can spike dramatically in minutes due to news or market panic, leading to sudden losses.
Liquidity Issues: Some VIX derivatives may have lower liquidity compared to underlying equity markets, affecting trade execution.
7. Tools and Analysis Techniques
Successful VIX trading relies on a combination of technical analysis, fundamental insights, and sentiment monitoring:
Technical Indicators: Moving averages, Bollinger Bands, RSI, and Fibonacci levels help identify mean-reversion points and breakout signals.
Macro Analysis: Monitoring interest rates, inflation, central bank announcements, and global events provides context for expected volatility.
Market Sentiment: Tracking option volumes, put-call ratios, and equity flows gives insight into fear or complacency levels among investors.
8. Practical Considerations
Before entering VIX trading, investors should:
Understand Derivative Mechanics: Ensure familiarity with futures contracts, option greeks, and leverage.
Set Risk Management Rules: Use stop-losses, position sizing, and diversification to manage extreme market swings.
Stay Updated: Monitor economic calendars, geopolitical news, and market sentiment indicators.
Start Small: Begin with limited positions in ETFs or options before scaling to larger futures trades.
9. Conclusion
Volatility index trading represents a sophisticated approach to financial markets, offering opportunities to hedge risk, diversify portfolios, and profit from market uncertainty. While the VIX does not trade like conventional assets, futures, options, and ETPs provide avenues for speculation and risk management. Its unique characteristics, such as negative correlation with equities, mean-reversion tendencies, and sensitivity to macro events, make it both an attractive and challenging instrument.
Traders must combine technical and fundamental analysis with disciplined risk management to navigate VIX trading effectively. Those who master it gain a powerful tool to capitalize on market volatility and protect their investments during periods of uncertainty.
In essence, VIX trading is not just a speculative activity—it is a strategic approach to understanding and navigating the psychology of the markets, turning fear into opportunity.

Inflation Nightmare Continues1. Understanding the Inflation Nightmare
Inflation refers to a sustained rise in the general price level of goods and services, reducing the purchasing power of money. When inflation remains high for a prolonged period and becomes difficult to control, it turns into an “inflation nightmare.” This nightmare is characterized by persistent cost pressures, declining real incomes, policy dilemmas, and economic uncertainty. In many economies, inflation has stopped being a short-term shock and has become a structural problem, affecting households, businesses, and governments alike.
2. Persistent Rise in Cost of Living
One of the most visible effects of continuing inflation is the relentless rise in the cost of living. Prices of essential items such as food, fuel, housing, healthcare, and education continue to increase faster than income growth. Middle-class and lower-income households suffer the most, as a larger portion of their earnings goes toward necessities. Even salaried individuals with stable jobs find it increasingly difficult to maintain their previous standard of living.
3. Erosion of Purchasing Power
High inflation steadily erodes purchasing power. Money saved today buys fewer goods and services tomorrow. Fixed-income groups such as pensioners, retirees, and low-wage workers are hit hardest because their incomes do not adjust quickly to rising prices. Over time, this erosion discourages savings and pushes people toward risky investments just to preserve wealth.
4. Food Inflation and Supply-Side Pressures
Food inflation plays a central role in prolonging the inflation nightmare. Factors such as climate change, erratic monsoons, droughts, floods, rising fertilizer costs, and supply chain disruptions push food prices higher. Since food constitutes a significant share of household expenditure, especially in developing economies, even moderate food inflation causes severe social and political stress.
5. Energy Prices and Fuel Shock
Energy prices remain a major driver of inflation. Rising crude oil, natural gas, and electricity costs increase transportation, manufacturing, and logistics expenses. These higher input costs are passed on to consumers, creating second-round inflation effects. Fuel inflation also affects public transport fares and freight costs, amplifying price pressures across the economy.
6. Global Factors Fueling Inflation
The inflation nightmare is not limited to one country; it is global in nature. Geopolitical conflicts, trade disruptions, sanctions, and de-globalization trends have increased the cost of imports and reduced supply efficiency. Currency depreciation in emerging markets further worsens inflation by making imported goods more expensive, particularly energy and technology-related products.
7. Wage-Price Spiral Risk
As inflation persists, workers demand higher wages to cope with rising living costs. While wage hikes are necessary for survival, they can lead to a wage-price spiral. Businesses facing higher wage bills raise product prices, which in turn triggers fresh wage demands. This self-reinforcing cycle makes inflation harder to control and prolongs the nightmare.
8. Impact on Businesses and Profit Margins
Businesses face rising input costs, higher borrowing rates, and uncertain demand. Small and medium enterprises (SMEs) are particularly vulnerable because they have limited pricing power and thinner margins. Many companies are forced to either reduce output, compromise on quality, or pass costs onto consumers, further fueling inflationary pressures.
9. Central Bank Policy Dilemma
Central banks play a critical role in fighting inflation, but persistent inflation puts them in a policy dilemma. Raising interest rates helps control inflation but slows economic growth, increases unemployment, and raises borrowing costs. Keeping rates low supports growth but risks allowing inflation to spiral out of control. This delicate balance makes policy decisions more complex and politically sensitive.
10. High Interest Rates and Borrowing Stress
To curb inflation, central banks often increase interest rates. While this helps cool demand, it also raises EMIs on home loans, personal loans, and business credit. Households delay spending, and companies postpone expansion plans. High interest rates can eventually lead to economic slowdown or even recession, deepening public anxiety.
11. Government Fiscal Challenges
Inflation increases government expenditure on subsidies, welfare schemes, and interest payments on debt. At the same time, governments face pressure to reduce taxes or provide relief to citizens. Balancing fiscal discipline with social support becomes increasingly difficult, especially for developing economies with limited resources.
12. Rising Inequality
Persistent inflation worsens income and wealth inequality. Wealthier individuals often hold assets like real estate, equities, or commodities that appreciate with inflation, while poorer households rely on cash incomes and savings that lose value. As a result, the gap between rich and poor widens, leading to social tension and dissatisfaction.
13. Decline in Consumer Confidence
When inflation remains high, consumer confidence weakens. People become cautious, postpone discretionary spending, and focus only on essentials. Reduced consumption affects business revenues, slows economic growth, and increases the risk of stagflation—a situation where high inflation coexists with low growth.
14. Impact on Financial Markets
Inflation uncertainty creates volatility in financial markets. Equity markets struggle as higher interest rates reduce corporate earnings valuations. Bond prices fall as yields rise. Investors constantly rebalance portfolios to hedge against inflation, often favoring commodities, gold, or inflation-protected assets, which further shifts capital flows.
15. Long-Term Economic Damage
If the inflation nightmare continues unchecked, it can cause long-term economic damage. Investment slows, productivity growth weakens, and innovation suffers. Economic planning becomes difficult for both households and businesses, reducing overall efficiency and confidence in the system.
16. Psychological and Social Stress
Beyond economics, inflation creates psychological stress. Constant worry about rising expenses affects mental health, family stability, and social harmony. Public frustration often manifests in protests, political pressure, and demands for policy changes, increasing social instability.
17. The Road Ahead
Ending the inflation nightmare requires coordinated efforts. Structural reforms, supply-side improvements, stable monetary policy, fiscal discipline, and global cooperation are essential. Short-term relief measures must be balanced with long-term solutions to ensure sustainable price stability without sacrificing growth.
18. Conclusion
The continuation of the inflation nightmare is one of the most pressing challenges facing modern economies. It affects every layer of society—from households and businesses to governments and financial markets. Persistent inflation erodes purchasing power, fuels inequality, distorts investment decisions, and creates policy dilemmas. Addressing it requires patience, credibility, and well-coordinated economic strategies. Until inflation is firmly under control, the nightmare remains far from over.

Index Rebalancing Impact 1. What Is Index Rebalancing?
An index is a benchmark that tracks the performance of a selected group of securities, such as the Nifty 50, Sensex, S&P 500, or MSCI indices. Each index follows predefined rules regarding:
Number of constituents
Eligibility criteria (market capitalization, liquidity, free float)
Weighting methodology (market-cap weighted, equal-weighted, factor-based)
Index rebalancing occurs at regular intervals—quarterly, semi-annually, or annually—when the index provider reviews and updates its constituents and weights. Stocks may be added, removed, or reweighted based on changes in market capitalization, liquidity, corporate actions, or methodology updates.
2. Why Index Rebalancing Is Necessary
Markets are dynamic. Company valuations, liquidity profiles, and business fundamentals change over time. Without rebalancing, an index could become outdated or misrepresentative. Rebalancing ensures:
The index remains aligned with its objective
Accurate representation of the market or sector
Consistency and credibility for benchmark users
For example, if a fast-growing company’s market cap increases significantly, its index weight must rise. Conversely, declining or illiquid companies may be removed.
3. Role of Passive Investing in Rebalancing Impact
The rise of passive investing has dramatically increased the importance of index rebalancing. Exchange-Traded Funds (ETFs), index mutual funds, and pension funds replicate indices mechanically. When an index changes, these funds must buy or sell stocks to match the new composition—regardless of price or fundamentals.
This forced buying and selling creates predictable demand and supply shocks, leading to:
Sudden price movements
Volume spikes
Temporary mispricing
As passive assets grow, rebalancing effects have become stronger and more visible.
4. Impact on Stock Prices
a) Stocks Added to an Index
When a stock is added:
Passive funds must buy the stock
Demand increases sharply
Prices often rise before and on the rebalancing date
This phenomenon is known as the “index inclusion effect.” In many cases, the price rally begins after the announcement and peaks near the effective date.
b) Stocks Removed from an Index
When a stock is removed:
Passive funds are forced sellers
Supply increases suddenly
Prices often decline
This is referred to as the “index exclusion effect.” The negative impact may persist for some time due to reduced visibility and lower institutional ownership.
5. Liquidity and Volume Effects
Index rebalancing days are among the highest-volume trading sessions in markets. Key impacts include:
Sharp increase in traded volumes
Higher market depth in index-heavy stocks
Temporary liquidity stress in smaller stocks
Large-cap stocks usually absorb flows smoothly, while mid-cap and small-cap stocks may experience exaggerated price moves due to thinner liquidity.
6. Volatility During Rebalancing
Rebalancing can increase short-term volatility, especially:
Near the closing session on the effective date
In stocks with large weight changes
In indices with high passive ownership
Intraday price swings, large block trades, and closing-auction imbalances are common. However, this volatility is usually event-driven and short-lived, not necessarily a reflection of fundamental risk.
7. Impact on Index Weights and Sector Allocation
Rebalancing does not only change individual stocks—it also affects sectoral exposure. For example:
Higher weight to IT or banking if those sectors outperform
Reduced weight to underperforming sectors
This has a cascading effect:
Sector ETFs must rebalance
Portfolio asset allocation changes
Relative sector performance may shift temporarily
8. Effects on Active Investors and Traders
a) Arbitrage Opportunities
Active traders often try to profit from predictable rebalancing flows:
Buying stocks expected to be added
Short-selling stocks likely to be removed
However, these strategies are competitive and require precise timing, cost control, and liquidity management.
b) Tracking Error Considerations
Active funds benchmarked to indices must manage tracking error. Sudden index changes can:
Increase deviation from benchmark
Force portfolio realignment
Impact short-term performance metrics
9. Long-Term Fundamental Impact
A key debate is whether index rebalancing has lasting fundamental effects. Research suggests:
Short-term price impact is strong
Long-term impact is mixed
Inclusion can improve:
Analyst coverage
Institutional ownership
Corporate visibility
However, it does not automatically improve business fundamentals. Over time, stock prices tend to realign with earnings, growth, and balance-sheet strength.
10. Market Efficiency and Criticism
Index rebalancing has raised concerns about market efficiency:
Prices move due to flows, not fundamentals
Passive investing may amplify bubbles
Overcrowding in index heavyweights
Critics argue that excessive index concentration can distort capital allocation. Supporters counter that rebalancing improves transparency, discipline, and cost efficiency for investors.
11. Indian Market Perspective
In India, index rebalancing of Nifty 50, Nifty Bank, Nifty Next 50, Sensex, and MSCI India has significant impact due to:
Rising ETF and FPI participation
Increasing passive AUM
Lower liquidity in mid-cap stocks
MSCI rebalancing, in particular, attracts large foreign flows and often causes sharp price and volume changes in affected stocks.
12. How Investors Should Approach Rebalancing Events
Long-term investors should avoid emotional reactions and focus on fundamentals
Short-term traders should be cautious of volatility and execution risks
Portfolio managers should plan transitions early to reduce market impact
Understanding announcement dates, effective dates, and expected flows is crucial.
13. Conclusion
Index rebalancing is far more than a technical adjustment—it is a powerful market-moving event. Driven by the growth of passive investing, rebalancing influences prices, liquidity, volatility, and investor behavior across global and Indian markets. While the immediate impact is often mechanical and temporary, the broader implications for market structure, efficiency, and capital allocation are profound.
For anyone active in financial markets, understanding index rebalancing is no longer optional—it is essential for informed decision-making, risk management, and opportunity identification.

Nifty 50 spot 26046.95 by the Daily Chart viewNifty 50 spot 26046.95 by the Daily Chart view
- Support Zone is intact at 25710 to 26010 for Nifty Index
- Resistance Zone stands stable at 26200 to ATH 26325.80 for Nifty Index
- Volumes keeping stable under average traded quantity over past few days
- Falling Resistance Trendline Breakout attempts seem in the making process

Bank Nifty spot 59389.95 by the Daily Chart viewBank Nifty spot 59389.95 by the Daily Chart view
- Support Zone intact at 58850 to 59375 for Bank Nifty
- Resistance Zone stands tall at 59825 to ATH 60114.30 for Bank Nifty
- Volumes keeping stable under avg traded quantity over past few days
- Falling Resistance Trendline Breakout attempts seem in the making process

Info Edge India cmp 1377.70 by Daily Chart viewInfo Edge India cmp 1377.70 by Daily Chart view
- Support Zone 1268 to 1315 Price Band
- Resistance Zone 1405 to 1455 Price Band
- Darvas Box : Stock trading in 1300 to 1432 Range
- Falling Resistance Trendline Breakout attempts made
- Volumes spiking regularly above average traded quantity

ABB 1 Day Time Frame 📍 Current Price (as of latest market update)
• Around ₹5,278 on NSE/BSE today (Mid-day/last traded level) — up ~0.68% vs previous close.
🔁 Daily Pivot, Support & Resistance Levels (1-Day Frame)
These are dynamic levels derived from recent trades & pivot formulas used by traders to gauge likely intraday turning points:
📊 Standard Daily Pivot Levels (based on recent data):
Level Approx Value
R3 (Strong Resistance) ₹5,377
R2 (Secondary Resistance) ₹5,338
R1 (First Resistance) ₹5,308
Pivot Point (Central) ~₹5,269
S1 (First Support) ₹5,239
S2 (Secondary Support) ₹5,200
S3 (Strong Support) ₹5,170
