Part 6 Learn Institutional Trading Types of Option Based on Moneyness
In-The-Money (ITM)
Call Option: Strike < Market Price
Put Option: Strike > Market Price
At-The-Money (ATM)
Strike = Market Price (closest)
Out-Of-The-Money (OTM)
Call Option: Strike > Market Price
Put Option: Strike < Market Price
OTM options are cheaper but riskier.
Trendlineanalysis

Part 4 Learn Institutional Trading Advantages of Option Trading
1. Limited Risk for Buyers
Buyers can only lose the premium.
2. Leverage
You control a big position with small capital.
3. Flexibility
Can be used for speculation, hedging, income, blending multiple strategies.
4. Huge Earning Potential
Strong moves give massive percentage returns.

Part 2 Ride The Big MovesPopular Option Trading Strategies
Some commonly used strategies:
1. Covered Call
Hold stock + sell a call option for income.
2. Protective Put
Buy a put to hedge stock holdings.
3. Straddle
Buy ATM Call + ATM Put → profits during big movements.
4. Strangle
Buy OTM Call + OTM Put → cheaper than straddle.
5. Iron Condor
Sell OTM Call + Put and hedge with further OTM options.
Used in sideways markets.
6. Spread Strategies (Bull Call Spread, Bear Put Spread)
Buy one option and sell another to reduce cost and risk.

Part 1 Ride The Big MovesTips for Beginners
✔ Start with buying options
You learn direction and risk without big losses.
✔ Focus on one index (like Nifty)
Better to understand one market deeply.
✔ Avoid trading near major news
Volatility can be unpredictable.
✔ Manage risk
Never trade with full capital.
✔ Keep emotions low
Discipline outweighs excitement in option trading.

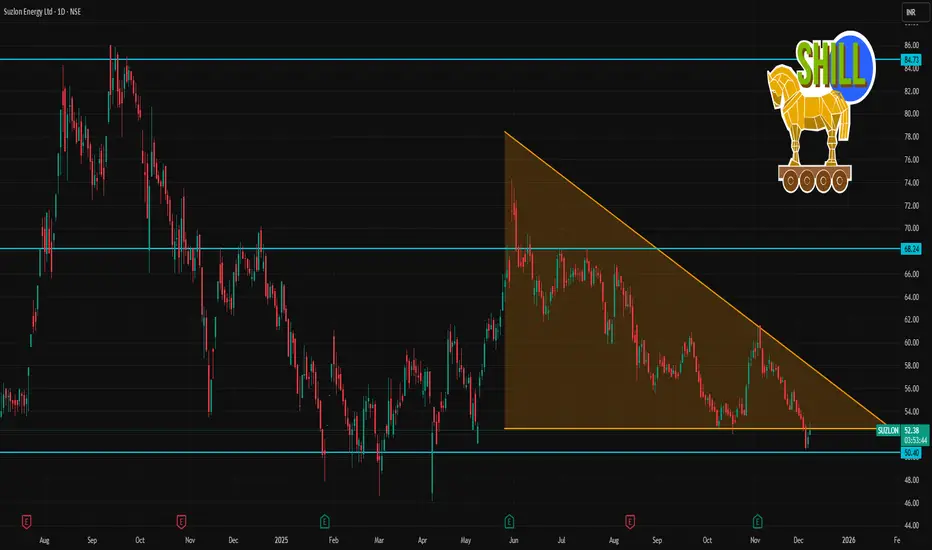
SUZLON 1 Day Time Frame 📈 Current Price & Range
Last close / recent quote: ~ ₹ 52.80–₹ 52.85.
Today’s intraday range (low → high): ₹ 51.89 → ₹ 53.00.
⚠️ Technical Bias / What It Suggests Short‑Term
Price is hovering near ₹ 52.8–53 region, just above immediate support — suggests a SHORT‑TERM indecision / consolidation.
Unless price clears ₹ 53.7 – 54 convincingly (with volume), upside may remain limited.
On downside, a breakdown below ₹ 51.0 – 50.9 could accelerate toward ₹ 49.5 – 50.1.
🧮 What to Watch / Confirmations
A sustainable daily close above ~ ₹ 54.5–55 could tilt bias bullish (towards ~₹ 56 zone).
A break + close below ~ ₹ 50.9 — especially on higher volume — may open path toward ~ ₹ 49.5 – 50 zone.
Watch intraday volume & market momentum — given SUZLON tends to be volatile, these often define short‑term swing direction.
Premium Chart Patterns Premium patterns help traders understand:
Smart money manipulation
Market structure transitions
Liquidity-based entries
Institutional imbalances
Reversal and continuation logic
They are more reliable than basic chart patterns because they reflect:
Actual institutional logic
Market psychology
Liquidity engineering
Price inefficiencies and corrections
Premium chart patterns are essential for traders who want to trade professionally and understand the true mechanics behind price movement.

Algo Trading & Backtesting1. What Is Algorithmic Trading?
Algorithmic trading (algo trading or automated trading) uses computer programs to execute buy and sell orders based on predefined rules. These rules are written using logic, mathematics, technical indicators, statistical models, or machine learning.
Key characteristics:
Speed: Algorithms execute trades in milliseconds.
Accuracy: Orders are placed exactly as coded, without emotional interference.
Consistency: Strategies run the same way every time.
Scalability: Algorithms can scan hundreds of stocks simultaneously.
Automation: Removes manual effort and human error.
Examples of algo rules:
Buy when the 50-day moving average crosses above the 200-day moving average.
Enter long if RSI < 30 and exit if RSI > 60.
Execute mean reversion when prices deviate from their statistical average.
Place a market-making order when bid-ask spread widens beyond a threshold.
Algo trading is used widely in equities, commodities, forex, crypto, futures, and options markets.
2. Why Algo Trading Matters
Algo trading is not just for institutions anymore. Retail traders now have access to powerful tools like NinjaTrader, TradingView Pine Script, Amibroker AFL, Python (Pandas, NumPy), Zerodha Streak, AlgoBulls, etc.
There are several advantages:
1. Eliminates emotions
Fear, greed, hesitation, revenge trading—algos remove them completely.
2. Enhances speed & efficiency
A computer can process multiple charts at once—no possibility for manual delays.
3. Reduces costs
Efficient execution reduces slippage, spreads, and missed opportunities.
4. Backtesting improves confidence
You know how your strategy performed historically before risking real capital.
5. Suitable for all market styles
Trending, scalping, intraday, swing trading, options strategies—algos cover everything.
3. Core Components of Algo Trading
1. Strategy Logic
The brain of the algorithm. Types include:
Trend-following strategies
Mean reversion models
Breakout systems
Arbitrage models
Options premium-selling/hedging algorithms
Machine learning predictive models
2. Data
The quality of the data determines the quality of your strategy.
Historical data (OHLC, volumes)
Real-time data (market feed)
Fundamental data
Tick/Orderbook data (advanced)
3. Programming Environment
Most common:
Python
TradingView Pine Script
Amibroker AFL
C++ (HFT level)
MetaTrader MQL
Proprietary platforms
4. Execution Engine
A platform that sends orders to the exchange via API.
5. Risk Management Module
Includes:
Stop-loss
Target
Position sizing (fixed lot, % of capital)
Max daily loss
Drawdown limits
Volatility filters
6. Monitoring & Optimization
Live dashboards help track:
Real-time P&L
Slippage
Latency
Execution errors
4. Backtesting – The Heart of Algo Trading
You cannot run an algorithm blindly. You must test it on past data to understand how it behaves. This process is called backtesting.
What Is Backtesting?
Backtesting is the simulation of a trading strategy on historical price data to evaluate its performance. It answers questions like:
Would the strategy have made money?
How much drawdown would it suffer?
What is the risk-reward ratio?
How consistent are returns?
How often does it win?
How Backtesting Works?
Step 1: Define the rules
Example strategy:
Buy when price closes above 20 EMA
Sell when price closes below 20 EMA
Risk 1% of capital per trade
Stop-loss = 1.5%
Target = 3%
Step 2: Select historical data
A minimum of:
2–5 years for intraday
5–10 years for swing
10–15 years for trend models
Step 3: Run the simulation
The software applies your rules on every candle historically.
Step 4: Analyze metrics
Some essential backtesting metrics:
✔ CAGR (Annual Return)
Measures yearly profit.
✔ Win Rate %
How many trades were profitable vs total bets.
✔ Profit Factor
Total gross profit ÷ total gross loss.
PF > 1.5 = Good; PF > 2 = Strong.
✔ Drawdown %
The maximum fall from peak equity.
Lower drawdown = safer strategy.
✔ Sharpe Ratio
Reward/risk ratio based on volatility.
✔ Average trade return
Shows how much each trade earns.
✔ Expectancy
Average win × win rate − average loss × loss rate.
Step 5: Optimize (carefully!)
Adjust parameters to improve performance, but avoid overfitting.
5. Types of Backtesting
1. Historical Backtesting
Runs strategy on past OHLC data.
2. Walk-Forward Testing
Split data into in-sample (training) and out-of-sample (testing).
3. Monte Carlo Simulation
Tests strategy performance across random variations.
4. Paper Trading / Forward Testing
Real-time simulation in live markets without real money.
6. Why Backtesting Can Mislead (Pitfalls)
Backtesting is powerful but dangerous if not done correctly.
1. Overfitting
Your strategy may perform well on history but fail in real markets.
2. Look-Ahead Bias
Using future data unknowingly, giving unrealistic results.
3. Survivorship Bias
Testing only stocks that survived, ignoring delisted ones.
4. Slippage & Transaction Costs
Real-world execution is worse than simulated execution.
5. Market Regime Changes
A strategy profitable during trending phases may fail during sideways markets.
Professional algo traders spend more time fixing biases than writing strategies.
7. Algo Trading Strategies Common in India
1. Trend-Following on NIFTY Futures
EMA crossover, Supertrend, Donchian breakout.
2. Options Selling Strategies
Short Straddle
Short Strangle
Iron Condor
Delta-neutral hedged selling
3. Mean Reversion in Bank Nifty
Price touches lower Bollinger Band → Buy.
4. Intraday Momentum
Breakout of previous day high/low.
5. Arbitrage Models
Cash–futures arbitrage, index arbitrage.
8. Tools & Platforms to Start Algo Trading
Beginner-Friendly
Zerodha Streak
Dhan Options Trader
Angel Algo
TradingView (Pine Script)
Intermediate
Python (using broker APIs)
Amibroker AFL
MetaTrader MQL
Advanced / Professional
QuantConnect
AlgoQuant
C++ HFT engines
Custom low-latency systems
9. Steps to Build a Profitable Algo Trading System
Step 1: Identify a market inefficiency
Find behaviors that occur consistently:
Monday gap filling
Tuesday volatility
Post-2:30 p.m. breakouts
Overnight momentum
Step 2: Create rules
Clear, unambiguous logic.
Step 3: Backtest
Use extensive and high-quality data.
Step 4: Evaluate metrics
Cut poor strategies early.
Step 5: Forward test
Test in real time without money.
Step 6: Deploy small capital
Scale only after long-term stability.
Step 7: Monitor & refine
Markets change → algos must evolve.
Conclusion
Algo trading and backtesting together form a powerful framework for systematic, disciplined, and scalable trading. Instead of relying on emotions or random decisions, traders build clear rules, test them against history, validate them in real-time, and automate execution to gain precision and consistency. With proper design, risk control, and continuous improvement, algorithmic trading can significantly enhance performance in equities, commodities, forex, indices, and options.
Trading Journaling & Performance Tracking1. What Is Trading Journaling?
A trading journal is a structured record of every trade you take. It captures not only the technical details (entry, stop-loss, exit, timeframe, strategy) but also the emotional and psychological conditions during the trade. In simple terms, it is your personal trading diary.
A good trading journal helps you accomplish three critical objectives:
Identify patterns in your winning and losing trades.
Control emotions by documenting psychological triggers.
Improve your strategies through review and data-driven insights.
Whether you are a beginner or an experienced trader, a well-maintained journal is essential because the market constantly changes, but human behavior (your habits) often stays the same—until you correct it with feedback.
2. Why Trading Journaling Matters
a) Builds Discipline
Trading without a journal is like running a business without keeping accounts. You may earn profits occasionally, but you’ll never know what’s really working. Journaling forces you to follow rules and avoid impulsive decisions.
b) Helps You Learn From Mistakes
Most traders repeat the same mistakes—late entries, early exits, overtrading, revenge trading—because they never document them. Journaling exposes these harmful patterns.
c) Improves Strategy Effectiveness
When you review 50 or 100 trades of a single strategy, you can clearly see whether that setup is profitable or needs adjustment.
d) Strengthens Mindset & Emotional Control
By noting your emotional state before and during trades, you learn how emotions like fear, FOMO, greed, and panic affect your performance.
e) Converts Trading Into a Structured Process
Trading becomes predictable, measurable, and therefore improvable. This is the foundation of consistency.
3. What to Include in a Trading Journal
A professional trading journal usually includes the following elements:
1. Trade Details
Date & time
Market/instrument (NIFTY, BankNifty, stocks, forex, crypto)
Position type (long/short)
Timeframe (1D, 1H, 5min, etc.)
Entry and exit price
Stop-loss & target
Position size
2. Strategy Used
Breakout
Pullback
Trend-following
Price Action
Reversal
Indicator-based strategy (RSI, MACD, EMA, etc.)
This helps you track which strategy performs the best.
3. Pre-Trade Reasoning
Why did you take the trade?
What conditions were met?
Was the market trending, choppy, or volatile?
This ensures you are trading based on logic, not emotion.
4. Emotions Before, During, and After the Trade
Mark emotions such as:
Confident
Fearful
Greedy
Hesitant
Excited
Impulsive
This creates emotional awareness.
5. Trade Outcome
Profit or loss
R:R (risk-to-reward ratio)
Whether you followed your plan or not
6. Screenshot of Chart
This visually reinforces your learning.
7. Post-Trade Review
What went right?
What went wrong?
What could be improved?
Did you exit early or late?
Over time, these notes become extremely valuable.
4. Performance Tracking: Measuring Your Progress
While journaling captures trade-by-trade details, performance tracking converts those details into data for analysis.
It measures how well you are performing overall.
Here’s what to track:
1. Win Rate
Percentage of profitable trades.
A high win rate doesn’t always mean profitability—your R:R matters more.
2. Average Risk-to-Reward Ratio
Your average loss vs. your average gain.
A trader with a 40% win rate can still be profitable with a strong R:R.
3. Profit Factor
Total profit divided by total loss.
A profit factor above 1.5 is good; above 2.0 is strong.
4. Maximum Drawdown
Largest equity decline from a peak.
This helps understand your worst trading phase and how to manage risk better.
5. Monthly & Weekly Performance
Track:
Profit/loss
Number of trades
Mistakes made
Market environments
This shows how your performance changes with market conditions.
6. Strategy-wise Performance
Analyze which strategies give the best results:
Breakout strategy win rate
Reversal setups
Indicator combinations
Timeframe performance
Drop strategies that consistently underperform.
7. Psychological Performance
Track recurring emotional challenges:
Overtrading
FOMO entries
Early exits
Fear-based hesitation
You can create an emotion-mistake leaderboard and try to eliminate the top offenders.
5. Tools for Journaling and Tracking
You can use:
1. Excel/Google Sheets
Highly customizable and easy to use.
2. Dedicated Trading Journal Apps
TraderSync
Tradervue
Edgewonk
Notion (with custom templates)
3. Manual Notebook
Good for psychological and emotional notes.
4. Screenshots + Annotation Tools
Helps capture chart context.
The best tool is the one you will use consistently.
6. How Journaling Improves Trading Consistency
a) Clear Feedback Loop
Every trade becomes a lesson, not a random event.
b) Helps Identify Strengths
You’ll find:
Which time of day you trade best
Which setups fit your personality
Which markets give you the best results
You slowly refine your edge.
c) Eliminates Unforced Errors
When you see your repeated mistakes, you naturally work to eliminate them:
Moving SL
Taking trades outside strategy
Chasing entries
Over-exposure
d) Enhances Risk Management
Performance tracking highlights:
When you risk too much
When you break position sizing rules
Better risk = smoother equity curve.
e) Improves Emotional Intelligence
You become a calmer, more objective trader.
7. Monthly Review: The Secret Weapon
Every month, conduct a detailed review:
Top 5 best trades
Top 5 losing trades
Mistakes repeated
New patterns noticed
Strategy-level performance
Emotional stability score
Improvements for next month
This helps you evolve and refine your trading approach.
8. Long-Term Benefits of Journaling
After 6–12 months, a trading journal becomes a goldmine:
It shows your transformation as a trader.
It highlights your unique trading strengths.
It provides confidence during drawdowns.
It shapes your personal trading system.
Most importantly, it prevents you from being trapped in an emotional loop.
Professional traders treat journaling as mandatory.
Beginners treat it as optional—and that’s why they struggle.
Conclusion
Trading Journaling & Performance Tracking is not just a habit; it’s the backbone of trading success. While strategies help you enter and exit trades, journaling helps you refine your behavior, recognize patterns, control emotions, and develop consistency. It transforms your trading from guesswork into a structured, measurable, and improvable process.
If you want to grow as a trader, start journaling today. Even a simple step like writing down entries, exits, emotions, and mistakes can dramatically improve your performance. Over time, your journal becomes your personal trading mentor—one that knows your strengths, weaknesses, and the path to your success better than any external source.

IPO & SME IPO Analysis1. What Is an IPO?
An Initial Public Offering (IPO) is when a private company offers its shares to the public for the first time and becomes listed on stock exchanges such as NSE or BSE. This allows the company to:
Raise capital for expansion, debt repayment, or acquisitions
Increase brand value and credibility
Provide exit opportunities to early investors
For investors, IPOs offer:
A chance to invest early in a growing company
Potential for listing gains
Long-term wealth creation if fundamentals are strong
2. What Is an SME IPO?
An SME IPO is similar to a mainboard IPO but is designed for Small and Medium Enterprises. These companies are listed on SME platforms such as:
NSE Emerge
BSE SME
Characteristics of SME IPOs:
Smaller issue sizes (₹10–₹50 crore usually)
Higher risk but higher return potential
Mandatory market making for liquidity
Allotment in lots of minimum ₹1–2 lakh
SME IPOs have recently become extremely popular because many have delivered 100%–500% listing gains and strong long-term returns.
3. Types of IPO Issues
Understanding issue structure is essential before analyzing an IPO.
a) Fresh Issue
New shares created and sold
Money goes to the company
Used for expansion, debt reduction, capex
b) Offer for Sale (OFS)
Existing shareholders sell their stake
Money goes to them, not the company
High OFS sometimes indicates partial exit by promoters
c) Book Building Issue
Price band system
Final price based on investor demand
d) Fixed Price Issue
A single fixed price (mostly seen in SME IPOs)
4. Why IPO Analysis Is Important
Not all IPOs are profitable. Some get oversubscribed due to hype but fail to perform after listing. Others may not show massive listing gains but turn into multi-year wealth creators.
A thorough IPO analysis helps investors:
Identify strong businesses
Avoid overpriced or weak companies
Distinguish hype from genuine opportunity
Decide whether to apply for listing gains or long-term holding
5. Steps for IPO Analysis
Below are the core analytical steps used by professional investors and research analysts:
A) Company Background & Business Model
Start by analysing the company’s:
Industry
Products/services
Market share
Competitive advantage (moat)
Business scalability
Questions to ask:
Is the business model sustainable and future-ready?
Does the company operate in a growing industry?
Is the company fundamentally different from its competitors?
Example: A technology-focused or renewable-energy IPO generally finds more interest than a slow-growth traditional industry.
B) Financial Performance (3–5 Years)
Investors must review:
Revenue growth
Profit growth
EBITDA margins
Net Profit Margin (NPM)
Debt-to-Equity (D/E) ratio
Return on Equity (ROE)
Return on Capital Employed (ROCE)
Key principles:
Consistent growth = strong fundamentals
High ROE/ROCE = efficient company
Low debt = safer investment
Improving margins = healthy profitability
For SME IPOs, avoid companies with unstable financials or sudden one-year spikes (possible window dressing).
C) Valuation Analysis
Valuation shows whether the IPO is priced reasonably.
Metrics:
P/E Ratio compared to peers
P/B Ratio
EV/EBITDA
Market Cap-to-Sales Ratio
Sector Valuation Benchmarks
Red flag:
If valuation is too high compared to sector leaders, the stock may correct after listing.
D) Promoter & Management Quality
Strong leadership drives long-term performance.
Check:
Promoter background
Experience in the industry
Corporate governance track record
Litigation or fraud cases
Promoter shareholding after IPO
High promoter holding after IPO indicates strong confidence in the business.
E) Use of IPO Funds
Understand why the company needs capital.
Common uses:
Expansion or capacity building
Debt repayment
Acquisitions
Working capital
General corporate purposes
Prefer IPOs focused on growth and expansion rather than repaying old debt or giving exits to existing investors.
F) Peer Comparison
Compare the company with listed peers in terms of:
Market Share
Margins
Valuations
Growth Rate
Debt levels
This reveals whether the IPO is reasonably priced or overpriced.
G) Risk Factors
Every IPO has potential risks mentioned in the RHP/DRHP.
Typical risks include:
Dependence on a few clients
Regulatory issues
High debt
Competitive industry
Raw material price volatility
SME IPOs may also face:
Low liquidity
Limited track record
Smaller management teams
H) Grey Market Premium (GMP) & Subscription Data
GMP is an unofficial indicator of listing expectations.
Subscription data (QIB, HNI, Retail) shows demand.
Interpretation:
High QIB subscription = strong institutional confidence
High HNI subscription = aggressive listing expectation
Rising GMP = strong sentiment, but not always reliable
I) Post-Listing Strategy
Your decision depends on your goal.
For Listing Gains:
Focus on IPOs with strong GMP, high subscription, good financials
Book profits on listing if price rises sharply
For Long-Term Investment:
Focus on fundamentals, not GMP
Accumulate more if valuation becomes attractive after listing
6. SME IPO Analysis – Key Differences
SME IPOs require additional caution because they are smaller, riskier, and less regulated in terms of liquidity.
Important SME IPO Metrics
3-year financial stability
Strong promoter background
Consistent cash flows
Reasonable valuation
Low debt
Clear business expansion plan
Advantages of SME IPOs
High return potential
Early-stage investing opportunity
Many SME companies grow into mainboard success stories
Risks in SME IPOs
Low liquidity
High volatility
Smaller business scale
Potential for manipulation
Best Way to Approach SME IPOs
Focus on quality businesses, not hype
Prefer manufacturing, technology, healthcare, engineering SMEs
Avoid companies with sudden revenue spikes or loss-making history
7. How Retail Investors Should Approach IPOs
a) Identify Your Goal
Listing gain
Medium-term swing
Long-term holding
b) Read the RHP
This document contains complete details about financials, risks, promoter holdings, business strategy, etc.
c) Focus on QIB & HNI Demand
Institutions often understand valuations better.
d) Avoid Over-Hyped IPOs
Hype doesn’t guarantee gains.
e) Don’t Apply for Every IPO
Select quality, not quantity.
8. Key Indicators of a Strong IPO
A fundamentally strong IPO usually shows:
✔ Strong financial growth
✔ Low debt
✔ Good ROE & ROCE
✔ Experienced management
✔ Attractive valuation
✔ Positive GMP
✔ Strong QIB subscription
✔ Future-ready business model
Conclusion
IPO and SME IPO investing can be a powerful wealth-building strategy when done with proper analysis. While IPOs offer security and stable growth potential, SME IPOs offer higher risk but significantly higher rewards. The key to success lies in evaluating the company’s business model, financial health, promoter credibility, valuation, and demand indicators.
A disciplined approach—combining fundamental research with market sentiment—helps investors choose the right IPOs and avoid high-risk or overpriced ones. For long-term investors, a high-quality IPO can evolve into a multibagger, while SME IPOs can deliver extraordinary returns if selected wisely.

Option Trading Strategies Option Trading Strategies
Options allow many creative strategies—simple to advanced.
1. Single-Leg Strategies
Call Buying
Use when expecting sharp upside moves.
Put Buying
Use when expecting sharp downside moves.
Call Selling (Short Call)
Bearish or range-bound markets.
Put Selling (Short Put)
Bullish to neutral markets.

Part 2 Support and Resistance Call Options Explained
A call option increases in value when the price of the underlying asset rises.
Example:
Nifty is at 20,000. A trader buys a Nifty 20,100 Call Option.
If Nifty crosses 20,100 before expiry, the call option gains value and the buyer profits.
Call option buyers expect the price to go up.
Call option sellers expect the price to stay below the strike.

Part 1 Supprot and Resistance What Are Options?
Options are derivative contracts that give the trader a right, but not an obligation, to buy or sell an underlying asset at a pre-defined price (called the strike price) before or on a specific date (called the expiry).
There are two main types of options:
Call Option – gives the right to buy the underlying asset.
Put Option – gives the right to sell the underlying asset.
In options, the person who buys the contract is called the option buyer, and the one who sells (writes) the contract is the option seller or writer.

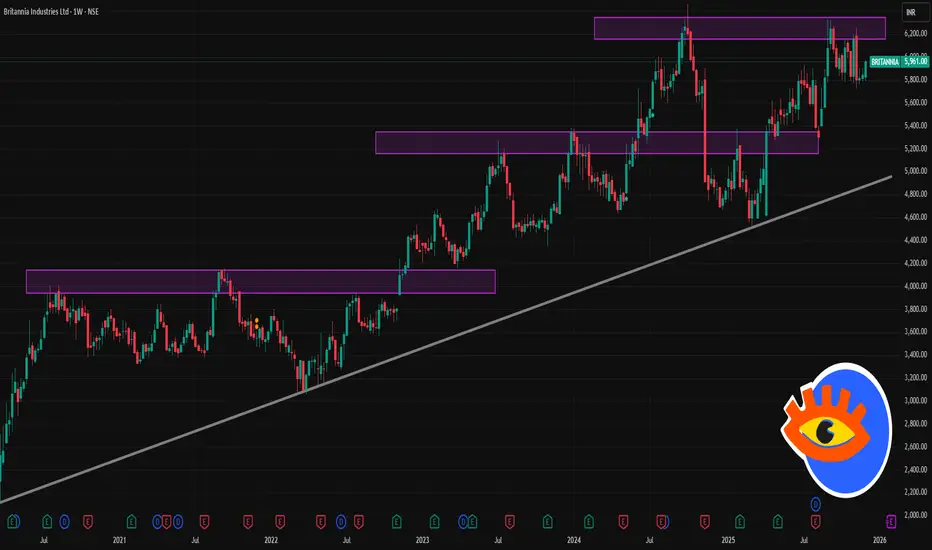
BRITANNIA 1 Week Time Feame 📊 Recent context & fundamentals
The stock is currently around ₹ 5,961.
52-week high / low: ~₹ 6,336 / ~₹ 4,506.
The company recently reported strong Q2 FY26 results — ~23% YoY rise in consolidated net profit, margin expansion, and stable commodity costs.
Overall valuation remains high (P/E ~ 62, high P/B), reflecting premium investor expectations.
✅ What looks favorable in next week
Given recent margin uptick, Q2 earnings beat, and technical strength, there is a moderate chance of continuation toward the ₹ 6,010-6,060 zone if broader market remains stable.
If market sentiment improves (or commodities stay stable), the bias could even push toward ₹ 6,140-6,150 — but that depends on volume support.
PCR Trading Strategies Basics of Options
Options come in two primary types:
Call Options: A call option gives the holder the right to buy the underlying asset at a specific price (known as the strike price) before or on the expiration date. Traders purchase calls if they anticipate the asset's price will rise.
Put Options: A put option gives the holder the right to sell the underlying asset at the strike price before or on expiration. Traders buy puts when they expect the asset's price to fall.
Key terms every options trader must understand:
Underlying Asset: The security or instrument upon which the option derives its value.
Strike Price: The price at which the option holder can buy or sell the underlying asset.
Premium: The price paid to purchase the option.
Expiration Date: The last date the option can be exercised.
In-the-Money (ITM): A call option is ITM if the underlying asset price is above the strike price; a put is ITM if the underlying price is below the strike price.
Out-of-the-Money (OTM): A call option is OTM if the underlying asset is below the strike price; a put is OTM if above.
At-the-Money (ATM): When the underlying price equals the strike price.

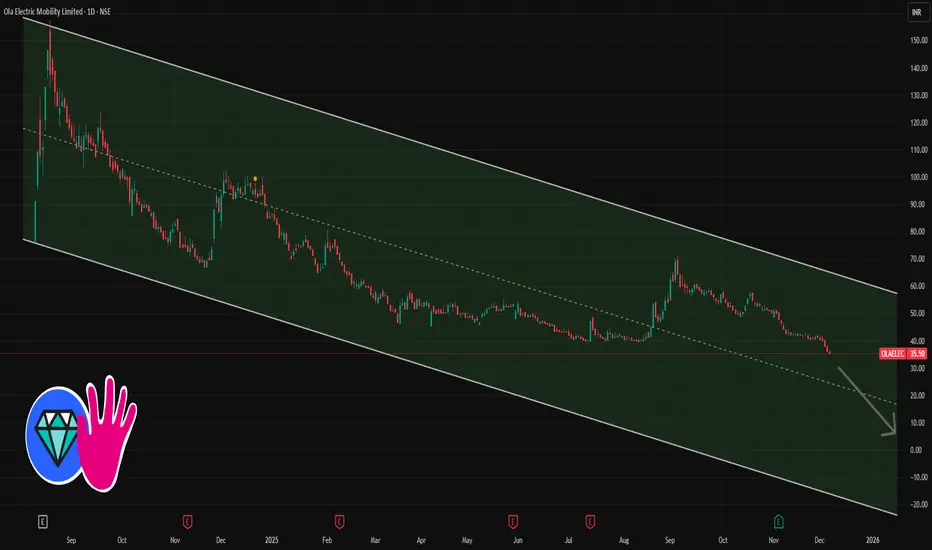
OLAELEC 1 Day Time Frame 📌 Ola Electric — Recent 1‑Day Snapshot
Metric / Info Value / Observation
“LTP” / Recent close (NSE) ₹ 35.50
Today’s trading range (approx) High ≈ ₹ 36.36, Low ≈ ₹ 34.80
52‑week range Low ₹ 34.80, High ₹ 100.40
Recent trend / momentum The stock recently hit fresh 52‑week / all‑time lows, with
heavy selling pressure and high volumes.
🔻 What’s the Technical/Market Context (for Today)
The stock is trading near its 52‑week low, meaning there’s likely limited downside (on a purely “price floor” basis) — but also minimal “margin of safety.”
The day’s high vs low shows modest intraday volatility (~ ₹1.5–2 range), indicating somewhat tight trading.
Given recent heavy selling and lack of clear rebound, the sentiment appears bearish in the short–term.
Because the share is significantly below its 52‑week high and all‑time high, expectations for a bounce would likely need strong positive trigger — e.g. corporate news, macro/EV‑sector tailwinds, or a shift in fundamentals.
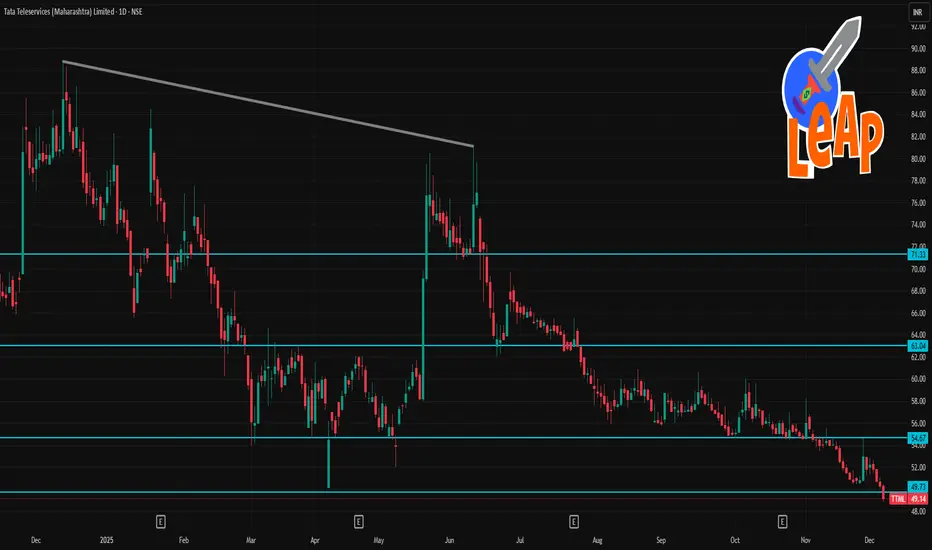
TTML 1 Day Time Frame 📈 Key data (as of 5 Dec 2025)
TTML closed around ₹ 49.14 – ₹ 49.16.
Day’s trading range: ≈ ₹48.83 – ₹50.46.
52-week range: ~ ₹48.83 (low) to ~ ₹88.90 (high).
🔎 Technical/Indicator Status (Short-Term)
According to a technical-analysis site: Most standard moving averages (5-day, 10-day, 20-day, 50-day, 100-day, 200-day) are signaling “Sell” on the 1-day chart.
Momentum indicators: 14-day RSI is ~ 27.6 (suggesting oversold).
Other indicators (MACD, Stochastic, CCI, etc.) also lean toward “Sell / Oversold.”
✅ What this suggests (for 1-day / very short-term traders)
TTML appears to be in a short-term downtrend or weak momentum: price below most moving averages, negative technical signals.
However, the oversold RSI might hint at a potential bounce or consolidation — some recovery might happen if market sentiment or broader triggers change.
Given recent 52-week low around current price levels, some traders may view current price zone as “bottom-ish.”
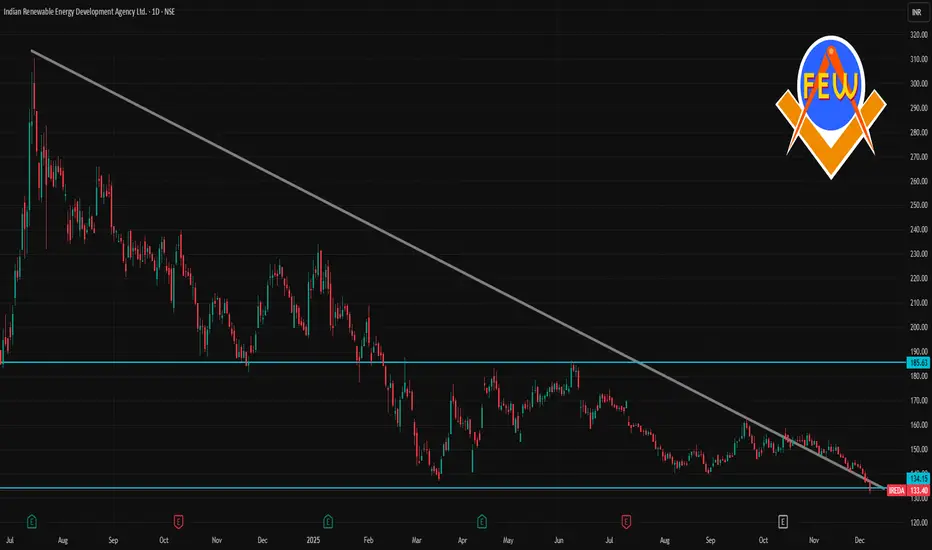
IREDA 1 Day Time Frame 📉 Today’s Price Action
Last traded price: ₹ 133.40
Day’s range: ₹ 132.00 – ₹ 137.29
Change vs previous close: – ₹ 3.35 (–2.45%)
📊 Key Context & Technical Snapshot
Metric / Indicator Value / Observation
52-week range ₹ 132.00 — ₹ 234.29
Relative valuation P/E ~ 21.7 ×
Market cap ~ ₹ 37,475 Cr
Recent momentum 1-week: –6.65%, 1-month: –11.66%
Volatility (ATR) ATR (5-day) ≈ ₹ 3.4
Interpretation (short-term / 1-day):
The stock is near its 52-week low zone — so the current level (~₹133) is close to its recent bottom band.
The drop today suggests selling pressure, but the intraday range shows some trading / bounce between ₹132–₹137.
Given the volatility (as indicated by ATR) and recent downward momentum, the stock looks “soft” in the very short term.
Premium Chart Patterns RISK MANAGEMENT FOR PREMIUM PATTERNS
Premium setup ≠ reckless trading.
Always follow:
1. SL Placement
Place SL at logical structure points, not near the breakout.
2. Position Sizing
Risk 1–2% per trade.
3. Exit Strategy
Use partial booking or trail SL using swing lows.

Candle Patterns Knowledge Candlestick Patterns + Indicators
Candles work superbly with key indicators:
Moving Averages (20/50/200)
Hammer above 50 EMA → powerful retracement
Bearish Engulfing below 20 EMA → continuation
RSI Divergence
Bullish pattern + RSI divergence = rock-solid reversal
Bearish pattern + bearish divergence = reliable entry
Bollinger Bands
Hammer at lower band
Shooting star at upper band

SME IPO BUZZ FOR HUGE PROFITS1. What Are SME IPOs — And Why the Buzz?
SME IPOs are public issues floated by Small and Medium Enterprises that list on specialized platforms like:
NSE SME (Emerge)
BSE SME
These platforms provide small companies a chance to raise capital and investors an opportunity to participate in early-stage growth stories.
Why SME IPOs Have Become a Hot Trend
Massive oversubscriptions
Many SME issues are oversubscribed 100x to even 800x, reflecting huge liquidity and demand.
High listing gains
Many SMEs deliver 50%–200% listing pop, significantly higher than mainboard IPO averages.
Cheaper valuations
SMEs often come with smaller balance sheets but high growth potential, offering attractive valuations.
Low float → High volatility → Big gains
Small supply of shares means demand pushes prices up quickly.
Improved regulation & transparency
SEBI and exchanges have strengthened compliance, improving investor confidence.
2. SME IPO Mechanics: How They Work
Understanding the framework helps in capturing big gains.
Minimum Investment Is Higher
Unlike mainboard IPOs, SME IPOs require:
Minimum lot size ₹1–2 lakh
At times, ₹3–4 lakh per lot
This filters out casual investors and builds stability in demand.
Two IRP Categories
Retail quota: 35%
NII/HNI quota: 15%
QIB quota: 50%
Oversubscription in NII and QIB is a major indicator of strength.
Listing Platform
SME companies initially list only on SME exchanges.
Migration to mainboard is possible after reaching certain thresholds.
3. Why SME IPOs Can Generate Huge Profits
Let’s break down the reasons SME IPOs outperform mainboard IPOs:
A. Low Market Cap = High Growth Headroom
SME companies usually operate with revenues of ₹10–200 crore.
Any increase in orders, capacity, or profit quickly reflects on stock price.
Example:
A ₹50 crore company that gets a ₹20 crore contract can see a massive re-rating.
B. Limited Supply of Shares
Most SME IPOs offer small issue sizes:
₹10–50 crore.
This scarcity creates strong listing demand.
C. Strong Promoter Skin-in-the-Game
Promoters in SMEs often hold 70%–80% stake even after listing, creating confidence:
They have real business incentive
They don’t dilute aggressively
They manage business directly
This often results in more predictable growth.
D. Anchor and Institutional Participation
In many recent SME IPOs:
Family offices
PMS funds
Category II AIFs
UHNI investors
buy big allocation beforehand.
This strengthens credibility and improves listing demand.
4. How to Identify High-Potential SME IPOs
Here’s a simple but powerful analysis checklist to spot upcoming multibagger SME issues.
1. Strong Financials (Revenue, PAT, Margins)
Look for:
Revenue growth: 20–40% YoY
Profit margins: 8–15%+
Low debt
Avoid companies with sudden spike in profits just before IPO — often a red flag.
2. Reasonable Valuations
Even a great business can perform poorly if priced aggressively.
Compare:
P/E ratio vs sector P/E
EV/EBITDA
Market cap vs revenue
Safer zone:
PE below 20, or discount to peers.
3. Use of IPO Proceeds
Prefer IPOs where funds are used for:
Expansion
Working capital
Technology upgrades
Debt reduction
Avoid IPOs raising money for general corporate purposes only.
4. Strong Lead Manager Track Record
Top SME merchant bankers:
Fedex
Hem Securities
Pantomath
Gretex
Swastika Investmart
Their IPOs often have stronger post-listing performance.
5. Subscription Demand
High demand indicates strong market interest.
Key benchmarks:
Retail 20x+
NII 50x+
Overall 100x+
This significantly increases listing gain probability.
5. Strategies to Earn Huge Profits from SME IPOs
Here are the top profit-making strategies smart traders use:
A. Listing Gain Strategy
This is the most popular.
Steps:
Apply for strong SME IPOs
Target 40–150% listing pop
Exit on listing day or within 1–3 days
This minimizes risk and gives quick returns.
B. Post-Listing Breakout Strategy
Some SME IPOs consolidate after listing and give massive breakouts.
Look for:
Volume breakout
Price above listing high
Strong market trend
These stocks can become 2x to 5x within months.
C. Anchor Investor Following
If large anchors participate, buying post-listing during consolidation often yields good results.
D. Sector-Based Investing
Focus on high-growth sectors:
Defence
EV manufacturing
Pharma API
Auto components
IT services
Infra and engineering
These sectors dominate SME multibagger lists.
E. Avoiding Weak SMEs
Avoid companies with:
Sudden jump in profits pre-IPO
High receivables
High debt
Related-party transactions
Filtering negatives is as important as chasing positives.
6. Risks Associated with SME IPOs (Must Know)
Even though SME IPOs offer huge profits, they also carry unique risks.
1. Low Liquidity
Post listing, many SME stocks have limited buyers/sellers.
This can create:
Sharp price swings
Difficulty in exit
2. Price Manipulation (In Some Cases)
Low float sometimes attracts speculative operators.
Hence, due diligence is crucial.
3. High Lot Size = High Capital Requirement
You must invest ₹1–3 lakh minimum — increases risk exposure.
4. Limited Historical Data
Many SMEs are young companies without long-term financial history.
7. How to Participate Smartly — Practical Roadmap
Follow this step-by-step success system:
Step 1: Track Upcoming SME IPOs
Use sources:
Exchange websites, IPO blogs, SEBI filings.
Step 2: Apply Only for High-Quality IPOs
Use the 5-point checklist above.
Step 3: Play for Listing Gains in Over-Subscribed Issues
If NII crosses 100x, listing gains are almost guaranteed.
Step 4: Avoid Greed — Book Profits
SME stocks can crash after hype fades.
Step 5: For Long-Term, Pick Only Fundamentally Strong SMEs
Companies with clear growth path can deliver 5x–10x returns.
8. The Future of SME IPOs in India
The SME IPO market is expected to grow dramatically due to:
Government MSME support
Manufacturing boom
Retail investor participation
Better regulations
Strong Indian economy
This segment may produce the next wave of midcap multibaggers.
Conclusion
SME IPOs in India are no longer a hidden corner of the stock market — they are now a powerful wealth-building platform. With strong oversubscriptions, attractive valuations, and booming investor interest, they offer excellent opportunities for huge profits.
However, success requires smart filtering, disciplined strategy, risk management, and knowledge of SME dynamics.
If approached correctly, SME IPOs can be one of the most rewarding segments for modern Indian investors.
Trading Psychology – The Mental Edge of Successful Traders1. Why Trading Psychology Matters More Than Strategy
A trading strategy is important, but even the best strategy can fail if the trader cannot execute it with discipline.
For example:
A trader may exit too early due to fear.
A trader may hold losing positions due to hope.
A trader may overtrade due to greed or excitement.
A trader may avoid taking trades due to hesitation after losses.
These behaviors have nothing to do with strategy—they are psychological errors. Markets reward logic, not emotions. Thus, mastering psychology is just as important as mastering technical or fundamental analysis.
2. Key Emotional Challenges in Trading
a) Fear
Fear comes in different forms:
Fear of losing money
Fear of missing out (FOMO)
Fear of being wrong
Fear often pushes traders into irrational actions such as not pulling the trigger on a valid setup, placing too tight stop-losses, or chasing the market impulsively.
b) Greed
Greed leads to:
Overtrading
Holding winners too long
Trading oversized positions
Gambling instead of following rules
Greed makes traders believe they can earn more with one big trade, which usually leads to disaster.
c) Overconfidence
After a few winning trades, many traders feel invincible. This leads to:
Ignoring risk management
Taking bigger risks
Abandoning the trading plan
Overconfidence breaks discipline faster than losses.
d) Revenge Trading
Revenge trading happens when a trader tries to recover losses immediately. This emotional state leads to:
Quick, irrational trades
Ignoring setups
Emotional overreaction
Revenge trading is one of the biggest reasons for heavy losses.
e) Impatience
Trading requires waiting for the perfect setup. Many traders:
Enter too early
Exit too early
Switch strategies too often
Impatience destroys consistency.
3. Core Psychological Traits of Successful Traders
a) Discipline
The ability to follow the trading plan strictly.
Discipline prevents impulsive decisions, ensuring consistent behavior regardless of market conditions.
b) Patience
Great traders wait for the market to come to them. They do not chase trades; they choose trades.
c) Confidence
Confidence is not arrogance.
It is the belief in your strategy and ability, built through backtesting, journaling, and experience.
d) Emotional Control
Successful traders are calm during profit and loss.
They understand that:
“One trade does not decide the journey.”
Thus, emotions never control their decisions.
e) Adaptability
Markets constantly change. A strong trading psychology enables traders to adapt without panic or frustration.
4. Psychological Principles for Better Trading
a) Think in Probabilities
Trading is like poker or sports betting—nothing is guaranteed.
Winning traders think in terms of:
Win rate
Reward-to-risk
Long-term edge
They do not expect every trade to win.
b) Accept Losses as Part of the Game
Losses are not failures—they are expenses.
Just like a business has costs, trading has losing trades.
Accepting losses reduces fear and prevents emotional decisions.
c) Process Over Outcome
Focusing only on profit leads to stress and mistakes.
Successful traders focus on:
Following the plan
Managing risk
Executing flawlessly
The outcome naturally improves.
5. The Psychology Behind Market Movements
Markets are driven by collective emotions:
Fear
Greed
Panic
Hope
Euphoria
Understanding these crowd behaviors helps traders
ride trends
avoid traps
identify market reversals
A trader who understands human behavior has a huge edge.
6. How to Build Strong Trading Psychology
a) Create a Clear Trading Plan
A plan should include:
Entry rules
Exit rules
Stop-loss and target rules
Risk per trade
Timeframes and setups
A strong plan removes emotional thinking.
b) Use Strict Risk Management
Risk management reduces emotional pressure.
If you risk only 1% per trade:
fear decreases
losses become manageable
confidence increases
Small, controlled losses reduce emotional damage.
c) Keep a Trading Journal
Journaling helps identify:
emotional mistakes
good trades
bad habits
areas to improve
It is the most powerful tool for psychological growth.
d) Practice Mindfulness and Emotional Awareness
Mindfulness helps you remain aware of:
fear
greed
stress
impulsive urges
It encourages rational thinking under pressure.
e) Backtest and Build Confidence
Backtesting proves your strategy works.
When you trust the system, you stop doubting and stop making emotional decisions.
7. Common Psychological Mistakes Traders Make
Expecting quick results
Trading success takes years of practice.
Relying on instinct instead of rules
The market punishes emotional guesses.
Changing strategies often
Inconsistency destroys psychological stability.
Taking trades to “prove” something
Trading is not about ego; it’s about probabilities.
Ignoring mental health
Stress, burnout, and fatigue lead to poor decisions.
8. Developing a “Professional Trader Mindset”
Professional traders think differently from beginners.
Pros focus on risk; beginners focus on profit.
Professionals ask:
“How much can I lose?”
Beginners ask:
“How much can I make?”
Pros follow systems; beginners follow emotions.
Pros accept uncertainty; beginners look for certainty.
Pros treat trading as a business; beginners treat it as gambling.
Shifting to a professional mindset requires consistent practice and emotional maturity.
9. The Role of Habits and Lifestyle in Trading Psychology
Your lifestyle impacts your mental state.
Healthy traders:
sleep well
exercise
maintain routines
avoid trading during emotional stress
take breaks after big wins or losses
A disciplined life encourages disciplined trading.
10. Final Thoughts: Master Your Mind, Master the Market
Trading psychology is the foundation of long-term trading success.
You can have:
the perfect indicator
advanced strategies
great market knowledge
But without emotional control, you will struggle.
The true trader’s journey is about mastering:
mindset
discipline
patience
acceptance
self-awareness
Once you understand your emotions and behavior, the market becomes much easier to navigate.

Options Trading & Greeks1. What Are Options?
Options are derivative contracts that give traders the right, but not the obligation, to buy or sell an asset (like stocks, indices, commodities, or currencies) at a preset price (strike price) within a specific period.
There are two major types:
1. Call Option
Gives the buyer the right to buy the underlying asset at the strike price.
Call Buyer → Bullish
Call Seller → Bearish
2. Put Option
Gives the buyer the right to sell the underlying asset at the strike price.
Put Buyer → Bearish
Put Seller → Bullish
Options can be bought or sold, creating four basic positions:
Long Call
Short Call
Long Put
Short Put
From these, traders build advanced strategies such as spreads, straddles, strangles, condors, butterflies, etc.
2. Why Trade Options?
Options offer benefits that stocks cannot:
1. Leverage
Small capital can control a large position.
2. Hedging
Protect your portfolio against downside risk (e.g., buying Puts).
3. Income Generation
Sell options regularly (like Covered Calls, Cash Secure Puts).
4. Flexibility & Strategy
Strategies exist for every type of market — trending, sideways, volatile, or low-volatility.
3. How Option Prices Are Determined
An option’s premium is influenced by:
Underlying Asset Price
Strike Price
Time to Expiry
Volatility
Interest Rates
Dividends
All these factors interact continuously and cause option premiums to fluctuate. Traders use Option Greeks to measure these changes and manage risk.
4. Introduction to Option Greeks
Greeks measure the sensitivity of an option’s price to various market factors. Think of them as tools that let you understand:
How much premium will change if price changes
How fast time decay will erode value
How volatility impacts premium
How the option behaves near expiry
The 5 major Greeks are:
Delta
Theta
Vega
Gamma
Rho
Let’s explore each in detail.
5. Delta – The Price Sensitivity Greek
Delta measures how much an option’s premium will change if the underlying price moves by ₹1.
Example:
If a Call option has Delta = 0.60
→ A ₹1 rise in the stock increases the premium by ₹0.60
Interpretation:
Call Delta: 0 to 1
Put Delta: -1 to 0
ATM options → around 0.50
ITM options → higher Delta (~0.70 to 0.90)
OTM options → lower Delta (~0.10 to 0.30)
Uses of Delta:
Predicting premium movements
Position sizing in options (Delta exposure)
Hedging (Delta neutral strategies)
As expiry approaches, Delta of ATM options moves sharply toward 1 or 0.
6. Gamma – The Acceleration Greek
Gamma measures how much Delta will change if the underlying asset moves by ₹1.
If Delta is the speed of movement, Gamma is the acceleration.
Importance:
Tells how unstable or stable your Delta is
ATM options have highest Gamma
Near expiry, Gamma becomes extremely high → risky
Why Traders Watch Gamma:
High Gamma = fast change in Delta → rapid premium movement
Option sellers fear high Gamma because small price moves can cause big losses
Gamma helps traders avoid selling risky options near expiry.
7. Theta – The Time Decay Greek
Theta measures how much an option loses in value every day due to time decay.
Options are wasting assets — they lose value as expiry approaches.
Example:
Theta = -6
→ The option loses ₹6 in premium each day (all else constant)
Key Points:
Theta is negative for option buyers
Theta is positive for option sellers
ATM options lose value fastest
Time decay accelerates in the last 10–15 days of expiry
Why Theta Matters:
Option sellers (writers) love Theta because they profit from time decay.
Option buyers must overcome Theta loss through strong directional moves.
8. Vega – The Volatility Greek
Vega measures how sensitive an option’s price is to changes in volatility.
Volatility is the heartbeat of options pricing. When volatility rises, options become more expensive.
Example:
Vega = 10
→ If IV increases by 1%, premium increases by ₹10
Volatility Impact:
High IV → expensive options
Low IV → cheap options
Vega Behaviors:
Highest for ATM options
Falls sharply near expiry
Impacts long-term options (LEAPS) more than short-term
Why Vega Matters:
Traders use Vega to:
Trade earnings announcements
Trade events (Union Budget, Fed decisions)
Avoid buying overpriced options
Take advantage of IV crush
9. Rho – The Interest Rate Greek
Rho measures sensitivity to changes in interest rates.
Example:
Rho = 5
→ a 1% rise in interest rates increases the premium by ₹5
Rho impacts:
Long-term options
Index options (slightly)
Hardly affects short-term equity options
It is the least important Greek for day-to-day trading but relevant for long-duration positions.
10. How Greeks Work Together
Greeks never work alone. They influence each other and create the real behavior of an option.
Example:
A high Delta ITM option also has low Gamma
An ATM option has high Gamma, high Vega, and high Theta
An OTM option has low Delta, low Gamma, and low Theta
Understanding these relationships helps you choose the right strike and expiry.
11. Practical Applications of Greeks
1. Directional Trading (Delta-based)
Choose high Delta options for directional moves.
Avoid low Delta (far OTM) options → high probability of decay.
2. Income Strategies (Theta-based)
Short Strangles, Iron Condors, Credit Spreads
→ Earn from time decay + low movement
3. Volatility Trading (Vega-based)
Trade before major events (high IV) and exit after IV crush.
4. Risk Management (Gamma-control)
Avoid selling naked ATM options near expiry due to high Gamma risk.
12. Greeks by Different Market Phases
Trending Market
Delta is most important
Use low Gamma (ITM options) for stability
Sideways Market
Theta becomes dominant
Use option selling strategies
High-Volatility Market
Vega spikes → options overpriced
Prefer selling IV (credit spreads, straddles)
Expiry Day
Gamma risk highest
Only experienced traders should trade
Theta is maximum (rapid decay)
13. Why Greeks Matter More in Indian Markets
India’s option market (specially Nifty and BankNifty) is:
Volatile
High participation
Weekly expiries
Strong intraday moves
This makes Greeks extremely important. A 20–50 point move in Nifty can drastically change Delta, Gamma, and Theta. Traders who understand Greeks avoid emotional trading and make data-driven decisions.
14. Conclusion
Options trading is not just about prediction — it is about understanding the forces that shape option prices. Greeks are your tools to measure:
Directional risk (Delta)
Acceleration risk (Gamma)
Time decay (Theta)
Volatility risk (Vega)
Interest rate sensitivity (Rho)
Mastering Greeks helps you:
Select the right strike
Choose the right expiry
Control losses
Optimize returns
Build safe strategies
Trade confidently
Whether you are a beginner looking to understand basics or an intermediate trader trying to refine strategies, knowing Greeks will transform your options trading journey.

Price Action Trading1. What is Price Action Trading?
Price action trading is the analysis of raw price movement on a chart. It involves studying candlestick patterns, support and resistance zones, trendlines, breakouts, volume behavior, and the psychology behind market participants’ actions. Instead of using lagging indicators, price action traders focus on:
Higher highs and higher lows
Support and resistance
Market structure
Trend strength
Candle patterns
Order flow concepts
Because price is immediate and reflects the most recent market decisions, price action helps traders stay aligned with real-time sentiment and avoids the delays of indicators.
2. Why Price Action Works
Price action works because it is rooted in the core principle of markets:
All buying and selling decisions are reflected in price.
Every candlestick tells a story:
A long wick shows rejection.
A big body shows strength.
A small range candle shows indecision.
A breakout candle signals aggression.
Unlike indicator-based trading, price action teaches traders to understand why something is happening, not just what is happening. This deeper understanding is why professional traders and institutional players rely heavily on price action.
3. Core Components of Price Action Trading
(A) Market Structure
Market structure is the backbone of price action. It tells you whether the market is trending, consolidating, or reversing.
Uptrend:
Higher Highs (HH)
Higher Lows (HL)
Downtrend:
Lower Highs (LH)
Lower Lows (LL)
Range:
Horizontal support and resistance
Equal highs and equal lows
Once you know the structure, you know the bias.
(B) Support and Resistance (S/R)
Support and Resistance are areas where price reacts repeatedly because buyers or sellers defend those levels. They are widely used in price action trading.
Support: A level where buying pressure exceeds selling pressure.
Resistance: A level where selling pressure exceeds buying pressure.
The strongest S/R zones have:
Multiple touches
Volume confirmation
Trend alignment
Psychological round numbers (like 100, 500, 1000)
(C) Candlestick Patterns
Candlesticks reflect market psychology and reveal what buyers and sellers are doing.
Key price action patterns include:
Pin Bar (Hammer / Shooting Star) – Strong rejection
Engulfing Pattern – Trend reversals or continuation
Inside Bar – Low volatility → breakout setup
Doji – Indecision
Marubozu – Strong directional momentum
Candlesticks are tools for confirming entries and exits.
(D) Breakouts and Fakeouts
Price often breaks above or below important levels. But not all breakouts sustain. Many fail — known as fakeouts.
A good price action trader learns to differentiate between:
True breakout: High volume, strong candle body, retest
False breakout: Wick break, low volume, immediate reversal
Fakeout trading is one of the most profitable techniques when mastered.
(E) Trendlines and Channels
Trendlines help visualize structure and momentum. Two or more touches create a valid trendline.
Channels (rising or falling) help traders locate:
Buying opportunities at lower boundary
Selling opportunities at upper boundary
Breakouts at structure collapse
Trendlines enhance clarity in volatile markets.
4. Price Action Entry Techniques
There are several reliable entry models:
(A) Breakout Entry
Traders enter when price breaks a major level:
Resistance breakout → Buy
Support breakout → Sell
Strong breakout confirmation includes:
Big-bodied candle
Volume increase
Retest of level
(B) Pullback Entry
This is the most common entry for professional traders.
Steps:
Identify trend
Wait for correction
Look for price action signal
Enter with trend continuation
Pullback entries offer high reward-to-risk ratios.
(C) Reversal Entry
Used at key S/R zones.
Signals include:
Pin Bar at resistance
Engulfing candle at support
Divergence between price and momentum
Reversal entries require patience and confirmation.
5. Price Action Exit Strategies
(A) Fixed Target Exit
Based on S/R levels, Fibonacci targets, or ATR projections.
(B) Trailing Stop Exit
Use structure-based trailing:
Swing high/lows
Trendline breaks
Moving average (optional)
(C) Partial Profit Booking
Sell half at first target, trail rest.
This reduces risk and increases consistency.
6. Risk Management in Price Action Trading
Risk management is inseparable from price action.
Key principles:
Risk 1–2% per trade
Use stop loss below/above structure
Never chase trades
Avoid overtrading
Trade high-probability zones
Maintain minimum 1:2 or 1:3 RR
Price action is powerful, but without risk control, even the best trades can fail.
7. Psychological Aspect of Price Action
Price action exposes traders to raw market volatility, so emotional discipline is essential.
Key psychological principles:
Stick to your plan
Don’t interpret noise as signals
Trust structure and patterns
Accept losing trades
Stay unbiased—trade what the chart shows
Avoid revenge trades
Markets reward disciplined behavior more than aggressive behavior.
8. Major Price Action Strategies
(A) Trend Following Strategy
Identify trend
Buy pullbacks in uptrend
Sell pullbacks in downtrend
Confirm with candle patterns
This is the most reliable and beginner-friendly approach.
(B) Reversal Trading Strategy
Look for reversal patterns at major S/R levels:
Pin bar reversal
Double top/bottom
Head and shoulders
Engulfing reversal
Reversal trading offers high RR but requires experience.
(C) Breakout and Retest Strategy
One of the cleanest setups:
Price breaks a strong level
Comes back to retest
Forms a bullish/bearish signal
Enter towards breakout direction
Institutional traders commonly use this.
(D) Range Trading Strategy
In a sideways market:
Buy support
Sell resistance
Wait for breakout to stop range trading
Ranges are predictable and profitable for price action traders.
9. Advantages of Price Action Trading
Works on all markets and timeframes
No dependency on indicators
Quick decision-making
Clears chart from clutter
Aligns with institutional trading
Easy to learn but deep to master
Works even in low-volume markets
10. Limitations of Price Action Trading
Requires screen time and practice
Highly subjective
Can generate false signals in choppy markets
Emotional discipline needed
News events can disrupt structure
Price action is powerful, but traders must combine it with risk management and emotional control.
Conclusion
Price Action Trading is a complete trading ecosystem—focused on understanding how price behaves, how market participants react, and how to trade based on pure market psychology. It eliminates reliance on lagging indicators and teaches traders to interpret structure, trends, reversals, breakouts, and raw candlestick signals. With practice, traders using price action gain clarity, develop confidence, and improve consistency across all market conditions.
