Part 5 Advance Option Trading Option Seller (Short Option)
Advantages:
Benefits from time decay
Higher probability of profit
Works well in sideways markets
Disadvantages:
Unlimited or very high risk
Requires margin
Risk increases sharply during volatility spikes
Trendlineanalysis

HINDCOPPER 1 Week VIew 📊 Current Price Snapshot
Live/Recent price: ~₹535–₹538 per share on NSE for this week.
52-week range: Low ~₹183.8 — High ~₹576.0; stock remains elevated near recent multi-week highs.
📈 Short-Term Resistance Levels (1-Week View)
These are the price zones where the stock may find selling pressure or pause its upside:
• Immediate Resistance: ~₹550–₹551 — first hurdle this week.
• Next Resistance: ~₹564–₹565 — pivot/resistance area seen on pivot calculations.
• Higher Resistance / Near-term Target: ~₹573–₹578 — extended resistance zone above.
Bullish scenario (this week):
A sustained move above ~₹550–₹565 could open room for tests of the ₹573–₹578 zone.
📉 Short-Term Support Levels (1-Week View)
• Immediate Support: ~₹526–₹527 — first near-term floor.
• Secondary Support: ~₹518–₹520 — next demand zone if price weakens.
• Deeper Short-Term Support: ~₹503–₹505 — more structural support on pullbacks.
Bearish scenario (this week):
A break and close below ~₹518–₹520 on a weekly basis may put pressure on the trend and open tests toward the deeper support band near ₹503–₹505.
📅 Weekly Strategy Levels (Summary)
Level Type Price Area (₹)
Immediate Resistance 550–551
Next Resistance 564–565
Extended Resistance 573–578
Immediate Support 526–527
Secondary Support 518–520
Deeper Support 503–505

APLAPOLLO 1 Week View🔎 Current Price Snapshot
🟢 Last close: ₹2,000.10 (23 Jan 2026) — near a 52-week high zone.
📉 Weekly Technical Levels (1-Week Time Frame)
🧱 Support Levels (Key Floors)
These are levels where price is likely to find buying interest if the price pulls back:
S1: ~₹1,913 – ₹1,926 — first strong support band.
S2: ~₹1,890 – ₹1,911 — secondary support base from pivot structure.
S3: ~₹1,850+ — deeper support from broader weekly structure and previous pivot base.
Note: Above ~₹1,890 zone is a key defence level in weekly charts — losing this could signal short-term weakness.
📈 Resistance Levels (Key Ceilings)
These are weekly upside barriers where price may struggle initially:
R1: ~₹2,011 – ₹2,050 — first resistance cluster from weekly pivots.
R2: ~₹2,080 – ₹2,100 — next overhead resistance from extended levels.
R3: ~₹2,128 – ₹2,140+ — broader technical pivot resistance.
Bullish bias continues only above ~₹2,011–₹2,050.
📌 Weekly Trading Scenarios
🟢 Bullish Case (Upside)
Trigger: Sustained weekly close above ~₹2,011–₹2,050
Targets:
→ Short-term: ~₹2,080–₹2,100
→ Extended: ~₹2,120–₹2,140+
Outlook: Strength above R1 opens path to higher weekly highs.
🔵 Neutral / Range
Range: ₹1,890–₹2,050
Behavior: Price oscillates as buyers/sellers balance.
🔴 Bearish Case (Downside)
Trigger: Weekly close below ~₹1,890
Downside key support: ~₹1,850+
Outlook: Weekly momentum weakens if key support breaks.

GARUDA 1 Day View📌 Current Daily Price Snapshot
Garuda Construction & Engineering Ltd. (GARUDA)
📅 Last Trading Session (23 Jan 2026)
• Last Close: ₹159.28 on NSE/BSE (down ~-6.37% on the day).
• Day’s Range: Approx ₹157.00 – ₹173.40.
• 52-Week Range: ₹87.50 – ₹249.30.
(This is the most recent full day’s market price data available.)
📊 Daily (1D) Support & Resistance Levels
These levels help track where price might react today or in upcoming sessions:
🔹 Pivot-based Levels (Approx. Current Daily)
• Resistance 3 (R3): ~₹185.85
• Resistance 2 (R2): ~₹179.63
• Resistance 1 (R1): ~₹169.45
• Pivot: ~₹163.23
• Support 1 (S1): ~₹153.05
• Support 2 (S2): ~₹146.83
• Support 3 (S3): ~₹136.65
📌 These pivot levels are updated with the latest trading session price action.
📈 How Traders Typically Use This
🔸 Bullish scenario (reversal): Price > ₹169 would target R2 ~₹180 and then R3 ~₹185.
🔹 Neutral/Consolidation: Tight range between ₹153–₹169.
🔻 Bearish scenario: Break below ₹153 could lead to deeper support near ₹146 and ₹136.

Intraday Institutions Trading Option Pricing – How Premium Moves
Factors affecting premium
Underlying price movement.
Volatility levels (IV).
Time remaining for expiry.
Demand–supply and liquidity.
Strike price distance from spot.
How premium reacts
If underlying moves towards strike → premium increases.
If underlying moves away from strike → premium decreases.
Sharp move + low IV = huge premium expansion.
Sideways market = premium decay.
Before major events = IV rise → premium rise.
After events = IV crush → premium collapse.

Part 1 Techical Analysis Vs. Institutional Option Trading Types of Options
A. Call Option (CE)
You buy CE when you expect price to go up.
You sell CE (write CE) when you expect price to stay below the strike or fall.
If market goes up strongly: CE buyers make big profits.
If market stays sideways: CE sellers profit due to premium decay.
B. Put Option (PE)
You buy PE when you expect price to go down.
You sell PE when you expect price to stay above the strike.
PE buyers profit from downside momentum.
PE sellers profit during sideways or uptrending markets.

Part 1 Support and Resistance Introduction to Option Trading
Option trading is a part of the derivatives market where traders buy and sell contracts whose value is derived from an underlying asset like Nifty, BankNifty, stocks, FINNIFTY, SENSEX, commodities, currency, etc.
Unlike equity trading, where you buy shares directly, in options you buy rights (not obligations) to buy or sell the underlying asset at a fixed price.
This fixed price is called the Strike Price.
The unique thing about option trading is that your risk can be limited while your profit potential can be unlimited, especially when buying options.
Options are used by retail traders, big institutions, hedge funds, FIIs, HNIs, and even companies to hedge and speculate.
The attractive part of option trading is the leverage—small premium can control large value of underlying.
But leverage is a double-edged sword; wrong decisions can result in rapid premium decay.
Options can be traded in two ways: buying options or selling/writing options.
Option trading involves understanding price action, sentiment, volatility, open interest, volume, structure, and momentum.
It is one of the most powerful instruments for intraday, swing, positional, and hedged strategies.

Nifty 50 1 Month Time Frame 📊 Live Price & Performance (1 Month)
Nifty 50 Index: 25,048.65 (close on 23 Jan 2026)
• Declined ~‑4.3% over the past month.
• 1‑month high ~26,373 / low ~24,919.
📈 Key 1‑Month Technical Levels
🎯 Resistance (Upside)
1. 26,000 – 26,100 — Immediate resistance zone where supply likely increases and prior range top is placed.
2. ~26,300 — 1‑month swing high / recent high area.
Breaking above 26,100–26,300 with momentum would signal a stronger upside breakout.
🛡️ Support (Downside)
1. 25,600 – 25,700 — Key short‑term support cluster (holds medium‑term bullish bias if above this).
2. ~25,000 — Psychological and technical support level (also near recent lows).
3. 24,900 – 24,800 — Lower demand zone from recent 1‑month range.
A breakdown below 25,000 could accelerate downside, while holding above 25,600‑25,700 keeps bulls in control.
📌 What to Watch Next
Bullish breakout trigger: Close above 26,100–26,300.
Bearish catalyst: Sustained move below 25,000.
Neutral/sideways trade: Oscillation between 25,000 and 26,100.

Exploring Financial Market Roles in Trading1. Investors
Investors are participants who allocate capital with the primary objective of long-term wealth creation. They include individuals, mutual funds, pension funds, insurance companies, and sovereign wealth funds. Investors typically focus on fundamentals such as earnings growth, economic trends, interest rates, and corporate governance. Their trades provide long-term stability to markets and form the backbone of capital formation. By investing in equities and debt instruments, they help companies raise funds for expansion and governments finance public spending. Although investors trade less frequently than speculators, their large capital base significantly influences market direction and valuation levels.
2. Traders and Speculators
Traders and speculators are more active market participants who seek to profit from short- to medium-term price movements. They include day traders, swing traders, proprietary trading firms, and hedge funds. Unlike investors, traders rely heavily on technical analysis, market sentiment, order flow, and short-term news. Their presence increases market liquidity and narrows bid-ask spreads, making it easier for other participants to enter and exit positions. Speculators also contribute to efficient price discovery by rapidly incorporating new information into market prices, even though they are often perceived as risk-takers.
3. Market Makers
Market makers play a crucial role in ensuring continuous trading in financial markets. They quote both buy (bid) and sell (ask) prices for specific securities and are willing to transact at those prices. By doing so, they provide liquidity and reduce price volatility, especially during periods of low trading activity. Market makers earn profits through the bid-ask spread and, in some cases, incentives provided by exchanges. In modern electronic markets, high-frequency trading firms often act as market makers, using algorithms to manage inventory and risk efficiently.
4. Brokers and Intermediaries
Brokers act as intermediaries between buyers and sellers. They execute trades on behalf of clients and provide access to exchanges and trading platforms. Full-service brokers may also offer research, investment advice, and portfolio management, while discount brokers focus primarily on trade execution at lower costs. Intermediaries reduce information asymmetry, simplify market access for retail participants, and ensure compliance with trading rules. In today’s digital era, online brokerages and trading apps have significantly expanded retail participation in financial markets.
5. Exchanges and Trading Platforms
Exchanges provide the organized infrastructure where trading takes place. They establish rules, ensure transparency, and maintain fair and orderly markets. Examples include stock exchanges, commodity exchanges, and derivative exchanges. Exchanges facilitate price discovery by matching buy and sell orders and disseminating real-time market data. With the rise of electronic trading, alternative trading systems and dark pools have also emerged, offering participants different ways to execute large orders with minimal market impact.
6. Regulators and Policymakers
Regulators and policymakers oversee financial markets to ensure integrity, stability, and investor protection. Their role includes setting trading rules, monitoring market behavior, preventing fraud and manipulation, and managing systemic risk. By enforcing disclosure standards and capital requirements, regulators enhance trust in the trading environment. Stable and transparent regulatory frameworks encourage participation from domestic and international investors, which ultimately supports market growth and efficiency.
7. Clearing Houses and Settlement Institutions
Clearing houses and settlement institutions operate behind the scenes but are vital to the trading process. They act as central counterparties, guaranteeing the completion of trades even if one party defaults. By managing margin requirements and settlement processes, they reduce counterparty risk and enhance market confidence. Efficient clearing and settlement systems are especially important in derivative and high-volume markets, where risk exposure can be significant.
8. Hedgers and Risk Managers
Hedgers participate in financial markets to reduce exposure to adverse price movements. These include corporations, exporters, importers, farmers, and financial institutions. By using derivatives such as futures, options, and swaps, hedgers transfer risk to speculators willing to bear it. This risk-sharing function is fundamental to the smooth functioning of markets, as it allows businesses to focus on core operations while managing financial uncertainty.
9. Information Providers and Analysts
Information providers, research analysts, and rating agencies influence trading decisions by supplying data, analysis, and forecasts. Their insights help market participants assess value, risk, and future prospects. Timely and accurate information enhances market efficiency, while poor or biased information can lead to mispricing and volatility. In the age of digital trading, real-time data feeds and algorithmic analysis play an increasingly important role.
Conclusion
The financial market is a dynamic system driven by the interaction of diverse participants, each performing a specialized role in the trading process. Investors provide long-term capital, traders enhance liquidity, market makers ensure smooth execution, and regulators maintain market integrity. Together with brokers, exchanges, clearing institutions, hedgers, and information providers, these roles create a balanced ecosystem that supports efficient trading and economic growth. For anyone involved in trading, understanding these market roles is not just academic—it is essential for making informed decisions, managing risk, and navigating the ever-evolving financial landscape.

Part 5 Advance Trading Strategies Option Trading in Different Market Conditions
A. Trending Market
Buyers get benefit
CE/PE give good returns
B. Sideways Market
Sellers benefit
Strangles, straddles perform well
C. High Volatility
Premium expands
Good for selling post-news
D. Low Volatility
Cheap premiums
Good for buying before breakout

Option Trading Strategies1. Covered Call – Best for Conservative Income Traders
Market view: Neutral to mildly bullish
Risk level: Low
Who it’s for: Long-term investors, swing traders, income seekers
A covered call involves owning the underlying stock and selling a call option against it. You earn option premium as income while holding the stock.
How it works:
Buy or hold shares
Sell an out-of-the-money (OTM) call
If price stays below strike → keep premium
If price rises above strike → shares get called away at a profit
Why it’s powerful:
Generates regular income
Lowers cost basis of stock
Works well in sideways markets
Risk: Limited upside if stock rallies strongly
Best use: Stable stocks, index ETFs (NIFTYBEES, BANKBEES)
2. Cash-Secured Put – Smart Way to Buy Stocks Lower
Market view: Neutral to bullish
Risk level: Low to moderate
Who it’s for: Investors who want to accumulate stocks
Here, you sell a put option while keeping enough cash to buy the stock if assigned.
How it works:
Sell OTM put
Collect premium
If price stays above strike → profit = premium
If price falls → you buy stock at lower effective price
Why traders love it:
You get paid to wait
Safer than blindly buying dips
Works best in high-IV markets
Risk: Downside if stock collapses
Best use: Quality stocks you actually want to own
3. Long Call – High Conviction Bullish Strategy
Market view: Strongly bullish
Risk level: Moderate
Who it’s for: Momentum traders, event traders
A long call gives you the right (not obligation) to buy at a fixed price.
How it works:
Buy call option
Risk limited to premium
Upside theoretically unlimited
Why it works:
Leverage with defined risk
Best during breakouts, earnings, trend reversals
Key risk: Time decay (theta)
Tip: Use when direction + timing are both strong
4. Long Put – Best for Market Crashes & Hedging
Market view: Strongly bearish
Risk level: Moderate
Who it’s for: Hedgers, short-term traders
A long put profits when prices fall.
Why it’s important:
Portfolio insurance during crashes
Explosive profits in sharp sell-offs
Risk: Option expires worthless if market doesn’t fall
Best use: Breakdowns, global risk-off events, earnings disappointments
5. Bull Call Spread – Controlled Bullish Strategy
Market view: Moderately bullish
Risk level: Lower than long call
Who it’s for: Risk-aware traders
This involves:
Buying one call
Selling a higher strike call
Why it’s smart:
Lower cost than buying naked call
Defined risk and reward
Less affected by time decay
Downside: Limited profit
Best use: When you expect a limited upward move
6. Bear Put Spread – Structured Bearish Play
Market view: Moderately bearish
Risk level: Controlled
Who it’s for: Traders expecting slow declines
Similar to bull spread but on the downside.
Advantages:
Cheaper than long put
Reduced volatility risk
Better probability of success
Best use: Gradual downtrends, resistance breakdowns
7. Iron Condor – Best Sideways Market Strategy
Market view: Range-bound
Risk level: Moderate (defined)
Who it’s for: Experienced income traders
Iron condor combines:
Bull put spread
Bear call spread
Goal: Profit from time decay and low volatility
Why it’s popular:
High probability
Works well in indices
Non-directional
Risk: Big moves beyond range
Best use: Low-IV environments before expiry
8. Short Straddle / Strangle – Volatility Selling Strategy
Market view: Low volatility expected
Risk level: High
Who it’s for: Advanced traders only
You sell:
Straddle → ATM call + put
Strangle → OTM call + put
Profit comes from:
Time decay
Volatility crush
Major risk: Unlimited losses if market explodes
Best use: Indices with strict risk management (hedges mandatory)
9. Calendar Spread – Time Decay Exploitation
Market view: Neutral to mildly directional
Risk level: Moderate
Who it’s for: Volatility traders
You sell a near-expiry option and buy a far-expiry option at same strike.
Why it works:
Front-month options decay faster
Gains from IV expansion
Best use: Pre-event, slow-moving stocks
10. Protective Put – Portfolio Insurance Strategy
Market view: Long-term bullish, short-term uncertain
Risk level: Low
Who it’s for: Investors protecting large portfolios
How it works:
Hold stock
Buy put option
Benefit:
Caps downside risk
Allows peace of mind during volatility
Cost: Insurance premium
Best use: Elections, Fed meetings, earnings seasons
Final Thoughts: Which Strategy Is “Best”?
There is no single best option strategy—only the right strategy for the right market condition.
Market Condition Best Strategies
Strong bullish Long Call, Bull Call Spread
Mild bullish Covered Call, Cash-Secured Put
Sideways Iron Condor, Calendar Spread
Bearish Long Put, Bear Put Spread
High volatility Debit spreads
Low volatility Credit spreads, Condors
Professional option traders focus on:
Probability
Risk control
Volatility, not just direction

Renewable Energy Certificates (RECs) and Carbon Credits1. Introduction: Why RECs and Carbon Credits Matter
As countries, corporations, and investors push toward net-zero emissions, two market-based instruments have become central to climate policy and sustainable finance: Renewable Energy Certificates (RECs) and Carbon Credits.
Both aim to reduce greenhouse gas (GHG) emissions, but they operate in different markets, address different problems, and serve different compliance and voluntary needs. Understanding their structure, pricing, and role is critical for policymakers, power producers, corporates, and traders—especially in fast-growing markets like India.
2. Renewable Energy Certificates (RECs): Core Concept
A Renewable Energy Certificate (REC) represents proof that 1 megawatt-hour (MWh) of electricity has been generated from a renewable energy source such as solar, wind, hydro, biomass, or geothermal.
When a renewable power producer generates electricity:
The physical electricity flows into the grid
The environmental attribute is unbundled and issued as a REC
This separation allows electricity consumers to claim renewable usage even if the physical power they consume is from the conventional grid mix.
3. Purpose of RECs
The primary objectives of RECs are:
Regulatory Compliance
In many countries, utilities and large power consumers must meet Renewable Purchase Obligations (RPOs). RECs allow entities that cannot physically procure green power to meet these obligations financially.
Market-Based Incentives
RECs provide additional revenue to renewable generators, improving project viability without direct subsidies.
Corporate Sustainability Claims
Corporates use RECs to meet ESG targets, claim renewable sourcing, and comply with Scope 2 emission accounting under GHG Protocols.
4. REC Markets: Compliance vs Voluntary
Compliance REC Markets
Mandated by government regulation
Prices often volatile and policy-driven
Examples:
India (Solar & Non-Solar RECs)
US state-level Renewable Portfolio Standards (RPS)
Voluntary REC Markets
Purchased by corporates or individuals
Focus on brand value, ESG disclosure, and carbon neutrality
Examples:
International Renewable Energy Certificates (I-RECs)
Guarantees of Origin (EU)
5. India’s REC Framework
India’s REC mechanism is overseen by CERC and operated via power exchanges like IEX and PXIL.
Key features:
Solar RECs and Non-Solar RECs
Issued by the National Load Despatch Centre (NLDC)
Traded through exchange-based auctions
Used for RPO compliance by DISCOMs, open-access consumers, and captive users
India’s REC prices have historically been:
Highly cyclical
Influenced by RPO enforcement
Sensitive to supply-demand mismatches
6. Carbon Credits: Core Concept
A Carbon Credit represents the reduction or removal of 1 metric tonne of CO₂ equivalent (tCO₂e) from the atmosphere.
Unlike RECs (which are linked to energy generation), carbon credits are linked directly to emission reductions, regardless of the sector.
Carbon credits are generated through projects such as:
Renewable energy installations
Afforestation and reforestation
Methane capture
Energy efficiency upgrades
Industrial process improvements
7. Carbon Markets: Compliance vs Voluntary
Compliance Carbon Markets
Created under international or national regulation.
Examples:
EU Emissions Trading System (EU ETS)
China National ETS
California Cap-and-Trade
Key traits:
Mandatory caps on emissions
Allowances traded among regulated entities
Prices often reflect marginal abatement cost
Voluntary Carbon Markets (VCM)
Used by corporates to offset emissions beyond regulatory requirements.
Standards include:
Verra (VCS)
Gold Standard
American Carbon Registry (ACR)
VCM prices vary widely depending on:
Project type
Vintage year
Verification quality
Co-benefits (biodiversity, social impact)
8. Key Differences: RECs vs Carbon Credits
Aspect RECs Carbon Credits
Unit 1 MWh renewable power 1 tonne CO₂e
Purpose Renewable sourcing Emission offset
Scope Electricity only Multi-sector
Accounting Scope 2 Scope 1, 2, or 3
Market Power & ESG Climate finance
Permanence Linked to generation Linked to reduction/removal
9. Corporate Use Cases
Corporates often use both instruments together:
RECs → Claim renewable electricity usage
Carbon credits → Offset residual emissions
For example:
A data center uses RECs to claim 100% renewable power
It then purchases carbon credits to offset diesel backup, logistics, and Scope 3 emissions
10. Price Dynamics and Risks
REC Price Drivers
RPO targets and enforcement
Renewable capacity additions
Regulatory changes
DISCOM financial health
Carbon Credit Price Drivers
Climate policy ambition
Corporate net-zero commitments
Quality and credibility of credits
Supply constraints for nature-based projects
Key Risks
Double counting
Greenwashing
Policy reversals
Low-quality offsets undermining credibility
11. Emerging Trends
Article 6 of Paris Agreement
Enables cross-border carbon trading and international credit transfers.
High-Integrity Carbon Credits
Shift toward removal-based credits (DAC, biochar).
India’s Carbon Market (ICM)
India is transitioning from PAT & REC mechanisms toward a unified Indian Carbon Credit Trading Scheme (CCTS).
Tokenization & Digital MRV
Blockchain-based tracking for transparency and trust.
12. Investment and Trading Perspective
For investors and traders:
RECs offer policy-driven cyclical trades
Carbon credits represent a long-term structural decarbonization play
Quality differentiation will drive price dispersion
Carbon markets may become a new asset class, similar to power and gas
13. Conclusion
Renewable Energy Certificates and Carbon Credits are cornerstones of market-based climate action. RECs accelerate renewable adoption by monetizing clean energy attributes, while carbon credits provide flexibility in achieving emission reduction targets across the economy.
As climate regulation tightens and ESG scrutiny deepens, these instruments will evolve from niche compliance tools into strategic financial assets, shaping energy markets, corporate strategy, and global capital flows.

Part 11 Trading Master Class With Experts Time Decay (Theta)
Theta represents how much value option will lose per day even if price doesn’t move.
Sellers LOVE Theta
Buyers FEAR Theta
Near expiry:
A ₹200 premium may fall to ₹20 even with little change in spot.
This is how sellers make money consistently.

Part 4 Institutional Option Trading Vs. Technical AnalysisBasic Terminology of Options
Underlying: Asset on which the option is based (Nifty, Bank Nifty, stocks).
Strike Price: The fixed price at which the holder can buy or sell.
Premium: The price paid to buy an option.
Expiry Date: Date on which the option becomes void.
Lot Size: Minimum quantity you must trade (e.g., Nifty lot = 50).
Intrinsic Value: Real value if the option is exercised now.
Time Value: Extra premium due to remaining time until expiry.
Option Buyer: Pays premium, has limited risk and unlimited reward potential.
Option Seller (Writer): Receives premium, has limited reward and potentially high risk.

Thematic ETFs & Sector Funds for India in 2026🧠 1. Understanding Thematic & Sector Funds in India
📌 What Are Sector Funds?
Sector funds are investment vehicles (often mutual funds or ETFs) that concentrate their assets in one specific industry or sector of the economy—like banking, IT, infrastructure, or energy. These funds aim to capture the full performance cycle of that one sector. They hold only stocks from that sector and therefore have high concentration risk and potentially high returns if the sector outperforms.
📌 What Are Thematic Funds?
Thematic funds also focus on a broad theme or trend—but rather than being confined to a single sector, they may span multiple sectors that fit the underlying idea. A theme could be consumption, business cycle, digital transformation, or green energy. Thematic funds must invest at least ~80% of their assets in stocks tied to the theme.
📌 Thematic ETFs vs Sector Mutual Funds
ETFs (Exchange-Traded Funds): Listed on stock exchanges and traded like stocks, ETFs can offer lower expense ratios, intraday pricing, and transparency.
Mutual Funds (Sector or Thematic): Often actively managed and traded based on NAV (net asset value) at the end of the trading day.
Difference in Practice: ETFs are typically passive (tracking an index), while sector/thematic mutual funds can be active or semi-passive.
📊 2. Why Investors Use These Funds in 2026
🎯 Focused Exposure
Sector/thematic funds allow investors to selectively target growth drivers in the Indian economy—such as rapid urbanisation, rising middle-class consumption, infrastructure spend, or digitisation.
📉 Diversification vs Concentration
Sector funds have minimal diversification, giving deep exposure to sector movements.
Thematic funds, because they span multiple sectors linked by a narrative (e.g., ESG or digital economy), offer moderate diversification relative to sector funds, but still higher concentration than broad equity funds.
📈 Tactical Strategies
Many investors view these funds as tactical or satellite allocations (not core holding), because returns and risk can vary dramatically depending on economic cycles. For instance, sector funds often work very well when a specific sector is booming—but can lag significantly when that sector weakens. Experts suggest using them only as a small part of a broader portfolio strategy.
📌 3. Major Themes & Sectors in the Indian Market (2026)
📌 A. Infrastructure & Capex
India’s infrastructure push, under multiple government initiatives, continues to be a key secular theme. Funds in this space invest in companies tied to construction, engineering services, power utilities, logistics, and related capital goods.
Examples:
ICICI Pru Nifty Infrastructure ETF — tracks infrastructure companies.
Quant Infrastructure Fund — strong long-term historical CAGR among thematic funds.
Why It Matters: India’s National Infrastructure Pipeline and related spending targets fuel demand for businesses in this space.
📌 B. Consumption & Domestic Growth
As household incomes rise, themes tied to domestic consumption (ranging from FMCG to automobiles and retail services) remain strong.
Examples:
Nippon India ETF Nifty India Consumption — exposure to consumption companies.
SBI Consumption Opportunities Fund — thematic mutual fund capturing diverse consumer demand.
Why Few Investors Like It: Consumption trends are closely linked to demographic changes and urbanisation, often yielding stable growth opportunities.
📌 C. Banking & Financial Services
Traditionally a pillar of the Indian economy, financials—especially banks and PSU banks—remain a favourite for tactical investors.
Examples:
Kotak Nifty PSU Bank ETF — focused on public sector banks.
Nippon India ETF Nifty PSU Bank BeES — tracks PSU bank index.
Investor Angle: Rotational strategies sometimes favour this sector during banking or credit cycles.
📌 D. Technology & Digital Themes
Tech exposure spans not just traditional IT services, but digital transformation trends such as cloud, automation, and AI.
Examples:
ICICI Pru Nifty IT ETF — technology sector ETF.
ICICI Pru Technology Fund — mutual fund with broader tech exposure.
Why It’s Catchy: Tech firms often benefit from global digital adoption trends, but can be volatile due to global cyclical pressures.
📌 E. Defence & Strategic Industries
With rising defence spending and a focus on domestic manufacturing, defence has become a thematic focus.
Examples:
Motilal Oswal Nifty India Defence ETF — defence-focused ETF.
Why It’s Trending: Government policy support and strategic investments in aerospace and defence manufacturing bolster this theme.
📌 F. Metals, Energy & Commodities
Commodity cycles and industrial demand also create opportunities—from metals/refineries to energy companies.
Examples:
Mirae Asset Nifty Metal ETF — metals sector exposure.
Motilal Oswal Nifty Energy ETF — ETFs tracking energy & utilities.
🎯 4. Thematic Funds (Mutual Funds) to Watch in 2026
Sectoral mutual funds—another important segment—are actively managed thematic equity funds.
Examples (based on performance or popularity):
ICICI Pru Business Cycle Fund — focuses on cyclical trends across sectors.
SBI PSU Fund — diversified PSU-oriented theme.
HDFC Defence Fund — defence industry exposure.
Quant Infrastructure Fund — strong historical CAGR.
DSP Healthcare Fund & SBI Healthcare Opportunities Fund — healthcare & pharma themes.
These funds span a variety of thematic ideas including business cycles, PSUs, infrastructure, technology, and healthcare.
⚠️ 5. Risks & Limitations
🔥 High Concentration Risk
By design, sector/thematic funds often invest heavily in a narrow universe. While this can amplify gains when the theme works, it also means sharper declines when it doesn’t.
🧨 Volatility & Timing
Performance often swings with economic cycles or sentiment—making timing important. Many retail investors enter after strong performance, only to face downturns later.
📉 Inflow Fluctuations
Recent market data show inflows into thematic/sector funds have fluctuated sharply, with periods of both rapid growth and sudden slowdown—suggesting investor sentiment is volatile.
🧠 ETF Liquidity Concerns
Unlike broad index ETFs, many sector/theme ETFs suffer from lower liquidity, which can widen bid-ask spreads and affect trading prices.
📊 6. How These Fit Into a Portfolio (Practical Tips)
🧩 Core vs Satellite Strategy
Core Investments: Broad index funds or diversified equity funds.
Satellite Allocation: Sector/thematic funds (5–15% of total equity allocation), for tactical exposure to growth trends.
📆 Long vs Short Term
Use sector/thematic funds for long-term structural themes, but monitor risk and rebalance regularly.
For short-term tactical plays, ETFs allow more flexibility due to intraday pricing.
⚖️ Diversification Balance
To mitigate risk, never concentrate a major portion of your portfolio solely in one theme/sector—even if the narrative looks strong.
🧠 Conclusion
In 2026, thematic ETFs and sector funds remain powerful investment tools in India for capturing specific growth stories—from infrastructure and defence to tech and consumption themes. They offer a focused way to participate in structural tailwinds. However, they come with higher concentration risk and volatility than broad market exposures. Used wisely—as satellite elements within a diverse portfolio—they can enhance returns, but they are not a replacement for diversified investing.
If you're considering these, align your choice with your risk appetite, time horizon, and thematic conviction, and review regularly to ensure the underlying story still holds.

Retail investor behavior changes post-20251. Retail Markets Are Evolving — Not Repeating Old Patterns
The retail investor segment — once dismissed as undisciplined, speculative, or marginal — has matured into a structurally relevant market force. Retail participation now influences not only trading volumes but also broader asset flows and sentiment. Research in 2025 shows that retail investors are making more strategic decisions and timing markets better than stereotypes suggest, challenging conventional assumptions about “amateur” investors.
This evolution is not uniform globally, but common themes emerge across regions, asset classes, and platforms.
2. Demographic Shifts: Younger, Tech-Native Investors Dominate
One of the most profound changes in retail investing post-2025 is the demographic profile of participants:
Gen Z and Millennials are engaging earlier — many starting to invest in their late teens or early 20s — far sooner than previous generations.
Younger investors are more receptive to AI-assisted advice, open to automated portfolio guidance, and more comfortable with digital ecosystems.
This shift not only increases the number of retail accounts but reshapes risk preferences, preferences for asset types, and methods of market interaction.
Across markets, this younger cohort is less bound by traditional investing conventions and more likely to explore alternative assets, thematic strategies, and digital-first tools.
3. Digital Platforms Are Central to Retail Behavior
The rise of mobile trading apps — with real-time alerts, frictionless execution, and intuitive interfaces — is fundamental to post-2025 retail behavior:
Zero-commission trading has become the global norm, enabling more frequent trading and attracting a broader, younger base.
Investors use apps to trade fractional shares, access international markets, and mix traditional and alternative assets seamlessly.
Security and trust features, including biometric logins and fraud detection, are now expected rather than optional.
These platforms blur the boundary between “investing” and “social finance”: funds, equities, crypto, ETFs, and educational content all coexist in one ecosystem.
4. Broader Access, Greater Participation
Before 2020, market access was limited by cost, information asymmetry, and institutional barriers. Now:
Retail investors can trade international stocks, ETFs, and digital assets with minimal friction.
Brokerage innovations like fractional investing democratize high-priced stocks.
Emerging market investors — including in India — are increasingly participating directly in equities, moving away from fixed deposits and traditional assets.
This has increased retail influence in indices and capital markets. In some markets like India, retail investors now hold a significant share of total market cap, reshaping ownership structures and domestic liquidity.
5. Portfolio Strategies Are Becoming More Sophisticated
Although early retail behavior was often associated with speculation, the reality post-2025 is more nuanced:
Goal-Oriented and Long-Term Thinking
Retail portfolios increasingly reflect long-term objectives — retirement, wealth accumulation, home ownership — rather than pure short-term speculation.
Diversification and Passive Investing
Low-cost ETFs and passive investing vehicles are popular, with many retail investors seeking diversified exposure to sectors like AI, clean energy, and global indices.
Sustainable & ESG Focus
Environmental, Social, and Governance (ESG) considerations are shaping allocations, particularly among younger investors who view sustainability as part of value investing.
Measured Risk Appetite
While risk tolerance remains varied, evidence suggests retail traders are becoming more selective and less reactive than in past cycles. Some research highlights that many retail traders provide liquidity and market support rather than heightening volatility.
6. Behavior Under Stress: Caution and Contradictions
Retail investor behavior isn’t a straight line toward efficiency. In fact, periods of market stress reveal key tendencies:
Sentiment Fluctuates with Macro Conditions
In late 2025, institutional signals of caution led retail traders to reduce bullish bets, especially in sectors like tech, suggesting a more cautious stance in uncertain markets.
Behavioral Biases Still Matter
Despite growth in sophistication, classic biases — like herding, confirmation bias, and FOMO — remain visible. Online communities and social proof can amplify speculative moves.
Fatigue After the Hype Cycle
After the intense retail trading frenzy of 2020–24, some markets experienced declines in active retail accounts, possibly due to losses, tougher conditions, or burnout.
This suggests that retail participation is sensitive to market stress and profitability, and not immune to drawdowns in engagement.
7. Crypto and Alternative Assets: A Structured Return
Following the bear markets and regulatory ambiguity of earlier years, retail interest in crypto and blockchain-linked assets has returned with more structure and participation in regulated markets:
Improved infrastructure, clearer rules, and institutional endorsement have boosted confidence among retail crypto investors.
Platforms now blend crypto and traditional assets, making allocation decisions easier for diversified portfolios.
Retail involvement in digital finance is no longer a fringe play — it’s part of the mainstream investing toolkit.
8. Globalization of Retail Investing
Geography matters less in 2026:
Investors in India, Latin America, Africa, and Southeast Asia are participating in U.S. and European markets through accessible platforms.
Cross-border flows and digital finance products are creating global retail pools that influence markets beyond local economies.
This globalization expands liquidity but also exposes retail investors to new risks — including currency, geopolitical, and macroeconomic risk — that require sophisticated strategies.
9. The Role of Financial Education and AI Tools
Retention of educated investors often hinges on tools:
AI assistants and automated advisors are reducing informational gaps, making complex portfolio decisions more accessible.
Investors are leveraging analytics, sentiment indicators, and automated risk scoring — previously the domain of professionals.
Education — both formal and platform-driven — is transforming how retail investors think about risk, returns, and diversification.
10. What This Means for Markets and the Road Ahead
The cumulative effect of these changes has reshaped market dynamics:
Retail flows contribute to price discovery and contribute non-negligible capital in major markets.
Retail participation can dampen sell-offs when coordinated but may exacerbate volatility in specific themes.
The “retail investor” is no longer a monolithic trading stereotype but a diverse set of participants with varied goals — long-term wealth building, speculative trading, algorithmic strategies, and alternative asset exposure.
Looking forward into late 2026 and beyond:
Digital platforms will likely continue to innovate with AI and automation.
Regulatory frameworks may evolve to protect novice investors while fostering broader participation.
Retail behavior — because of its scale and connectedness — will remain a core driver of market liquidity and sentiment.
Conclusion
Post-2025, retail investors are not simply more active — they are more informed, more diverse, and more central to modern capital markets. They blend long-term goals with real-time execution, embrace technology and data, and increasingly shape global market flows. However, behavioral biases and cyclical sentiment swings persist, reminding us that retail investing is as much a human endeavor as a technological one.

Part 1 Institutional Option Trading Vs. Technical Analysis Pros and Cons of Trading Options
Pros
Potential upside gains
Losses may be limited to premium paid
Leverage can increase rewards
Risk hedging
Cons
Complex
Difficult to price
Advance investment knowledge
Leverage can multiply potential losses
Potentially unlimited risk when selling options

KIRIINDUS 1 Day Time Frame 📌 Current Price Snapshot
📍 NSE (approx current trading price): ₹496.50 – ₹513.95 range during today’s session.
The stock has been trading near its 1D range low to mid and is well below key moving averages, signaling near‑term weakness.
📊 1‑Day Pivot & Support/Resistance Levels
Pivot Points (Classic/Fibonacci – short‑term traders)
Based on pivot calculations from the previous session:
Pivot (central reference): ~ ₹536.98
Resistance Levels:
R1: ~ ₹545.62
R2: ~ ₹553.53
R3: ~ ₹562.17
Support Levels:
S1: ~ ₹529.07
S2: ~ ₹520.43
S3: ~ ₹512.52
👉 These are the key intraday turning points that many traders use to gauge short‑term bias:
Holding above the pivot (~₹536) is bullish bias intraday.
Dropping below S2/S3 suggests continued weakness for the session.
📉 Alternative Support/Resistance from Other Technical Sources
A slightly wider intraday pivot setup also suggests:
Central Pivot (CPR): ~ ₹520–₹524
Immediate Support: ~ ₹503–₹507
Immediate Resistance: ~ ₹548–₹558
This is useful for scalpers and intraday short‑term strategies.
🎯 How Traders Use These Levels
Bullish scenario
A sustained price move above Pivot (~₹536) → rally toward R1 (₹545–₹550) and R2 (~₹553+).
Bearish scenario
Break and close below S1/S2 (~₹529–₹520) → risk of probing S3 and lower (~₹512 or below).
These levels are widely used by intraday traders to set entry, stop‑loss, and exit targets for the day session.

Part 2 Intraday Master Class 1. Advantages of Options
Small capital can control large exposure
Multiple strategies for any market condition
Limited risk for buyers
Hedging capabilities
Income generation for sellers
2. Disadvantages of Options
Time decay kills buyers
Volatility can cause unpredictable movements
Unlimited loss for unhedged sellers
Complex to understand initially
Liquidity issues in some stocks

IFCI 1 Week Time Frame 📌 Current Price Range: ~₹60–₹62 (latest prices reported)
📊 Weekly Technical Levels (1‑Week Time Frame)
Resistance Levels (Upside Targets)
~₹62.2 – First near‑term resistance (weekly reaction zone)
~₹63.6–₹64 – Next resistance cluster and weekly pivot barrier
~₹66–₹69 – Higher resistance zone from classic pivots or multi‑period levels
➡️ These levels act as potential upside caps in a rally over the next few sessions or week. A clean breakout above these with volume could shift bias higher.
Support Levels (Downside Defenses)
~₹56–₹57 – Near support just below current price (week pivot S1/S2)
~₹54–₹55 – Secondary support – often watched if weakness extends
~₹52–₹52.5 – Lower support zone which has historically acted as swing low support in prior ranges
➡️ These levels can be used as short‑term stop or trend invalidation points; if violated, a deeper pullback may unfold.
🕒 How Traders Use These Levels
Level Type Typical Use
Support Place stops just below, monitor for bounce entries
Resistance Consider partial profit booking or watch for breakout
Pivot Midpoint for bias (above → bullish, below → bearish)
👉 A break and sustained close above ₹63.6–₹64 on weekly candles could indicate continuation to the next leg up. Conversely, a close below ₹56 may suggest short‑term weakness. Always confirm with volume & momentum.

India equity market outlook 2026 (Sensex & Nifty projections)📈1. Broad Market Outlook: 2025 Recap and 2026 Expectations
🧭 Where Things Stand
Indian equities (Sensex and Nifty 50) have had a mixed performance over 2025:
Markets underperformed global peers and emerging markets, with foreign institutional investors (FIIs) pulling funds due largely to tariff shocks and earnings downgrades.
While local domestic investment has provided some support, volatility has been elevated.
Early 2026 sessions saw indices consolidate with geopolitical and macro risks still influencing sentiment.
Still, analysts broadly expect positive momentum to return by mid-2026, supported by Indian macro resilience and corporate earnings stabilization.
📊 Macro Tailwinds
India’s economy remains one of the fastest-growing among major markets:
The IMF revised India’s growth outlook for FY 2026 to 7.3% — a strong relative pace versus global averages.
Strong nominal GDP growth and inflation within the RBI’s target range are expected to underpin corporate earnings and valuations.
These fundamentals matter because equity markets are ultimately a reflection of economic growth + corporate profit growth.
📌2. Sensex & Nifty 50: Forecasts and Target Ranges for 2026
Numerous brokers and strategists have published prices bands for the major indices by end-2026 or mid-2026. These vary somewhat based on scenario assumptions — but the picture is mostly constructive:
🔹 Consensus Target Ranges
Sensex
Bull case: ~105,000–107,000 by Dec 2026 (reflecting ~20–26% upside).
Base case: ~90,000–95,000 by Dec 2026.
Conservative/neutral: ~89,000–92,000 by mid-2026.
Nifty 50
Bullish targets: ~30,000–32,000 by Dec 2026.
Base case: ~28,500–29,300 by year-end.
Mid-year range: ~27,200 by mid-2026 in some surveys.
These projections aren’t precise predictions — they’re conditional on economic growth, corporate profits, interest rate trends, and global conditions.
🧠3. What’s Driving This Outlook?
📌 A. Earnings Growth Resumption
A key theme underpinning these forecasts is the expectation of a resurgence in corporate earnings growth after a period of downgrades:
Morgan Stanley expects earnings growth of ~17–19% annually through FY28, which supports higher valuations.
JPMorgan highlights domestic demand and fiscal policy as supportive for earnings expansion in 2026.
Stronger earnings often translate into higher index levels through rising EPS × valuation multiples.
📌 B. Valuation Normalization
Indian equities underwent a valuation correction post-pandemic and relative to other emerging markets. Some strategists argue this “reset” makes the market a more attractive entry point:
Morgan Stanley’s base case assumes a P/E of ~23–23.5x, close to long-term averages.
Normalized valuations may reduce downside and set the stage for risk-on sentiment if global conditions improve.
📌 C. Domestic Flows and Policy Support
Domestic institutional investors (DIIs) and retail participation have been structural supports, buffering the market against FII volatility:
Indian households and mutual funds haven’t retreated as sharply as FIIs, providing a stabilizing base.
Monetary policy easing or fiscal incentives could further enhance liquidity and investor confidence.
📌 D. Macro Stability
With inflation under control and growth remaining robust, macro conditions look supportive for 2026:
RBI policy is expected to remain accommodative if inflation stays within target.
GDP and consumption data continue to support robust corporate performance.
These core drivers help explain why most analysts maintain a moderate to strong bullish tilt for 2026.
⚠️4. Key Risks and Challenges
Despite the positive tilt, there are significant headwinds that could derail or slow the rally:
❗ Global Trade & Geo-political Risks
Trade tensions (e.g., U.S.–Europe tariff uncertainties) have caused risk-off moves, pushing volatility higher.
Geopolitical events can influence sentiment and capital flows.
❗ Foreign Investor Flows
FPI outflows have been pronounced recently. If this trend continues, it could keep valuations under pressure or slow index gains.
❗ Corporate Earnings Monitor
Weak earnings in key sectors (e.g., recent underperformance in some IT firms) can affect sentiment and index breadth.
❗ Global Macro Conditions
A global slowdown or higher interest rates in developed markets could make risk assets less attractive, impacting inflows.
❗ Valuation Risks
If valuations re-inflate too rapidly without earnings support, markets could become susceptible to corrections.
Taking these risks together implies that market moves won’t be linear — expect corrections, cycles, and periods of volatility even within a generally positive trend.
🏭5. Sector and Thematic Drivers
Equity performance won’t be uniform across sectors. Some key industry trends likely to influence 2026:
🔹 Financials & Banks
Banks often benefit from higher credit growth, rate stability, and improved asset quality — a backbone of the Indian index structure.
🔹 Technology and IT Services
IT sector growth is tied to global demand. Weakness in contract wins could generate volatility, as seen in recent earnings.
🔹 Domestic Cyclicals
Consumption-linked sectors (consumer goods, autos) may benefit from strong consumer demand and urbanisation trends.
🔹 Capital Goods/Infrastructure
If capex cycles revive (supported by government infrastructure spend), industrials and capital goods could outperform.
📏6. Practical Takeaways for Investors
🧩 Long-Term Lens
Equities historically reward patient investors. While year-to-year volatility is normal, the structural growth story of India is largely intact.
📊 Diversification Matters
Index gains could be consolidated in certain segments while others lag. Diversification helps mitigate sector-specific risks.
📉 Volatility Is Likely
Short-term fluctuations — due to geopolitical news, earnings surprises, or global risk events — should be expected.
📈 Domestic Flows + Policies
Domestic investor behaviour and policy actions will be key determinants of medium-term trends.
📦7. Summary Projection
Benchmark Base-Case Target (2026) Bull-Case Target (2026) Notes
Sensex ~90,000–95,000 ~105,000–107,000 Earnings rebound + macro tailwinds
Nifty 50 ~28,500–30,000 ~30,000–32,000 Domestic resilience + valuation normalisation
These ranges reflect collective broker views and are conditional, not guaranteed.
📊 Final Thought
India’s equity markets in 2026 appear poised for a continuation of the long-term growth trajectory, though characterized by selective risks and volatility cycles. Solid fundamentals — including strong GDP growth, supportive policy, and a resurgent earnings cycle — underpin the positive outlook. However, external shocks, geopolitical tensions, or slower global recovery could moderate performance or introduce cyclic retracements.
In navigation terms, 2026 likely won’t be a straight rally — but rather a trend with periodic corrections, with significant opportunities for investors who combine long-term conviction with risk awareness.

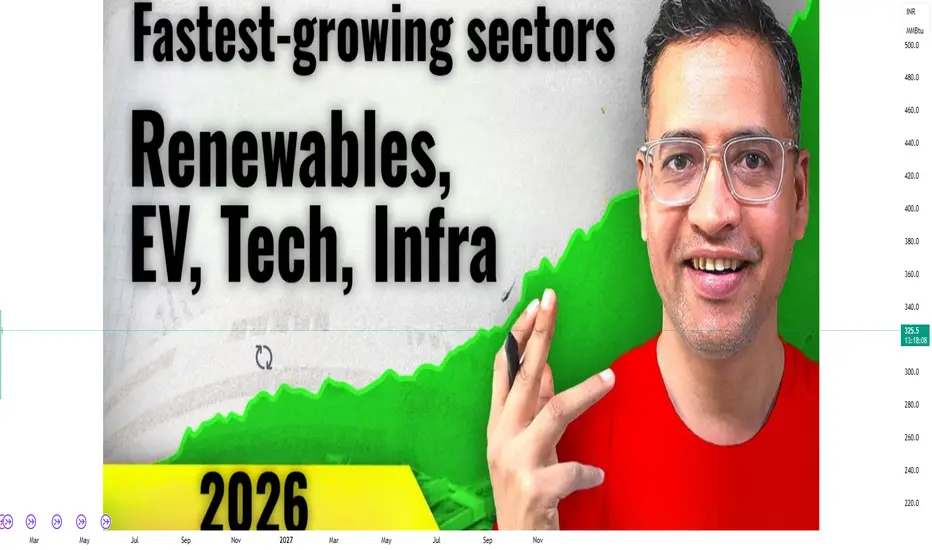
Fastest-growing sectors in 2026: Renewables, EV, Tech, Infra1. Renewables: Powering the Energy Transition
Global Growth & Investment
Renewable energy — including solar, wind, hydro, bioenergy, and emerging technologies such as green hydrogen and energy storage — is one of the fastest-growing sectors worldwide. Governments, investors, and corporations are pouring capital into clean energy to decarbonize economies, meet climate targets, and reduce reliance on fossil fuels. According to international forecasts, renewables are projected to increase their share of global energy consumption significantly by 2030, with renewable electricity expanding rapidly in the industry, transport, and buildings sectors.
Key Drivers
Climate Commitments & Policy Incentives – Governments across Europe, Asia, and the Americas are implementing policies that subsidize renewable projects, penalize carbon emissions, and set net-zero targets. For example, India’s push for 500 GW of renewable capacity by 2030 is driving solar and wind expansion alongside storage solutions.
Cost Reductions – Technological improvements have dramatically lowered the cost of solar panels and wind turbines, making renewables competitive with conventional energy.
Integration with Storage & Smart Grids – Growth in advanced energy storage technologies (including battery systems) and smart grid integration is solving the intermittency problem — a major historical barrier to renewables.
Emerging Trends
Solar innovation — new technologies like perovskite solar cells and floating solar farms are expanding opportunities.
Offshore wind growth — deeper water installations and floating turbines are enabling significant offshore capacity.
Green hydrogen scaling — as electrolyzer costs fall, hydrogen is gaining traction for heavy industry decarbonization.
Corporate demand — companies are committing to renewable power as part of ESG and net-zero strategies.
Economic Impact
Renewables are a major job creator and investment destination. For example, installation, manufacturing, and maintenance roles in solar and wind are among the fastest-growing occupations globally. With investments exceeding traditional fossil fuel project financing in some markets, renewables are reshaping how energy systems are built and financed.
2. Electric Vehicles (EVs): Redefining Transportation
Market Expansion
The electric mobility market continues its rapid global expansion. Electric vehicle sales — including passenger cars, trucks, buses, and two-wheelers — are accelerating due to stronger emissions regulations, consumer demand, and falling battery costs. One estimate suggests the global EV fleet could reach roughly 116 million vehicles in 2026, up about 30 % from the previous year.
Growth Drivers
Emissions Regulations – Many regions are phasing out internal combustion engine vehicles, pushing manufacturers and consumers toward EVs.
Battery Technology & Cost Declines – As battery performance improves and prices drop, EVs become more affordable and attractive to a broader consumer base.
Charging Infrastructure Expansion – Investment in EV charging networks — including fast chargers and grid-connected systems — is enabling longer trips and better usability.
Integration with Renewables
A key growth area is the integration of EVs with renewable energy systems. Solar-powered charging points and vehicle-to-grid (V2G) technologies help EVs not only use clean energy but also stabilize the grid by providing stored electricity when needed.
Sector Challenges & Opportunities
Charging infrastructure gap — expansion still needs to catch up with adoption.
Battery recycling and sustainability — as EV deployment scales, end-of-life battery recycling will become vital.
Despite challenges, EVs are a centerpiece of electrified transport and decarbonization strategies globally, with significant implications for energy demand patterns, oil markets, and automotive industry structures.
3. Technology: The Digital Acceleration
Redefining Industries
Technology — particularly artificial intelligence (AI), cloud computing, cybersecurity, data centers, and digital services — is expanding rapidly as organizations across sectors invest heavily in digital transformation.
AI & Machine Learning
AI is no longer just a tool — it’s becoming a core infrastructure component for enterprise and industrial systems. From autonomous energy grid management to predictive maintenance and business analytics, AI adoption is growing fast. AI systems are optimizing energy distribution, managing EV charging demand, and enhancing industrial productivity.
Cloud & Data Centers
Cloud computing and data center infrastructure remain vital as demand for digital services — including streaming, remote work, big data, and AI training — grows. Forecasts indicate that cloud infrastructure revenue will exceed hundreds of billions of dollars in 2026, with data centers expanding capacity globally.
Cybersecurity & Digital Services
With digital expansion comes higher cybersecurity needs. Investments in digital defenses, secure cloud platforms, and compliance solutions are booming as businesses safeguard data and ensure continuity.
Emerging Tech Sub-sectors
Edge computing — for low-latency processing in IoT and industrial use cases.
Generative AI and automation tools — reshaping workflows across industries.
Quantum computing and next-gen semiconductors — these are nascent yet rapidly emerging areas.
The tech sector’s evolution is foundational to every other growth theme — from enabling smart energy grids to powering autonomous vehicles and delivering digital public services.
4. Infrastructure: Building the Backbone of Growth
Why Infrastructure Matters
Infrastructure — including energy systems, transport networks, digital networks, and urban development — is central to sustained economic growth. By 2026, infrastructure investment is one of the fastest-growing areas because it supports all the other sectors (renewables, EVs, tech).
Key Infrastructure Drivers
Energy Systems Modernization – To support renewable energy growth and EV charging, grid modernization and energy storage infrastructure are critical. Projects include upgraded transmission lines, substation automation, and decentralized power networks.
Transport & Mobility Networks – Beyond EV adoption, there’s demand for integrated transport infrastructure including smart highways, electrified public transit, and urban mobility solutions.
Digital Infrastructure Expansion – With cloud services and digital adoption rising, infrastructure for broadband, fiber optic networks, 5G/6G, and data centers is expanding rapidly.
Sector Trends
Clean Energy Infrastructure — integrating renewables, storage and EV charging to support resilient and sustainable grids.
Smart Cities & Urban Systems — digital and sensor networks to optimize traffic, utilities, and public services.
Public-Private Partnerships (PPPs) — governments are increasingly partnering with private investors to finance large infrastructure projects.
Economic Impact
Infrastructure spending stimulates economic activity through job creation, supply chain demand, and enhanced productivity. Upgrading infrastructure is directly linked to long-term competitiveness, economic resilience, and quality of life improvements.
How These Sectors Interact
These four sectors — Renewables, EVs, Technology, and Infrastructure — are deeply interconnected:
Renewables and EVs both depend on grid upgrades, storage systems, and digital control systems.
Technology (especially AI, cloud, and digital services) enables smarter energy grids, efficient logistics, and responsive urban systems.
Infrastructure investment is the foundation that makes large-scale transitions feasible — from renewable generation to electrified mobility and digital economies.
This synergy creates a multiplier effect for economic growth: advancements in one sector accelerate progress in the others, leading to broader innovation and productivity gains.
What This Means for 2026 and Beyond
Investment Opportunities – These sectors are attracting capital from sovereign wealth funds, institutional investors, and venture capital, reflecting confidence in long-term growth.
Jobs & Skills Transformation – Employment will rise in clean energy, software engineering, EV manufacturing, AI development, infrastructure planning, and data management.
Policy Focus – Governments are enacting supportive regulations, subsidies, and targets to accelerate adoption and market formation.
Global Competitiveness – Countries leading in these sectors stand to benefit from economic growth, technological leadership, and improved energy security — shaping the next era of global economic power.
Conclusion
In 2026, the expansion of renewables, electric vehicles, technology, and infrastructure is not just a trend — it’s a structural shift in the global economy. Driven by sustainability goals, technological advancement, and changing consumer and business behaviors, these sectors offer significant opportunities for growth, investment, employment, and innovation.
Together, they represent the backbone of a future-ready economy — one that is cleaner, more connected, and more resilient.
Part 1 Technical Analysis VS. Institutional Trading Common Mistakes Traders Make
Buying OTM options expecting miracles
No stop-loss on option selling
Trading without understanding volatility
Getting trapped during reversal
Overtrading
Trading during low liquidity
Holding positions during events without hedges
