Candle Pattern Explained There are two primary types of options: Call Options and Put Options. A Call Option gives the buyer the right to purchase an underlying asset at a specific price (called the strike price) before or on a certain date (known as the expiry date). Traders buy calls when they expect the price of the asset to rise. Conversely, a Put Option gives the buyer the right to sell the asset at the strike price within a specific period. Traders buy puts when they anticipate the asset’s price will fall.
Trendlinebounce

Part 6 Institutional Trading Option Trading in India
In India, option trading is available on major exchanges like NSE and BSE, primarily for:
Equity Options (Stocks)
Index Options (NIFTY, BANK NIFTY, FINNIFTY)
Contracts are settled in cash, and trading happens in defined lot sizes. Most retail traders prefer index options due to liquidity and low margin requirements.

Part 3 Institutional Trading Uses of Option Trading
Hedging: Protecting an existing portfolio from adverse price movements.
Example: Buying a Put Option to hedge a long stock position.
Speculation: Betting on price movement direction with limited capital.
Example: Buying Call Options if expecting a stock to rise.
Income Generation: Selling options to collect premiums in range-bound markets.
Example: Covered Call Writing.

Part 2 Ride The Big MovesUses of Option Trading
Hedging: Protecting an existing portfolio from adverse price movements.
Example: Buying a Put Option to hedge a long stock position.
Speculation: Betting on price movement direction with limited capital.
Example: Buying Call Options if expecting a stock to rise.
Income Generation: Selling options to collect premiums in range-bound markets.
Example: Covered Call Writing.
Types of Option Trading Styles
American Options: Can be exercised any time before expiry.
European Options: Can be exercised only on the expiry date.
(In India, most index and stock options are European style.)

Step-by-Step Divergence Trading StrategyOption Pricing Factors
Option prices are influenced by several key factors:
Spot Price: Current market price of the asset.
Strike Price: Pre-agreed exercise price.
Time to Expiry: Longer duration = higher premium (due to time value).
Volatility: Higher volatility = higher premium (greater uncertainty).
Interest Rates: Affect cost of carry.
Dividends: Expected payouts can impact call and put prices.

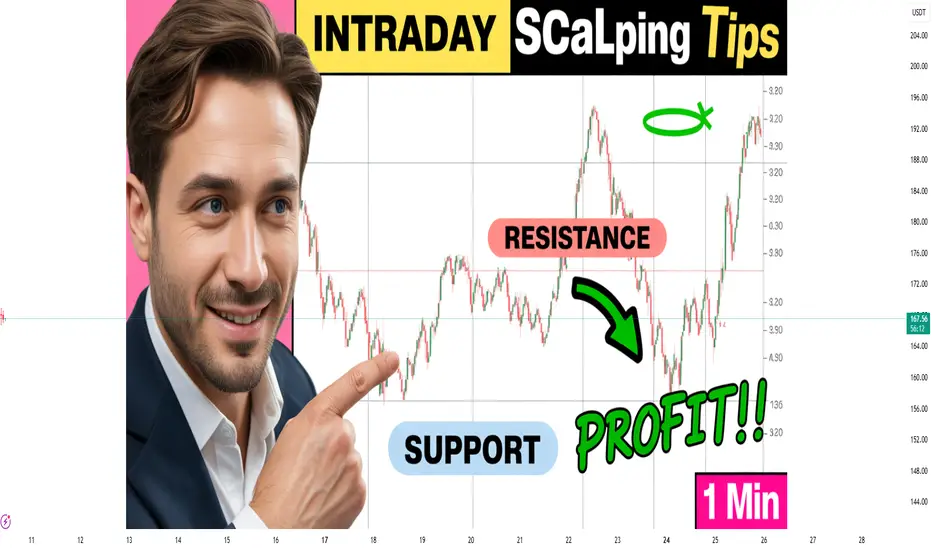
Intraday Scalping Tips: Mastering the Art of Fast Profits1. What Is Intraday Scalping?
Scalping is a subset of intraday trading, but with a much shorter time frame. Instead of holding trades for hours, scalpers enter and exit positions within seconds or minutes. The goal is to capture tiny price movements, often ranging from 0.1% to 0.5%, multiple times a day.
For example, if a stock moves from ₹500 to ₹501, a scalper may book a quick profit and repeat the process across different stocks or price levels. Over the course of the day, these small gains can accumulate into substantial profits if managed properly.
However, because scalping involves high trading frequency, transaction costs, timing, and execution speed become critical factors.
2. The Psychology of a Scalper
Scalping is not just about strategy—it’s about mindset. A successful scalper must be calm under pressure, quick in decision-making, and emotionally detached from wins or losses.
Unlike swing traders, scalpers can’t afford to wait for a market to “come back.” They must accept small losses quickly and move on to the next trade. Emotional control and discipline are therefore more important than technical knowledge alone.
Key psychological traits include:
Speed and decisiveness – No hesitation when an entry or exit signal appears.
Emotional neutrality – Avoid greed after profits or frustration after losses.
Discipline – Follow your plan and respect stop-loss limits, no matter what.
3. Essential Tools for Scalping
To succeed as a scalper, you need a professional setup that allows for precision and speed:
Fast Internet Connection: Delays of even a few seconds can affect profits.
Reliable Trading Platform: Choose brokers and platforms with low latency and fast execution (like Zerodha, Angel One, or Upstox for Indian markets).
Direct Market Access (DMA): Helps execute orders directly without delays.
High-Quality Charting Software: For real-time technical analysis (e.g., TradingView).
Level 2 Data / Market Depth: To understand bid-ask spreads and liquidity levels.
Having these tools in place ensures your decisions are based on real-time data and executed without technical lag.
4. Choosing the Right Stocks for Scalping
Not every stock is suitable for scalping. The best scalping stocks share certain characteristics:
High Liquidity: The stock should have high trading volume so you can enter and exit quickly.
Tight Spreads: A small bid-ask spread ensures that transaction costs remain low.
Volatility: Moderate price movement ensures enough opportunities without erratic swings.
Popular Stocks: Large-cap or index-based stocks like Reliance Industries, HDFC Bank, or Infosys are often good choices due to consistent volume.
Scalpers usually stick to 3–5 familiar stocks daily, mastering their price behavior instead of chasing every trending name.
5. Technical Indicators That Work for Scalping
Scalping relies heavily on technical indicators for quick decision-making. Some of the most effective tools include:
Moving Averages (MA): Short-term MAs like 5-EMA and 9-EMA help identify quick trends and crossovers.
VWAP (Volume Weighted Average Price): Acts as a dynamic support and resistance level; many institutional traders use it for intraday benchmarks.
Relative Strength Index (RSI): Helps identify overbought or oversold conditions (ideal range for scalpers: 5–15 RSI periods).
Bollinger Bands: Indicate volatility and possible breakout zones.
Volume Analysis: Volume spikes often precede major price movements—critical for timing entries.
The best scalpers combine 2–3 of these tools rather than cluttering charts with too many indicators.
6. Entry and Exit Strategies
Scalping thrives on timing and precision. Here are a few commonly used strategies:
a. Breakout Scalping
Scalpers wait for the price to break above resistance or below support with strong volume confirmation. Entry happens immediately after the breakout, and exits occur once quick profit targets (0.3%–0.5%) are achieved.
b. Range Scalping
When markets move sideways, scalpers buy near the lower boundary of the range and sell near the upper boundary. Stop-losses are placed just beyond the range.
c. Momentum Scalping
In this method, traders ride short bursts of momentum caused by news, earnings releases, or large market orders. Scalpers jump in with the trend and exit at the first sign of weakness.
Regardless of the method, stop-losses must be placed immediately—typically 0.25%–0.5% below the entry price—to control risk.
7. The Importance of Risk Management
Scalping without risk management is gambling. Since gains are small, even a few large losses can wipe out profits. Effective risk control ensures survival and consistency.
Position Sizing: Don’t risk more than 1%–2% of total capital per trade.
Tight Stop-Loss: Always use stop-loss orders to cap losses quickly.
Avoid Overtrading: Set a limit on the number of trades per day. Quality over quantity.
Keep Costs in Check: Brokerage and taxes can eat into profits. Use low-cost brokers.
Successful scalpers often say: “Protect your capital first; profits will follow.”
8. Trading Discipline and Routine
Consistency is key in scalping. Having a structured trading routine ensures focus and control.
Morning Preparation:
Review pre-market news, global cues, and technical setups.
Identify your watchlist of 3–5 liquid stocks.
Mark key intraday support and resistance zones.
During Trading Hours:
Trade only within your strategy and avoid impulsive trades.
Monitor volume surges and price reactions near key levels.
Book profits quickly; don’t aim for large moves.
Post-Market Review:
Analyze your trades to identify mistakes or strengths.
Maintain a journal recording entry/exit points, emotions, and results.
This continuous improvement mindset separates professional scalpers from amateurs.
9. Avoid Common Scalping Mistakes
Even experienced traders can fall into common traps. Be aware of these:
Over-leveraging: Using too much margin increases the risk of large losses.
Ignoring News Events: Sudden announcements can cause unexpected volatility.
Chasing Trades: Don’t enter trades just because of missed opportunities.
Neglecting Transaction Costs: Frequent trading magnifies brokerage and taxes.
Lack of Patience: Waiting for the right setup is part of the discipline.
Remember, in scalping, one bad trade can ruin ten good ones.
10. Building a Winning Scalping Mindset
Success in scalping is not about winning every trade—it’s about consistency. A skilled scalper understands that small, steady gains compound over time.
Focus on process over profit:
Stick to your rules.
Accept small losses gracefully.
Never revenge-trade after a loss.
Stay humble—markets reward patience and discipline.
Professional scalpers often compare their work to that of a surgeon: precise, focused, and unemotional.
Conclusion
Intraday scalping is an art that blends speed, strategy, and discipline. It may not suit everyone—its fast pace and emotional intensity demand exceptional control and focus. However, for those who master it, scalping can be one of the most consistent and lucrative trading styles.
By understanding market micro-movements, managing risk, and following a structured trading plan, traders can turn tiny price fluctuations into meaningful daily income. In the world of scalping, success doesn’t come from predicting the market—it comes from reacting to it faster and smarter than everyone else.
Domestic Equity Market Trend1. Overview of the Domestic Equity Market
The domestic equity market refers to the marketplace within a country where shares of publicly listed companies are traded. In India, the two major stock exchanges are the National Stock Exchange (NSE) and the Bombay Stock Exchange (BSE). These exchanges provide the platform for investors to buy and sell equity shares, derivatives, and other securities.
The Indian stock market has seen remarkable growth, transitioning from a traditional broker-driven system to an advanced, technology-based environment. The benchmark indices—Nifty 50 and Sensex—serve as the barometers of the market’s overall performance, representing the health of leading sectors in the economy.
2. Recent Market Trends and Developments
In recent years, the domestic equity market has demonstrated resilience and expansion, driven by factors such as economic reforms, digitalization, and rising participation from retail investors.
a. Record Market Capitalization
India’s market capitalization crossed record highs, placing it among the top five global markets. The continuous inflow of foreign and domestic institutional funds, alongside Initial Public Offerings (IPOs) of emerging companies, has propelled the growth.
b. Retail Investor Dominance
Retail participation has surged significantly post-2020, aided by easy access to trading platforms, low brokerage costs, and increased financial literacy. Demat accounts have grown exponentially, indicating a structural shift where individuals are no longer mere spectators but active participants.
c. Sectoral Rotation
Different sectors have led the rally at different times—technology and pharmaceuticals during the pandemic, followed by banking, infrastructure, and capital goods in the recovery phase. This rotation indicates a healthy and balanced market evolution.
d. Growing SME and IPO Market
The SME (Small and Medium Enterprises) and mainboard IPO segments have gained strong traction. The appetite for new-age business models—such as fintech, renewable energy, and logistics—shows the market’s increasing acceptance of innovation-driven enterprises.
3. Key Drivers Influencing Domestic Equity Trends
a. Economic Growth
Equity markets move in tandem with GDP growth. India’s consistent growth rate, backed by manufacturing revival, infrastructure push, and consumption strength, supports bullish trends in equities.
b. Monetary Policy and Interest Rates
The Reserve Bank of India’s (RBI) policies on liquidity and interest rates play a crucial role. Lower interest rates typically boost equity valuations, as investors prefer equities over fixed-income assets for better returns.
c. Global Influences
Despite being a domestic market, Indian equities are affected by global events such as the U.S. Federal Reserve’s policy stance, crude oil price movements, geopolitical tensions, and global capital flows.
d. Corporate Earnings
Sustained improvement in quarterly corporate earnings has kept investor sentiment positive. Companies with strong balance sheets, high return on equity, and efficient management continue to attract long-term investments.
e. Technological Transformation
The rise of digital trading platforms, AI-based analytics, and algorithmic trading has enhanced liquidity and efficiency. This modernization has encouraged both professional and retail investors to engage more actively.
4. Sector-Wise Trends
The performance of the domestic equity market can be better understood by examining sectoral movements:
a. Banking and Financial Services
The banking sector has regained leadership, supported by improved asset quality, higher credit growth, and profitability. PSU banks have shown a strong turnaround, while private banks maintain their growth momentum.
b. Information Technology
While the IT sector faced margin pressures due to global slowdown concerns, it remains a structural growth driver given India’s digital transformation and global outsourcing demand.
c. Infrastructure and Capital Goods
This sector is witnessing a revival, backed by government infrastructure spending and private capex cycles. Stocks in this space are favored for long-term growth potential.
d. Energy and Renewable Sector
The energy sector is transforming rapidly with the focus shifting to renewables. Companies involved in solar, wind, and green hydrogen are drawing strong investor interest.
e. FMCG and Consumer Discretionary
Consumer-driven sectors benefit from rising income levels and urbanization. Despite inflationary pressures, demand remains robust, making them stable defensive plays.
5. Foreign Institutional Investors (FIIs) vs. Domestic Institutional Investors (DIIs)
The balance between FIIs and DIIs has become a defining factor for market stability. While FIIs bring in large capital inflows that can drive momentum, DIIs—such as mutual funds and insurance companies—help stabilize the market during volatile phases. The growing strength of DIIs reflects increasing domestic confidence in the Indian growth story.
6. Valuation and Liquidity Outlook
India’s equity valuations are relatively higher compared to peers, reflecting strong growth expectations. However, this also implies that any earnings slowdown could trigger short-term corrections. Liquidity remains ample, with consistent inflows from mutual funds and systematic investment plans (SIPs), which have become a cornerstone of long-term investing culture.
7. Policy and Regulatory Support
Reforms such as GST, Insolvency and Bankruptcy Code (IBC), Production-Linked Incentive (PLI) schemes, and Make in India have improved the investment climate. The Securities and Exchange Board of India (SEBI) continues to enhance transparency, corporate governance, and investor protection, strengthening market integrity.
8. Emerging Themes and Opportunities
a. Digital Economy and Fintech
India’s digital economy is expanding rapidly, creating investment opportunities in payment systems, e-commerce, and tech-driven services.
b. Manufacturing and “China+1” Strategy
Global supply chain diversification has made India a preferred destination for manufacturing investments, benefiting auto, electronics, and industrial sectors.
c. Green and Sustainable Investments
ESG (Environmental, Social, and Governance) investing is gaining momentum, with investors focusing on companies with sustainable practices and ethical governance.
d. Small-Cap and Mid-Cap Momentum
Smaller companies have outperformed large caps in recent times, driven by innovation, agility, and niche market leadership. However, this segment also comes with higher risk and volatility.
9. Risks and Challenges
No market is without risks. Key challenges for the domestic equity market include:
Global slowdown impacting exports and IT revenues.
Inflationary pressures leading to tighter monetary policies.
Political and regulatory uncertainties, especially around election periods.
Valuation concerns in overbought segments.
Liquidity shocks if foreign investors withdraw funds suddenly.
Long-term investors must stay alert to these risks while maintaining a diversified portfolio.
10. Long-Term Outlook
The long-term outlook for India’s domestic equity market remains optimistic and growth-oriented. Structural reforms, digital infrastructure, demographic advantage, and a strong entrepreneurial ecosystem make India a compelling investment destination. The combination of policy stability, rising domestic consumption, and innovation ensures that Indian equities remain a central focus for global investors.
Conclusion
The domestic equity market trend reflects a story of transformation, resilience, and opportunity. From being an emerging market to becoming one of the world’s fastest-growing equity destinations, India’s market evolution is driven by strong fundamentals, policy reforms, and investor participation. While short-term corrections are inevitable, the long-term trajectory remains bullish. For investors, staying informed, disciplined, and diversified is the key to navigating this ever-evolving landscape.

Banking Sector LeadershipThe Driving Force Behind Financial Stability and Growth
The banking sector is the backbone of every modern economy. It connects savers and borrowers, funds businesses, manages risks, and stabilizes markets. But at the heart of every successful banking system lies strong leadership—visionary individuals and institutions that shape financial policy, drive innovation, and sustain trust. In the last few decades, the role of leadership in the banking sector has evolved from simple financial management to strategic foresight, digital transformation, and crisis navigation.
This essay explores the meaning, importance, evolution, and future of leadership in the global and Indian banking sectors.
1. The Essence of Leadership in Banking
Leadership in the banking sector goes beyond managing money. It’s about building trust, ensuring stability, and enabling growth. Unlike other industries, banking deals with intangible assets—confidence and credibility. When people deposit their life savings in a bank or borrow for a business, they rely on the institution’s integrity and stability. Strong leadership ensures that trust remains unbroken, even in times of uncertainty.
Effective banking leaders must balance three priorities:
Financial stability: Maintaining liquidity, managing risk, and complying with regulations.
Innovation: Adapting to new technologies, customer preferences, and financial products.
Ethics and governance: Ensuring transparency, fairness, and accountability.
2. Historical Evolution of Banking Leadership
The journey of banking leadership reflects the economic evolution of societies.
Traditional Era (Pre-1980s):
Leadership was conservative and stability-oriented. Banks focused on deposits, lending, and government securities. Leaders prioritized compliance and trust-building, as technology played little role.
Liberalization and Globalization (1980s–2000s):
The rise of multinational corporations, stock markets, and deregulation changed everything. Leaders began emphasizing profitability, expansion, and competitive advantage. Figures like Jamie Dimon (JPMorgan Chase) and Deepak Parekh (HDFC) became known for balancing innovation with prudence.
Digital Transformation (2000s–2020s):
The fintech revolution redefined leadership. The focus shifted toward technology adoption, customer experience, and data-driven decisions. Leaders such as Arundhati Bhattacharya (SBI) and Uday Kotak (Kotak Mahindra Bank) showcased how traditional banking could blend with digital dynamism.
Modern Era (Post-COVID-19):
The pandemic tested leadership resilience. Remote banking, cybersecurity, ESG (Environmental, Social, and Governance) goals, and sustainable finance became the new leadership frontiers.
3. Key Traits of Effective Banking Leaders
Modern banking leadership requires a blend of financial expertise, innovation, and empathy. Below are the core traits defining successful leaders in this sector:
Visionary Thinking:
Leaders must foresee economic trends, anticipate risks, and align institutions with long-term goals. Visionary leadership prevents crises and prepares for technological shifts.
Risk Management:
Banking inherently involves risk—credit, market, and operational. Strong leaders build frameworks to manage these efficiently while avoiding overexposure.
Adaptability:
The financial landscape changes fast. Whether it's blockchain, digital currency, or changing regulations, adaptive leaders drive transformation rather than resist it.
Ethical Integrity:
Scandals and frauds can destroy banks overnight. Ethical leadership ensures transparency, compliance, and fair treatment of customers.
Customer-Centric Focus:
Leaders today must prioritize customer needs, from rural financial inclusion to seamless digital experiences.
Team Empowerment:
A strong leader builds strong teams. By fostering skill development and inclusivity, leaders prepare their organizations for sustainable growth.
4. Leadership Models in Banking
Different banks adopt different leadership styles depending on their goals and market conditions:
Transformational Leadership:
Encourages innovation and digital transformation. For example, Satya Nadella’s approach at Microsoft has inspired similar models in financial institutions focusing on culture change.
Servant Leadership:
Focuses on employee welfare and customer satisfaction. Cooperative banks and regional rural banks often follow this model.
Strategic Leadership:
Seen in global banks like HSBC or Citibank, where leaders must balance complex international regulations and strategies.
Crisis Leadership:
Essential during financial downturns, such as the 2008 global crisis. Leaders like Ben Bernanke (Federal Reserve) and Raghuram Rajan (RBI) demonstrated how proactive policy can restore stability.
5. Indian Banking Sector Leadership
India’s banking leadership landscape is a powerful blend of tradition and innovation. Some iconic examples include:
Arundhati Bhattacharya (SBI):
The first woman to lead the State Bank of India, she championed digital banking, improved governance, and promoted women in leadership.
Aditya Puri (HDFC Bank):
Known for building HDFC Bank into India’s most valuable private lender through strict discipline, innovation, and customer focus.
Uday Kotak (Kotak Mahindra Bank):
Pioneered entrepreneurial banking and emphasized capital efficiency and risk management.
Raghuram Rajan (RBI):
Brought global recognition to Indian monetary policy through transparency, macroeconomic stability, and inflation control.
Shaktikanta Das (RBI):
His leadership during the pandemic exemplified resilience—balancing growth and inflation with measured monetary policies.
Indian banking leaders have also pushed for financial inclusion, digitalization (UPI, RuPay), and green finance, making India a model for emerging economies.
6. Challenges Faced by Banking Leaders
Banking leadership today faces complex challenges:
Technological Disruption:
Fintechs and digital wallets are reshaping consumer behavior. Leaders must collaborate rather than compete blindly with fintech firms.
Cybersecurity Threats:
As digital transactions grow, so do cyberattacks. Leadership must invest in secure systems and data protection.
Regulatory Complexity:
Complying with diverse local and international regulations is a balancing act between innovation and compliance.
Economic Volatility:
Interest rate hikes, inflation, and geopolitical tensions test financial resilience.
Talent Retention:
The next generation seeks flexibility and purpose. Modern leaders must create value-driven workplaces.
7. The Future of Banking Leadership
The future of banking leadership will revolve around three pillars: digital intelligence, sustainability, and inclusivity.
Digital Intelligence:
Leaders must master AI, blockchain, and data analytics to personalize banking and improve risk models.
Sustainability and ESG Goals:
Banking leaders will increasingly fund green projects, carbon-neutral businesses, and social initiatives.
Financial Inclusion:
Leadership must ensure banking reaches every citizen, not just urban elites. India’s Jan Dhan Yojana and digital KYC models show what visionary policy can achieve.
Collaborative Ecosystems:
Banks will partner with fintech startups, tech giants, and regulators to build integrated financial ecosystems.
8. Conclusion
Leadership in the banking sector is not just about managing money—it’s about managing trust, technology, and transformation. From managing crises to embracing digital revolutions, banking leaders shape the future of economies. The best leaders combine financial prudence with social responsibility, ensuring that banking remains a force for inclusion and growth.
In a rapidly changing world, where finance merges with technology and sustainability, the next generation of banking leaders must be adaptive visionaries—balancing risk and opportunity, ethics and innovation, profit and purpose. Their success will define not just the future of banks, but the economic destiny of nations.

Chart Patterns Risks Involved
Time Decay: Option value decreases as expiry nears.
Volatility Risk: Rapid volatility changes can affect premiums.
Unlimited Loss for Writers: Option sellers face theoretically unlimited loss potential.
Complexity: Requires strong understanding of pricing and market movement.

Part 2 Identifying Support and ResistanceRisks in Option Trading
While options offer flexibility, they also come with inherent risks:
Time Decay: Option value erodes as expiry nears, especially for buyers.
High Volatility: Sudden volatility spikes can cause unpredictable price swings.
Leverage Risk: Small movements in the underlying can lead to large gains or losses.
Unlimited Loss Potential for Sellers: Option writers face potentially large losses, especially with uncovered (naked) positions.
Liquidity Risk: Some stock options may have wide bid-ask spreads, making entry and exit difficult.
Proper risk management, position sizing, and stop-loss mechanisms are essential for long-term success.

Part 1 Identifying Support and ResistanceWhy Trade Options?
Options serve multiple purposes in modern finance:
Hedging:
Investors use options to protect their portfolios from adverse price movements. For example, a stockholder may buy a put option to guard against a potential price fall.
Speculation:
Traders can speculate on short-term market movements with limited risk and potentially high returns. Buying calls or puts allows traders to profit from expected price directions without owning the underlying asset.
Income Generation:
Selling options (writing covered calls or cash-secured puts) generates regular income through premiums. Many institutional investors use this strategy to enhance portfolio returns.

PCR-basedTradingOption Pricing
Option prices are influenced by several factors, known collectively as the “Greeks.” These variables determine how an option’s value changes with respect to different market conditions.
Delta (Δ): Measures how much an option’s price changes for a ₹1 change in the underlying asset.
Gamma (Γ): Measures the rate of change of Delta.
Theta (Θ): Represents time decay — how much an option loses value as it nears expiry.
Vega (ν): Sensitivity to changes in volatility.
Rho (ρ): Sensitivity to changes in interest rates.
The Black-Scholes model is commonly used to estimate theoretical option prices by combining these factors.

Part 2 Understanding the Structure of a CandlestickKey Terminologies
To understand options deeply, it’s essential to know the following terms:
Strike Price: The fixed price at which the option holder can buy (call) or sell (put) the underlying.
Premium: The price paid by the option buyer to the seller.
Expiry Date: The date on which the option contract expires.
In-the-Money (ITM): A call option is ITM if the underlying price is above the strike price; a put option is ITM if the price is below the strike.
Out-of-the-Money (OTM): The opposite of ITM; when exercising the option would not be profitable.
At-the-Money (ATM): When the underlying price is equal (or close) to the strike price.
Intrinsic Value: The amount by which an option is in the money.
Time Value: The portion of the option’s premium that reflects the time left until expiry and market volatility.

Part 1 Understanding the Structure of a CandlestickHow Option Trading Works
Option trading involves two parties:
Buyer (Holder): Pays a premium to acquire the right to exercise the option.
Seller (Writer): Receives the premium and is obligated to fulfill the contract if the buyer exercises the option.
Unlike stock trading, where the ownership of shares is exchanged, options trading revolves around rights and obligations. The buyer’s risk is limited to the premium paid, while the seller’s risk can be unlimited (especially in naked option writing).

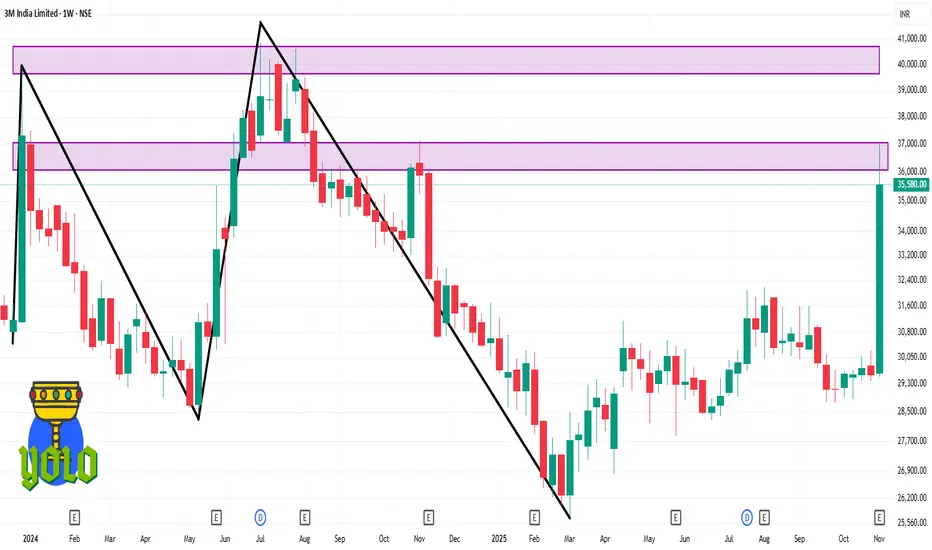
3MINDIA 1 Week Time Frame 📊 1-Week Performance
The stock moved up by ~ +20.37% over the past week.
The current share price is around ₹35,580 (as of 7 Nov 2025) with a small recent pull-back of -0.59%.
It is trading nearer to its 52-week high (~₹37,000) with its 52-week low being ~₹25,718.
HINDALCO 1 Day Time Frame Current price: ~ ₹ 758.05.
Day’s range: Data varies; one source shows a high around ₹ 842.60 and low around ₹ 855.95, though this appears inconsistent.
52-week range: ~ ₹ 546.45 (low) to ~ ₹ 864.00 (high).
Key levels to watch (approximate):
Support: ~ ₹ 750 – ₹ 760
Resistance: ~ ₹ 830 – ₹ 860

Option Buying vs Option Selling in the Indian Market1. Understanding Options in Brief
An option is a financial derivative contract that gives the buyer the right, but not the obligation, to buy or sell an underlying asset (such as Nifty, Bank Nifty, or stocks) at a predetermined price (strike price) before or on a specific date (expiry date).
Call Option (CE): Gives the buyer the right to buy the asset.
Put Option (PE): Gives the buyer the right to sell the asset.
The seller (also known as the writer) of an option, on the other hand, has the obligation to fulfill the contract if the buyer decides to exercise it.
2. Option Buying – The Right Without Obligation
Definition:
When a trader buys an option, they pay a premium to acquire the right to buy (Call) or sell (Put) the underlying asset. This is a leveraged position where the maximum loss is limited to the premium paid.
Example:
Suppose Nifty is trading at 22,000 and a trader buys a 22,000 CE at ₹150. If Nifty rises to 22,400 by expiry, the option may be worth ₹400, giving a profit of ₹250 (₹400 - ₹150).
If Nifty falls or remains below 22,000, the option expires worthless, and the buyer loses ₹150 (premium).
Advantages of Option Buying:
Limited Risk: The maximum loss is limited to the premium paid.
Unlimited Profit Potential: Profits can be substantial if the underlying asset moves sharply in the expected direction.
Leverage: Traders can control large positions with a small amount of capital.
Hedging Tool: Option buyers can hedge existing stock or portfolio positions against adverse movements.
Simplicity: Easier to understand for beginners as risks are predefined.
Disadvantages of Option Buying:
Time Decay (Theta): The value of options erodes as expiry approaches if the price does not move favorably.
Low Probability of Success: Most options expire worthless; hence, consistent profitability is difficult.
Implied Volatility (IV) Risk: A drop in volatility can reduce option prices even if the direction is correct.
Requires Precise Timing: The move in the underlying must be quick and significant to overcome time decay.
3. Option Selling – The Power of Probability
Definition:
Option sellers (writers) receive a premium by selling (writing) options. They are obligated to fulfill the contract if the buyer exercises it. Sellers profit when the market remains stable or moves against the option buyer’s position.
Example:
If a trader sells a Nifty 22,000 CE at ₹150 and Nifty remains below 22,000 till expiry, the seller keeps the entire ₹150 premium as profit. However, if Nifty rises to 22,400, the seller incurs a loss of ₹250 (₹400 - ₹150).
Advantages of Option Selling:
High Probability of Profit: Since most options expire worthless, sellers statistically have better odds.
Benefit from Time Decay: Sellers gain as the option premium reduces with each passing day.
Volatility Advantage: When volatility drops, option prices fall, benefiting sellers.
Range-Bound Profitability: Sellers can profit even in sideways markets, unlike buyers who need strong price movement.
Disadvantages of Option Selling:
Unlimited Risk: Losses can be theoretically unlimited, especially for uncovered (naked) positions.
Margin Requirement: Sellers must maintain significant margin with brokers, reducing leverage.
Emotional Stress: Constant monitoring is needed as rapid moves in the market can cause heavy losses.
Complex Strategies Required: Often, sellers use spreads or hedges to control risk, which requires advanced knowledge.
4. Market Behavior and Strategy Selection
Option Buyers Thrive When:
The market makes sharp and fast movements in a particular direction.
Implied volatility is low before the trade and increases later.
There is a news event or earnings announcement expected to cause large swings.
The trend is strong and directional (e.g., breakout setups).
Example Strategies for Buyers:
Long Call or Long Put
Straddle or Strangle (when expecting volatility)
Call Debit Spread or Put Debit Spread
Option Sellers Succeed When:
The market remains range-bound or moves slowly.
Implied volatility is high at the time of entry and drops later.
Time decay favors them as expiry nears.
The trader expects no major event or breakout.
Example Strategies for Sellers:
Short Straddle / Short Strangle
Iron Condor
Credit Spreads (Bull Put Spread, Bear Call Spread)
Covered Call Writing
5. Role of Implied Volatility (IV) and Time Decay
In the Indian market, IV and Theta play crucial roles in deciding profitability.
For Buyers:
They need an increase in IV (expectation of higher movement). Rising IV inflates option premiums, helping buyers.
For Sellers:
They gain when IV drops (post-event or consolidation), as option prices fall.
Time Decay (Theta) always works against buyers and in favor of sellers. For example, in the last week before expiry, options lose value rapidly if the underlying does not move significantly.
6. Regulatory and Practical Considerations in India
Margins: SEBI’s framework requires SPAN + Exposure margin, making naked selling capital-intensive.
Liquidity: Nifty, Bank Nifty, and FinNifty have high liquidity, making both buying and selling viable.
Taxation: Option profits are treated as business income for both buyers and sellers.
Brokerage and Slippage: Active option sellers often face higher transaction costs due to large volumes.
Retail Participation: Most retail traders prefer buying options due to low capital requirements, while professional traders prefer selling for steady income.
7. Real-World Insights
Around 70–80% of retail traders in India buy options, but most lose money due to time decay and poor timing.
Professional traders and institutions prefer option writing using hedged strategies to generate consistent returns.
Successful traders often combine both — buying for directional plays and selling for income generation.
8. Which Is Better – Buying or Selling?
There’s no one-size-fits-all answer. It depends on market conditions, trading capital, and risk appetite.
If you have small capital, prefer buying options with strict stop-loss and a clear directional view.
If you have large capital and can manage risk with spreads or hedges, selling options can provide consistent returns.
Combining both (for example, selling options in high volatility and buying in low volatility) can create balance.
Conclusion
The debate between option buying and option selling in the Indian market revolves around risk vs. probability. Option buyers enjoy limited risk and unlimited profit potential but low success rates. Option sellers face higher risk but benefit from time decay and probability in their favor.
In essence:
Buy options when expecting a big, fast move.
Sell options when expecting a range-bound or stable market.
A disciplined approach, risk management, and understanding of volatility are the keys to succeeding in either strategy. In the dynamic Indian derivatives market, mastering both sides of the trade — when to buy and when to sell — transforms an ordinary trader into a consistently profitable one.

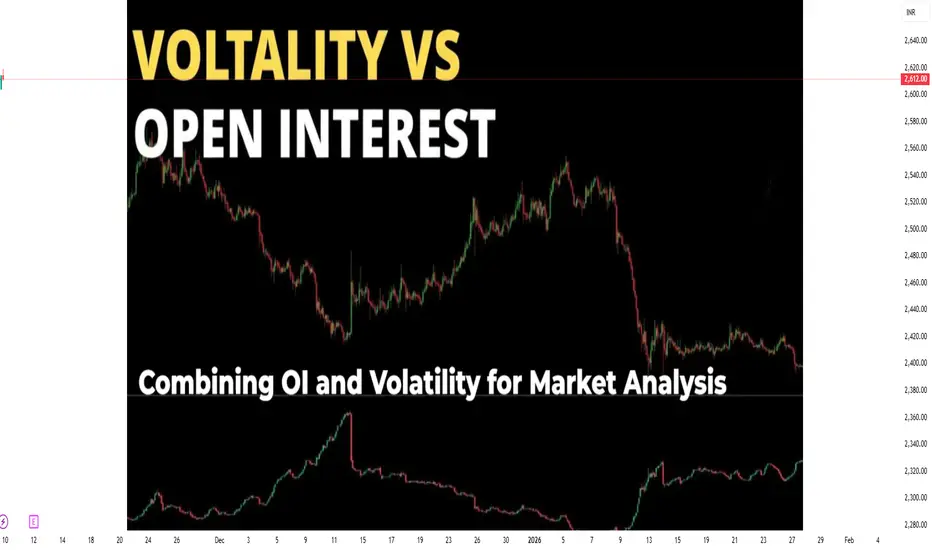
Implied Volatility and Open Interest Analysis1. Understanding Implied Volatility (IV)
Implied Volatility is a metric derived from the market price of options that reflects the market’s expectations of future volatility in the price of the underlying asset. Unlike historical volatility, which measures past price fluctuations, IV is forward-looking—it tells us how much the market expects the asset to move in the future.
Key Characteristics of IV:
Expressed in percentage terms, showing the expected annualized movement in the underlying asset.
Does not predict direction—only the magnitude of expected price swings.
Higher IV means the market expects larger price movements (high uncertainty or fear).
Lower IV means smaller expected price movements (stability or complacency).
Factors Influencing Implied Volatility:
Market sentiment: During uncertainty or events like elections, budgets, or economic announcements, IV tends to rise.
Supply and demand for options: Heavy buying of options increases IV, while heavy selling reduces it.
Time to expiration: Longer-duration options usually have higher IV due to greater uncertainty over time.
Earnings or corporate events: Stocks often show rising IV ahead of quarterly earnings announcements.
2. Interpreting Implied Volatility
High IV Environment:
When IV is high, option premiums are expensive. This generally indicates:
Traders expect significant movement (up or down).
Fear or uncertainty is present in the market.
Volatility sellers (option writers) might see an opportunity to sell overpriced options.
For example, before major events like the Union Budget or RBI policy meeting, IV in Nifty options typically spikes due to the anticipated market reaction.
Low IV Environment:
When IV is low, option premiums are cheaper. This usually means:
The market expects calm or limited movement.
Traders may be complacent.
Volatility buyers might see an opportunity to buy options cheaply before an expected rise in volatility.
Implied Volatility Rank (IVR) and IV Percentile:
IV Rank compares current IV to its range over the past year.
Example: An IV Rank of 80 means current IV is higher than 80% of the past year’s readings.
IV Percentile shows the percentage of time IV has been below current levels.
Both help traders decide if options are cheap or expensive relative to history.
3. Understanding Open Interest (OI)
Open Interest represents the total number of outstanding option or futures contracts that are currently open (not yet closed, exercised, or expired). It indicates the total participation or liquidity in a particular strike or contract.
For example, if a trader buys 1 Nifty 22000 Call and another trader sells it, OI increases by one contract. If later that position is closed, OI decreases by one.
Key Aspects of OI:
Rising OI with rising prices = new money entering the market (bullish).
Rising OI with falling prices = fresh short positions (bearish).
Falling OI with rising or falling prices = unwinding of positions (profit booking or exit).
Stable OI = sideways or consolidating market.
4. How to Read Open Interest Data
OI and Price Relationship:
Price Trend OI Trend Market Interpretation
↑ Price ↑ OI Long build-up (bullish)
↓ Price ↑ OI Short build-up (bearish)
↑ Price ↓ OI Short covering (bullish)
↓ Price ↓ OI Long unwinding (bearish)
For example, if Nifty futures rise by 150 points and OI increases, traders are opening new long positions, suggesting bullishness. But if prices rise while OI falls, short positions are being covered.
5. Using OI in Option Chain Analysis
In options trading, OI is especially useful for identifying support and resistance zones.
High Call OI indicates a potential resistance level because sellers expect the price to stay below that strike.
High Put OI indicates a potential support level because sellers expect the price to stay above that strike.
For instance:
If Nifty has maximum Call OI at 22500 and maximum Put OI at 22000, traders consider this as a range of consolidation (22000–22500).
A breakout above 22500 or breakdown below 22000 with sharp OI changes can signal a shift in trend.
6. Combining IV and OI for Better Insights
Using IV and OI together gives a more complete picture of the market’s mindset.
Scenario 1: Rising IV + Rising OI
Indicates strong speculative activity.
Traders expect big moves, either due to events or upcoming volatility.
Suitable for straddle or strangle buyers.
Scenario 2: Falling IV + Rising OI
Implies calm market conditions with new positions being built.
Traders expect limited movement.
Suitable for option writing strategies (like Iron Condor, Short Straddle).
Scenario 3: Rising IV + Falling OI
Suggests short covering or unwinding due to fear.
Market participants are closing existing positions amid uncertainty.
Scenario 4: Falling IV + Falling OI
Indicates profit booking after a volatile phase.
Usually happens in post-event consolidation.
7. Practical Example: Nifty Option Chain Analysis
Suppose the Nifty 50 index is trading around 22,300.
Strike Call OI Put OI IV (Call) IV (Put)
22,000 4.8 L 6.2 L 15% 16%
22,300 5.5 L 5.1 L 17% 18%
22,500 7.8 L 3.9 L 20% 17%
Here:
Maximum Call OI at 22,500 → Resistance zone.
Maximum Put OI at 22,000 → Support zone.
IV is rising across strikes → traders expect upcoming volatility.
If price moves above 22,500 and Call writers exit (OI drops), while new Put OI builds, it signals a bullish breakout.
8. Role of IV and OI in Strategy Selection
High IV Strategies (Volatile Market):
Buy Straddle or Strangle (expecting large movement)
Calendar Spread
Long Vega strategies
Low IV Strategies (Stable Market):
Iron Condor
Short Straddle
Covered Call
Credit Spreads
OI data helps traders identify which strikes to select for these strategies and where the market might reverse or consolidate.
9. Limitations of IV and OI Analysis
While powerful, both metrics have limitations:
IV can be misleading before major events; it reflects expectations, not certainty.
OI data is end-of-day in many cases, so intraday traders might miss rapid shifts.
Sharp OI changes might also result from rollovers or hedging adjustments, not directional bias.
Hence, traders must use IV and OI along with price action, volume, and trend indicators for confirmation.
10. Conclusion
Implied Volatility and Open Interest form the foundation of options market sentiment analysis.
IV tells us what the market expects to happen in terms of movement magnitude.
OI tells us how much participation or commitment traders have in the current trend.
Together, they reveal a deeper layer of market psychology—identifying whether traders are fearful, greedy, hedging, or speculating.
For successful trading, combining price action + IV + OI enables traders to forecast volatility cycles, confirm trends, and time their entries or exits effectively.
In essence, mastering IV and OI analysis empowers traders to read the invisible hand of market sentiment—a crucial skill for anyone in the derivatives market.
Algorithmic and High-Frequency Trading (HFT) in India1. Understanding Algorithmic Trading
Algorithmic trading refers to the use of computer programs and mathematical models to automate the process of trading financial instruments such as equities, derivatives, currencies, and commodities. Instead of manual execution by human traders, algorithms follow predefined instructions based on time, price, quantity, and other market parameters.
In India, algorithmic trading gained momentum after the Securities and Exchange Board of India (SEBI) permitted it in 2008 for institutional investors. Since then, it has grown exponentially with the adoption of advanced technologies such as Artificial Intelligence (AI), Machine Learning (ML), and Big Data analytics.
Algorithmic trading strategies are typically designed to:
Reduce transaction costs
Minimize human emotions in trading
Execute large orders without disrupting market prices
Capitalize on small, short-lived price inefficiencies
Common strategies include trend-following, statistical arbitrage, mean reversion, market making, and pairs trading.
2. High-Frequency Trading (HFT) Explained
High-Frequency Trading (HFT) is a specialized subset of algorithmic trading characterized by extremely high-speed trade execution, large volumes of orders, and very short holding periods. HFT firms rely on:
Ultra-low latency networks
Co-location facilities (where trading servers are placed near exchange servers)
Advanced algorithms capable of executing thousands of trades per second
The goal of HFT is to profit from microsecond-level market inefficiencies—such as differences in bid-ask spreads, arbitrage opportunities between exchanges, or momentary price dislocations.
In India, HFT is primarily used by institutional investors, proprietary trading firms, and hedge funds that have access to advanced infrastructure and regulatory approvals.
3. Evolution of Algo and HFT in India
India’s journey toward algorithmic and HFT trading began in the late 2000s. The National Stock Exchange (NSE) was among the first to offer Direct Market Access (DMA) and co-location services, enabling institutional participants to connect directly to the exchange infrastructure with minimal latency.
2008: SEBI allowed institutional investors to use algorithmic trading.
2010-2012: Exchanges introduced co-location services and low-latency networks.
2013 onwards: Rapid growth in automated order flow; by some estimates, over 40% of equity and derivatives trades were algorithmically driven.
2020s: Integration of AI, ML, and predictive analytics in trading algorithms.
With rising competition among institutional players, Indian exchanges have continuously upgraded their technology to handle high message traffic, ensuring fairness and stability in automated markets.
4. Key Participants in Indian Algo and HFT Ecosystem
Institutional Investors: Mutual funds, pension funds, and insurance companies use algorithmic systems to execute large orders efficiently.
Proprietary Trading Firms: They rely heavily on HFT and statistical arbitrage strategies to exploit microsecond-level opportunities.
Foreign Institutional Investors (FIIs): Many global firms deploy HFT strategies in Indian markets through subsidiaries or partnerships.
Retail Traders: Although limited, retail participation is increasing through brokers offering API-based trading platforms and algorithmic bots.
Exchanges and Brokers: NSE and BSE provide the technological backbone with co-location and data feed services, while brokers offer execution APIs and backtesting tools.
5. Technological Infrastructure Supporting HFT
The success of algorithmic and HFT trading depends on speed, precision, and data quality. Indian exchanges have developed world-class infrastructure that supports high-frequency trading through:
Co-location facilities for ultra-low latency trading
High-speed fiber-optic and microwave communication networks
Real-time market data feeds with millisecond granularity
Application Programming Interfaces (APIs) for automated order routing
Advanced risk management systems to monitor orders and prevent errors
Additionally, the rise of cloud computing and AI-driven analytics allows traders to process vast volumes of tick-level data and develop predictive models for future price movements.
6. Popular Algorithmic Trading Strategies in India
Several algorithmic strategies are widely employed in Indian markets, including:
Arbitrage Strategies: Exploiting price differences between cash and futures, or across exchanges (NSE vs. BSE).
Market Making: Providing liquidity by continuously quoting buy and sell prices.
Momentum and Trend Following: Identifying and riding price trends using moving averages or momentum indicators.
Statistical Arbitrage: Using quantitative models to exploit temporary price inefficiencies between correlated assets.
News-Based Trading: Using natural language processing (NLP) to react instantly to news or corporate announcements.
7. Regulatory Framework by SEBI
Given the complexity and speed of algorithmic and HFT activity, SEBI plays a critical role in ensuring market integrity and fairness. The regulator has introduced several guidelines, including:
Pre-trade risk checks: To prevent erroneous or large orders that could disrupt markets.
Order-to-trade ratio limits: To control excessive order cancellations by HFT firms.
Unique Algo IDs: Each algorithm must be registered and tested before deployment.
Latency equalization measures: SEBI proposed “random speed bumps” to reduce unfair advantages from co-location.
Surveillance systems: Exchanges continuously monitor unusual order patterns or spoofing activities.
These measures ensure that algorithmic and HFT activities enhance liquidity without introducing instability or manipulation.
8. Benefits of Algorithmic and HFT in Indian Markets
Algorithmic and high-frequency trading have brought several benefits to the Indian financial ecosystem:
Increased Market Liquidity: Continuous order flow ensures tighter bid-ask spreads and efficient execution.
Improved Price Discovery: Algorithms react quickly to new information, making prices more reflective of true value.
Reduced Transaction Costs: Automated execution minimizes human errors and slippage.
Enhanced Market Efficiency: Rapid arbitrage eliminates temporary price discrepancies.
Accessibility for Retail Traders: With new APIs and algo platforms, small traders can deploy systematic strategies.
9. Challenges and Criticisms
Despite its advantages, algo and HFT trading come with significant challenges:
Market Fairness: HFT firms with superior technology can gain an unfair advantage over smaller participants.
Flash Crashes: Erroneous algorithms or feedback loops can cause sudden market volatility.
Systemic Risks: High interconnectivity among automated systems may amplify shocks.
Regulatory Complexity: Constant innovation in trading algorithms challenges regulators to keep up.
Infrastructure Costs: Access to co-location and high-speed data remains expensive, creating barriers for smaller firms.
10. Future Outlook of Algo and HFT Trading in India
The future of algorithmic and HFT trading in India is poised for robust growth, driven by advancements in AI, machine learning, and big data analytics.
Key emerging trends include:
AI-driven Predictive Models: Algorithms capable of learning from historical and real-time data to make adaptive trading decisions.
Blockchain Integration: Transparent and secure transaction systems reducing latency and settlement risk.
API Democratization: Greater access for retail traders through open APIs and low-cost algo platforms.
Smart Regulation: SEBI’s proactive stance on monitoring algorithmic activity while encouraging innovation.
Cross-Asset Automation: Expansion of algorithms to currencies, commodities, and fixed-income markets.
With India’s rapidly digitalizing financial ecosystem and growing participation from domestic and global investors, algorithmic and HFT trading will continue to play a pivotal role in shaping the country’s capital markets.
Conclusion
Algorithmic and High-Frequency Trading represent the cutting edge of financial market evolution in India. They have transformed the landscape of stock trading from human-driven judgment to machine-driven precision and speed. While challenges related to fairness, systemic risk, and infrastructure persist, regulatory oversight by SEBI and technological innovation continue to balance growth with stability.
As India’s markets mature, algorithmic and HFT trading will not only enhance liquidity and efficiency but also position the country as a leading global hub for financial technology innovation—marking a new era of smart, data-driven, and automated trading.
Part 1 Support and Resistance What Are Options?
An option is a financial contract between two parties: the buyer (also called the holder) and the seller (also called the writer). The buyer pays a premium to the seller in exchange for the right to buy or sell the underlying asset at a specified strike price before or on a specified expiration date.
There are two main types of options:
Call Option – gives the buyer the right to buy the underlying asset at the strike price.
Put Option – gives the buyer the right to sell the underlying asset at the strike price.

Understanding How Options Work: Calls and Puts Simplified1. What Are Options?
An option is a type of financial contract that gives the buyer the right, but not the obligation, to buy or sell an underlying asset (like a stock, index, or commodity) at a predetermined price (called the strike price) before or on a specific date (called the expiration date).
Think of options as insurance contracts — they allow you to protect, speculate, or leverage your positions in the market.
The buyer of the option pays a premium (price of the option).
The seller (also called the writer) receives this premium and is obligated to fulfill the contract if the buyer decides to exercise it.
There are two types of options:
Call Option – the right to buy an asset.
Put Option – the right to sell an asset.
2. Call Options Explained (The Right to Buy)
A call option gives the buyer the right to buy an underlying asset at the strike price within a certain period.
Let’s take an example:
Suppose Stock A is trading at ₹100. You buy a call option with a strike price of ₹105 for a premium of ₹3, expiring in one month.
This means:
You pay ₹3 per share for the right to buy Stock A at ₹105 any time before expiry.
If the stock price rises above ₹105, your option gains value because you can buy at ₹105 while the market price is higher.
Scenario 1: Stock goes up to ₹115 before expiry.
You can buy at ₹105 and immediately sell at ₹115 — making a profit of ₹10.
Your net profit = ₹10 (gain) - ₹3 (premium) = ₹7 per share.
Scenario 2: Stock stays below ₹105.
Your option is out of the money (no advantage in exercising it).
You lose only the premium paid (₹3).
So, a call option benefits from rising prices.
3. Put Options Explained (The Right to Sell)
A put option gives the buyer the right to sell an underlying asset at the strike price within a certain period.
Example:
Stock B is trading at ₹100. You buy a put option with a strike price of ₹95 for a premium of ₹2.
This means you have the right to sell Stock B at ₹95 even if the price falls.
Scenario 1: Stock falls to ₹85 before expiry.
You can sell at ₹95 while the market price is ₹85 — gaining ₹10.
Your net profit = ₹10 (gain) - ₹2 (premium) = ₹8 per share.
Scenario 2: Stock stays above ₹95.
You wouldn’t exercise your right to sell at ₹95 when the market offers ₹100.
You lose only the premium (₹2).
So, a put option benefits from falling prices.
4. Understanding Option Premiums
The premium is the price of the option, and it consists of two parts:
Intrinsic Value:
The amount by which an option is in the money.
For a call: Intrinsic Value = Current Price - Strike Price
For a put: Intrinsic Value = Strike Price - Current Price
Time Value:
Extra value because there’s still time left before expiration.
The longer the time to expiry, the higher the premium.
Example: If a call option on Stock A (price ₹110) has a strike of ₹100, it’s already ₹10 in the money. If the premium is ₹12, then ₹10 is intrinsic value and ₹2 is time value.
5. How Option Sellers Make Money
While buyers pay the premium and hope the market moves in their favor, option sellers profit if the market doesn’t move much.
Call Seller (Writer): Hopes the price stays below the strike price.
Put Seller (Writer): Hopes the price stays above the strike price.
If the option expires worthless, the seller keeps the entire premium. However, sellers face unlimited potential losses if the market moves sharply against them — which is why writing options requires higher margin and risk management.
6. Why Traders Use Options
Options are powerful because they offer multiple strategic uses:
a. Hedging (Protection)
Investors use options to protect existing positions.
Example: If you own a stock at ₹100 and fear a short-term decline, you can buy a put option at ₹95. If the stock falls, your put gains, offsetting the loss.
b. Speculation
Traders buy calls if they expect prices to rise or puts if they expect prices to fall. Because options cost less than the actual stock, they allow for higher leverage — magnifying potential returns.
c. Income Generation
Experienced traders sell (write) options to earn premiums, especially in sideways markets. Covered call writing and cash-secured puts are popular income strategies.
7. Option Moneyness: In, At, and Out of the Money
Understanding an option’s moneyness helps evaluate its worth.
In the Money (ITM): Already profitable if exercised.
Call: Market Price > Strike Price
Put: Market Price < Strike Price
At the Money (ATM): Market Price = Strike Price
Out of the Money (OTM): Not profitable if exercised.
Call: Market Price < Strike Price
Put: Market Price > Strike Price
For example, if a stock trades at ₹100:
₹90 call = ITM
₹100 call = ATM
₹110 call = OTM
8. Expiration and Time Decay (Theta Effect)
Every option has an expiration date — after which it becomes worthless.
As time passes, the time value portion of the premium decreases — this is known as time decay or theta.
Time decay accelerates as the option nears expiry. That’s why buyers usually prefer longer durations (more time value), while sellers prefer shorter ones (faster decay).
9. Risk and Reward Profile
Here’s how the payoff works for each type:
Call Buyer: Unlimited profit (as price rises), limited loss (premium).
Call Seller: Limited profit (premium), unlimited loss (if price soars).
Put Buyer: High profit (as price falls), limited loss (premium).
Put Seller: Limited profit (premium), high loss (if price crashes).
This asymmetry is what makes options both powerful and risky.
10. Real-World Example: A Simplified Scenario
Let’s take a complete example:
You believe Reliance Industries (trading at ₹2500) will rise. You buy a call option with a strike of ₹2550, paying ₹40 premium.
If Reliance rises to ₹2650 → Gain = ₹100 - ₹40 = ₹60 profit.
If Reliance stays below ₹2550 → Option expires worthless → Loss = ₹40.
Alternatively, if you think it will fall, you buy a put option with a strike of ₹2450 for ₹35.
If Reliance drops to ₹2350 → Gain = ₹100 - ₹35 = ₹65 profit.
If it stays above ₹2450 → Option expires worthless → Loss = ₹35.
11. Why Understanding Calls and Puts Matters
Options aren’t just tools for speculation — they’re also essential for managing market exposure and improving portfolio efficiency. Once you understand the behavior of calls and puts, you can combine them into advanced strategies like spreads, straddles, or iron condors — each designed for specific market outlooks.
12. Conclusion: Simplifying the Power of Options
At their core, call and put options are about flexibility. They allow you to control an asset without necessarily owning it, limit your downside while amplifying your upside, and customize your market exposure.
Call = Right to Buy (Bullish tool)
Put = Right to Sell (Bearish tool)
By mastering these basics, you lay the foundation for smarter trading decisions — whether your goal is profit, protection, or passive income. In the world of finance, knowledge of options doesn’t just open doors; it gives you the power to design your own opportunities.
The Hidden Potential of the Stock Market1. Beyond the Ticker: The Real Purpose of the Stock Market
At its core, the stock market was never just a gambling table for quick money. It was designed as a mechanism to raise capital for businesses and distribute ownership among the public. Every share you buy represents a slice of a real company—an entity that creates products, provides services, employs people, and drives the economy forward.
This means that by investing in the stock market, you are indirectly participating in the growth of industries—whether it’s technology shaping the digital world, renewable energy driving sustainability, or pharmaceuticals improving global health. The hidden potential here is not just in the price appreciation of a stock, but in the participation in the broader evolution of the global economy.
2. The Power of Compounding: Turning Time into Wealth
One of the greatest secrets of the stock market is the magic of compounding returns. This principle, often called the “eighth wonder of the world,” allows money to grow exponentially over time. When your investments generate earnings, and those earnings in turn generate more earnings, the effect multiplies.
For example, an investor who puts ₹1 lakh into a quality stock portfolio that grows at 12% per year could see that investment become over ₹10 lakh in 20 years—without adding another rupee. This growth doesn’t come from speculation but from patience, discipline, and the market’s natural tendency to reward long-term holders.
The hidden potential of compounding teaches investors that the real power lies not in predicting tomorrow’s market move, but in staying invested through the market’s cycles and letting time do the heavy lifting.
3. The Innovation Engine: How the Market Fuels Progress
Every major technological leap—from smartphones to electric cars—has been powered by capital raised in stock markets. When companies go public through IPOs, they unlock vast sums of money from millions of investors. This funding allows businesses to innovate, expand, and create breakthroughs that reshape industries.
Think of companies like Infosys, TCS, or Reliance Industries in India. Their access to public capital markets has enabled them to scale globally, employ hundreds of thousands, and transform entire sectors. As an investor, owning shares in such companies means being part of that transformative journey.
The hidden potential here lies in innovation ownership—you’re not just buying stock; you’re buying into the future of human progress.
4. Market Volatility: A Masked Opportunity
To many, volatility is the enemy of investing. But to those who understand the market’s hidden potential, volatility is a friend in disguise. Price swings often cause fear, leading many to sell at lows or hesitate during uncertain times. Yet, for disciplined investors, these moments create opportunities to buy strong businesses at discounted prices.
Legendary investor Warren Buffett’s wisdom applies here: “Be fearful when others are greedy, and greedy when others are fearful.” The stock market’s temporary declines are often preludes to long-term gains. Historically, every major crash—from 2008’s financial crisis to 2020’s pandemic slump—was followed by record recoveries.
Thus, the hidden potential of volatility lies in its ability to create entry points for those with patience, courage, and conviction.
5. The Role of Knowledge and Psychology
While financial education is essential, understanding human psychology is equally critical in unlocking the stock market’s hidden potential. Most investors fail not because they lack information, but because they lack emotional control. Fear, greed, and herd mentality can destroy even the most well-researched portfolios.
The best investors know how to separate noise from knowledge. They focus on company fundamentals—earnings, management quality, and long-term prospects—rather than short-term price fluctuations. By mastering emotional discipline, an investor turns the market from a psychological battlefield into a tool for building generational wealth.
In short, the hidden potential of the market can only be revealed when the investor conquers their own impulses.
6. Diversification: The Silent Protector
Another layer of hidden potential lies in the principle of diversification. The stock market offers access to a vast universe of industries, geographies, and asset classes. A well-diversified portfolio not only reduces risk but also enhances returns over time.
By spreading investments across sectors—like banking, FMCG, infrastructure, and IT—investors can protect themselves from downturns in any one industry. Similarly, investing across large-cap, mid-cap, and small-cap stocks balances stability with growth potential.
Diversification transforms the unpredictable nature of markets into a more predictable, manageable wealth-building system.
7. The Rise of Retail Investors and Digital Empowerment
Technology has democratized access to the stock market like never before. Online trading platforms, mobile apps, and educational content have made investing easy and affordable for everyone. The new generation of investors no longer needs to rely solely on brokers or institutions—they can analyze, trade, and invest independently.
This digital revolution is unlocking the hidden potential of millions of small investors. Even with modest sums, retail participants can now build strong portfolios, invest in IPOs, and benefit from real-time market data.
India’s rapid increase in Demat accounts—crossing 150 million by 2025—is proof that the hidden potential of the stock market is reaching the masses. The power once concentrated among the few is now in the hands of everyday people.
8. The Economic Ripple Effect
The hidden potential of the stock market extends beyond personal gains—it has a ripple effect on the entire economy. When markets thrive, companies expand, employment rises, and government revenues grow. Consumer confidence strengthens, creating a positive feedback loop of growth.
Moreover, stock investments help channel domestic savings into productive assets rather than idle deposits. This efficient allocation of capital is what fuels sustainable economic development. Thus, a vibrant stock market is not just a reflection of economic growth—it’s a driver of it.
9. The Future Ahead: Sustainable and AI-Driven Markets
The future of the stock market lies in sustainability, innovation, and technology integration. With AI-driven analysis, data-backed investing, and ESG (Environmental, Social, and Governance) principles gaining traction, markets are becoming smarter and more responsible.
Investors who adapt to these trends can unlock new layers of hidden potential. Green energy companies, tech disruptors, and AI-driven platforms are likely to dominate the next decade. Recognizing these shifts early can be the difference between ordinary returns and extraordinary wealth.
Conclusion: Seeing Beyond the Obvious
The stock market’s hidden potential lies not in daily price swings but in its long-term ability to build wealth, fuel innovation, and shape economies. It rewards those who understand patience over prediction, discipline over emotion, and conviction over fear.
In every market correction lies an opportunity. In every innovation lies a seed of exponential growth. And in every share lies a story—of human ambition, resilience, and progress.
For those who look beyond the numbers and see the narrative, the stock market isn’t just an investment platform—it’s a gateway to limitless potential.
Introduction: India’s Infrastructure Revolution and Market Impac1. The Infrastructure Revolution: A Historical Turning Point
Infrastructure has always been the backbone of economic growth. However, India’s earlier attempts at large-scale infrastructure expansion often suffered from policy bottlenecks, inadequate funding, and execution delays. The recent decade marks a fundamental shift — from fragmented planning to integrated development.
Under initiatives like the National Infrastructure Pipeline (NIP), PM Gati Shakti, and Smart Cities Mission, India is modernizing its roads, railways, ports, and energy networks with unprecedented scale and coordination. The NIP alone envisions an investment of over ₹111 lakh crore across sectors such as energy, transport, water, and social infrastructure by 2025.
This surge is not limited to government spending. Public-Private Partnerships (PPPs), sovereign wealth funds, and global investors are increasingly financing infrastructure projects, drawn by India’s growth potential and improving regulatory frameworks.
2. Policy Push: The Catalyst for Change
The infrastructure revolution owes much to strategic policy direction. The government has implemented structural reforms aimed at accelerating project execution, reducing red tape, and ensuring transparency in tendering and funding.
Some of the most influential initiatives include:
PM Gati Shakti National Master Plan (2021): A digital platform that integrates 16 ministries to ensure coordinated planning and implementation of infrastructure projects.
Bharatmala and Sagarmala Projects: Focused on improving road and port connectivity to enhance logistics efficiency.
Dedicated Freight Corridors (DFCs): Designed to ease congestion on railway lines and boost freight movement.
Smart Cities and AMRUT: Targeted towards urban transformation through improved utilities, mobility, and housing.
National Monetization Pipeline (NMP): Monetizing existing assets to fund new projects, reducing fiscal burden while attracting private capital.
Together, these programs mark a shift from infrastructure “creation” to infrastructure “optimization,” ensuring long-term economic dividends.
3. Economic Impact: A Multiplier for Growth
The infrastructure push has a ripple effect across the economy. Each rupee invested in infrastructure generates a multiplier impact of approximately 2.5 to 3 times on GDP.
Here’s how:
Employment Generation: Large-scale projects create millions of direct and indirect jobs, particularly in construction, manufacturing, and logistics sectors.
Improved Productivity: Efficient logistics and transport reduce travel time, lower costs, and boost competitiveness for businesses.
Urbanization and Real Estate Growth: Enhanced connectivity fuels urban expansion, leading to increased demand for housing, retail, and industrial spaces.
Investment Magnet: Stable infrastructure attracts foreign direct investment (FDI), especially in sectors like manufacturing, renewable energy, and technology parks.
Regional Development: Projects in tier-2 and tier-3 cities are reducing regional disparities, promoting balanced growth.
According to estimates, infrastructure could contribute nearly 10% to India’s GDP by 2030, transforming the nation into a global manufacturing and logistics hub.
4. Stock Market Impact: The Infrastructure Theme Takes Center Stage
India’s stock markets have responded positively to this infrastructure wave. Investors see this as a multi-decade opportunity across several interconnected sectors.
a. Core Infrastructure Stocks
Companies in construction, engineering, and heavy machinery — such as Larsen & Toubro, IRB Infrastructure, KNR Construction, and NBCC — are witnessing strong order inflows and improved margins.
b. Cement and Steel
Demand for building materials is soaring. Cement majors like UltraTech, ACC, and Dalmia Bharat, and steel producers like Tata Steel and JSW Steel, have benefited from the government’s spending spree.
c. Capital Goods and Equipment
Firms like Siemens, ABB India, and Cummins are riding the wave of infrastructure electrification, metro projects, and industrial automation.
d. Logistics and Transport
The development of multi-modal transport networks boosts companies in logistics and warehousing, such as Container Corporation of India, TCI Express, and Adani Ports.
e. Ancillary Sectors
Power, renewable energy, and urban development firms are integral beneficiaries of the infrastructure ecosystem. For instance, NTPC, Power Grid Corporation, and Adani Energy Solutions are vital to India’s grid modernization.
Thus, the infrastructure theme has become one of the strongest investment narratives in India’s equity market, attracting both domestic and foreign institutional investors.
5. Financing the Boom: Innovative Funding Models
Financing India’s infrastructure ambitions requires creativity beyond traditional budget allocations. To address this, the government and private sector are leveraging multiple instruments:
Infrastructure Investment Trusts (InvITs) and Real Estate Investment Trusts (REITs) are unlocking liquidity by monetizing assets like roads, power transmission lines, and commercial real estate.
Green Bonds and Masala Bonds are mobilizing international capital for sustainable projects.
Sovereign Wealth Funds and Pension Funds from countries like Canada, Singapore, and the UAE are increasingly investing in long-term Indian infrastructure assets.
Development Finance Institutions (DFIs), such as the National Bank for Financing Infrastructure and Development (NaBFID), provide specialized financing for large-scale projects.
This diversification of funding sources ensures that India’s infrastructure revolution is both financially sustainable and globally integrated.
6. Challenges on the Road Ahead
Despite remarkable progress, several challenges persist:
Execution Delays: Land acquisition, environmental clearances, and litigation can slow project timelines.
Cost Overruns: Inflation in construction materials and logistical inefficiencies can erode profitability.
Private Participation Risks: Uncertain returns and policy changes can deter private investment.
Skill Shortage: The sector still faces a lack of skilled labor, especially in high-tech construction and project management.
Environmental Concerns: Balancing rapid development with ecological sustainability remains a critical challenge.
Addressing these issues will require continued policy refinement, institutional strengthening, and technological innovation.
7. Future Outlook: India’s Infrastructure Decade
Looking ahead, the 2020s are likely to be remembered as India’s “Infrastructure Decade.” The focus is now expanding beyond traditional construction to include digital infrastructure, green mobility, renewable energy, and sustainable cities.
Digital India and 5G rollout will connect even the remotest regions, enabling inclusive growth.
Renewable energy projects, targeting 500 GW by 2030, will redefine India’s energy landscape.
High-speed rail networks and metro expansion will modernize urban transport.
Smart logistics parks and industrial corridors will make India a global manufacturing powerhouse.
With urbanization accelerating and global investors viewing India as a growth engine, infrastructure will continue to be the foundation of the nation’s economic narrative.
Conclusion: The Market’s Golden Era of Infrastructure
India’s infrastructure revolution is more than a construction story — it’s a transformation of the nation’s economic DNA. It intertwines policy reform, financial innovation, and market opportunity. As roads, railways, ports, and data highways connect the nation, they are also connecting investors to one of the most promising growth stories in the world.
The infrastructure-led growth model not only drives GDP expansion but also deepens India’s capital markets, generates employment, and enhances global competitiveness. For investors and policymakers alike, India’s infrastructure revolution represents both an opportunity and a responsibility — to build a future that is strong, sustainable, and inclusive.
In essence, this is not merely an infrastructure boom; it’s the building of “New India” — brick by brick, byte by byte, and vision by vision.