AI and Data Analytics in Stock Market Decisions1. The Evolution of Stock Market Decision-Making
Traditionally, stock market decisions were made using two major approaches:
Fundamental analysis, which focuses on company performance, earnings, and macroeconomic factors.
Technical analysis, which studies past price and volume patterns to predict future trends.
While both methods remain relevant, they are now enhanced by AI and data analytics. AI can process enormous data sets that humans cannot handle manually, identify hidden correlations, and make decisions based on probabilities rather than assumptions.
The integration of these technologies started with algorithmic trading in the 1990s and has evolved into machine learning-driven trading systems and predictive analytics models in the 21st century.
2. Understanding AI and Data Analytics
Artificial Intelligence (AI) refers to systems that can mimic human intelligence, learn from experience, and make decisions autonomously. In stock trading, AI tools like machine learning (ML), deep learning, and natural language processing (NLP) play vital roles.
Machine Learning (ML): Learns patterns from historical data and applies them to predict future stock price movements.
Deep Learning (DL): Uses neural networks to process large-scale and complex financial data, identifying non-linear relationships.
Natural Language Processing (NLP): Analyzes financial news, social media sentiment, and corporate announcements to gauge market mood.
Data Analytics, on the other hand, involves the collection, cleaning, and analysis of structured and unstructured data to uncover insights. This includes historical price data, earnings reports, economic indicators, and even tweets or headlines.
Together, AI and data analytics form the backbone of quantitative trading, robo-advisory platforms, and automated portfolio management systems.
3. Key Applications of AI and Data Analytics in the Stock Market
a. Predictive Analysis and Price Forecasting
AI models can analyze historical price patterns, volatility, and macroeconomic indicators to forecast short-term and long-term price movements.
For example:
Neural networks detect recurring patterns in stock charts.
Regression models and reinforcement learning algorithms adjust predictions in real time as market conditions change.
b. Sentiment Analysis
NLP-powered tools scan news articles, earnings calls, analyst reports, and social media to measure market sentiment.
A positive sentiment can lead to short-term price surges, while negative buzz can trigger sell-offs. Platforms like Bloomberg and Refinitiv now incorporate AI-based sentiment analytics for traders.
c. Algorithmic and High-Frequency Trading (HFT)
AI-driven algorithmic trading systems execute thousands of trades per second, exploiting minor market inefficiencies.
Algorithms analyze order book data and market microstructure.
AI continuously improves its strategy by learning from past trades.
This minimizes human error and maximizes execution speed and accuracy.
d. Portfolio Management and Robo-Advisors
AI helps investors manage risk and optimize portfolios based on their risk tolerance, investment goals, and market outlook.
Robo-advisors such as Zerodha’s Niyam or international platforms like Betterment and Wealthfront use AI to automatically rebalance portfolios and minimize losses.
e. Fraud Detection and Compliance
AI-powered surveillance systems detect anomalies, such as insider trading, price manipulation, or fraudulent transactions.
Machine learning algorithms monitor trading patterns in real time and alert regulators or brokers to suspicious behavior.
f. Risk Management
AI quantifies risk using predictive models that estimate Value at Risk (VaR), expected shortfall, or drawdown probabilities.
By analyzing correlations and stress scenarios, traders can better prepare for sudden market downturns or black swan events.
4. Role of Big Data in Stock Market Analysis
Modern financial markets produce terabytes of data every day, including:
Price and volume data from multiple exchanges
Corporate filings and earnings reports
Global macroeconomic indicators
Alternative data like satellite images, foot traffic, or credit card transactions
AI and analytics platforms integrate these datasets to extract valuable insights.
For example:
Hedge funds use satellite imagery to estimate retail store performance.
Credit card data is used to forecast quarterly earnings before official reports are released.
This “alternative data revolution” gives institutions an informational edge that traditional analysis cannot provide.
5. Benefits of AI and Data Analytics in Stock Market Decisions
Speed and Efficiency: AI can process millions of data points in seconds, enabling rapid and informed decision-making.
Accuracy: Predictive models reduce human bias and emotional trading.
Automation: Reduces manual analysis and allows automated trade execution.
Risk Reduction: Helps identify potential losses early through predictive risk assessment.
Data-Driven Insights: Converts raw market data into actionable intelligence.
These advantages help both retail traders and institutional investors stay competitive in increasingly complex markets.
6. Limitations and Challenges
Despite their power, AI and analytics tools face several limitations:
Data Quality Issues: Inaccurate or biased data can lead to faulty predictions.
Overfitting: Models that perform well on historical data might fail in live markets due to changing dynamics.
Black Box Problem: Deep learning models often lack interpretability, making it hard to explain why they make certain predictions.
Market Volatility: AI cannot always predict sudden events like geopolitical crises or natural disasters.
Ethical and Regulatory Concerns: Automated trading systems can cause flash crashes or manipulate markets unintentionally.
Hence, while AI enhances decision-making, human oversight remains crucial.
7. The Future of AI in Stock Market Decision-Making
The next phase of financial technology will see even deeper integration of AI, quantum computing, and blockchain in trading ecosystems.
Quantum AI may process financial data exponentially faster, enabling near-instant decision-making.
Explainable AI (XAI) will make algorithms more transparent and trustworthy.
AI-Blockchain integration will ensure secure, auditable, and tamper-proof trading records.
Additionally, personalized AI assistants will help individual investors make smarter decisions based on their unique profiles and preferences.
8. Real-World Examples
JP Morgan’s COiN platform uses AI to review legal documents and extract key data for risk evaluation.
Goldman Sachs’ Marcus employs data analytics for consumer lending and investment recommendations.
Kavout’s Kai Score leverages machine learning to rank stocks based on predictive factors.
Indian brokerages such as Zerodha, Upstox, and ICICI Direct are adopting AI-based tools to help clients identify trading opportunities and manage portfolios efficiently.
9. Conclusion
AI and data analytics have redefined the rules of stock market participation. What was once a game of intuition and experience has now become a science of data, prediction, and automation.
By integrating AI into trading strategies, investors can gain a deeper understanding of market dynamics, identify hidden opportunities, and manage risk with greater precision.
However, successful use of AI in stock market decisions requires a balance between machine intelligence and human judgment. Machines can crunch numbers and identify trends, but human insight, discipline, and adaptability remain irreplaceable.
Ultimately, the collaboration between humans and AI will continue to shape the future of intelligent investing, driving markets toward more efficiency, transparency, and innovation.
Trendlinebounce
Introduction to Indian Financial Markets1. Structure of Indian Financial Markets
The Indian financial market is broadly divided into two segments:
Money Market – Deals with short-term funds (maturity up to one year).
Capital Market – Deals with long-term funds (maturity more than one year).
Each of these segments has multiple sub-markets and instruments designed to cater to specific financial needs.
2. Money Market
The money market provides liquidity for the economy by enabling short-term borrowing and lending. It is crucial for maintaining the stability of financial institutions and ensuring that businesses and the government have access to short-term financing.
Key Instruments of the Money Market:
Treasury Bills (T-Bills): Issued by the Reserve Bank of India (RBI) on behalf of the government for short-term borrowing.
Commercial Papers (CP): Unsecured promissory notes issued by corporations to raise short-term funds.
Certificates of Deposit (CD): Negotiable time deposits issued by commercial banks.
Call and Notice Money: Very short-term loans between banks to manage daily liquidity needs.
Repurchase Agreements (Repo and Reverse Repo): Short-term borrowing/lending against government securities.
The money market in India is regulated by the Reserve Bank of India (RBI), which ensures stability, transparency, and adequate liquidity.
3. Capital Market
The capital market facilitates the raising of long-term capital by companies and governments through the issue of shares, bonds, and other securities. It also provides investors with opportunities to earn returns by investing in these instruments.
The capital market is divided into two segments:
Primary Market: Where new securities are issued (Initial Public Offerings or IPOs).
Secondary Market: Where existing securities are traded (Stock Exchanges).
Major Institutions in the Capital Market:
Stock Exchanges: The two leading stock exchanges are the Bombay Stock Exchange (BSE) and the National Stock Exchange (NSE).
Securities and Exchange Board of India (SEBI): The regulatory authority overseeing capital markets to protect investors and promote fair trading.
Depositories: Institutions like NSDL (National Securities Depository Limited) and CDSL (Central Depository Services Limited) that facilitate electronic holding and transfer of securities.
Key Instruments of the Capital Market:
Equity Shares: Represent ownership in a company.
Debentures and Bonds: Long-term debt instruments.
Mutual Funds: Investment vehicles pooling funds from multiple investors.
Derivatives: Financial contracts like futures and options that derive value from underlying assets.
Exchange-Traded Funds (ETFs): Funds traded on exchanges like stocks.
4. Role of Financial Institutions
A variety of institutions operate within the Indian financial market to ensure smooth functioning and growth:
Banks: The backbone of the financial system, offering deposit, credit, and investment services.
Non-Banking Financial Companies (NBFCs): Provide credit and financial services outside the traditional banking system.
Insurance Companies: Mobilize long-term funds through life and general insurance.
Mutual Funds and Asset Management Companies (AMCs): Provide collective investment options.
Development Financial Institutions (DFIs): Such as NABARD, SIDBI, and EXIM Bank, which support industrial, agricultural, and export financing.
5. Regulatory Framework
The Indian financial market is regulated by several key institutions to maintain transparency, protect investors, and ensure financial stability:
Reserve Bank of India (RBI): Regulates the banking system and money market, controls inflation, and manages monetary policy.
Securities and Exchange Board of India (SEBI): Regulates the capital market and protects investor interests.
Insurance Regulatory and Development Authority of India (IRDAI): Supervises the insurance sector.
Pension Fund Regulatory and Development Authority (PFRDA): Oversees pension funds and the National Pension System (NPS).
Ministry of Finance (MoF): Frames financial policies and oversees public finances.
These institutions collectively ensure that India’s financial markets remain efficient, stable, and globally competitive.
6. Evolution of Indian Financial Markets
India’s financial market has undergone significant transformation over the past few decades:
Pre-Liberalization Era (Before 1991): The market was tightly regulated with limited investment options and government-controlled interest rates.
Post-Liberalization Era (After 1991): Economic reforms introduced free-market mechanisms, liberalized capital inflows, and promoted private sector participation.
Technological Advancements: The introduction of electronic trading, online demat accounts, and real-time settlement systems improved efficiency and transparency.
Global Integration: Increased participation by foreign institutional investors (FIIs) and global listing opportunities expanded India’s financial reach.
Today, India’s financial markets are well-diversified, globally recognized, and supported by a robust technological and regulatory framework.
7. Participants in Indian Financial Markets
The Indian financial ecosystem comprises various participants:
Retail Investors: Individuals investing in shares, mutual funds, and bonds.
Institutional Investors: Entities like mutual funds, insurance companies, pension funds, and banks.
Foreign Investors: Including Foreign Institutional Investors (FIIs) and Foreign Portfolio Investors (FPIs).
Corporate Entities: Raising capital through equity or debt.
Government: Issuing securities to finance public expenditure.
Each participant contributes to market liquidity, depth, and efficiency.
8. Importance of Indian Financial Markets
The financial market plays a crucial role in the nation’s economic framework:
Mobilization of Savings: Channels individual and institutional savings into productive investments.
Efficient Resource Allocation: Ensures funds flow to sectors with higher growth potential.
Capital Formation: Encourages entrepreneurship and industrial expansion.
Price Discovery: Reflects economic trends through demand and supply of securities.
Economic Stability: Helps manage inflation, liquidity, and interest rates.
Wealth Creation: Offers opportunities for individuals and institutions to build financial assets.
9. Challenges Facing Indian Financial Markets
Despite progress, the Indian financial system faces several challenges:
Financial Illiteracy: A large portion of the population remains unaware of investment opportunities.
Regulatory Complexity: Multiple regulators can sometimes lead to overlapping responsibilities.
Market Volatility: Global economic uncertainty affects capital inflows and investor sentiment.
Limited Depth in Bond Market: The corporate bond market remains underdeveloped compared to equity markets.
Technology Risks: Increased digitalization exposes markets to cyber threats.
Efforts are ongoing to address these challenges through reforms, education, and stronger governance.
10. Future of Indian Financial Markets
The future of Indian financial markets looks promising. With initiatives like Digital India, Financial Inclusion (Jan Dhan Yojana), and Unified Payments Interface (UPI), India is building a modern, inclusive, and technology-driven financial system.
The rise of fintech startups, blockchain applications, and AI-driven analytics is expected to enhance transparency, speed, and participation. Moreover, India’s growing middle class and global economic presence are likely to attract more domestic and international investments.
Conclusion
The Indian financial market stands as a cornerstone of the country’s economic engine. From traditional banking to sophisticated capital market instruments, it provides a dynamic platform for growth, investment, and innovation. Supported by strong regulatory institutions like the RBI and SEBI, and driven by technology and globalization, India’s financial markets continue to evolve rapidly.
As India progresses toward becoming a $5 trillion economy, a robust, transparent, and inclusive financial system will remain essential to sustain growth, attract investments, and empower millions of citizens to participate in the nation’s economic journey.

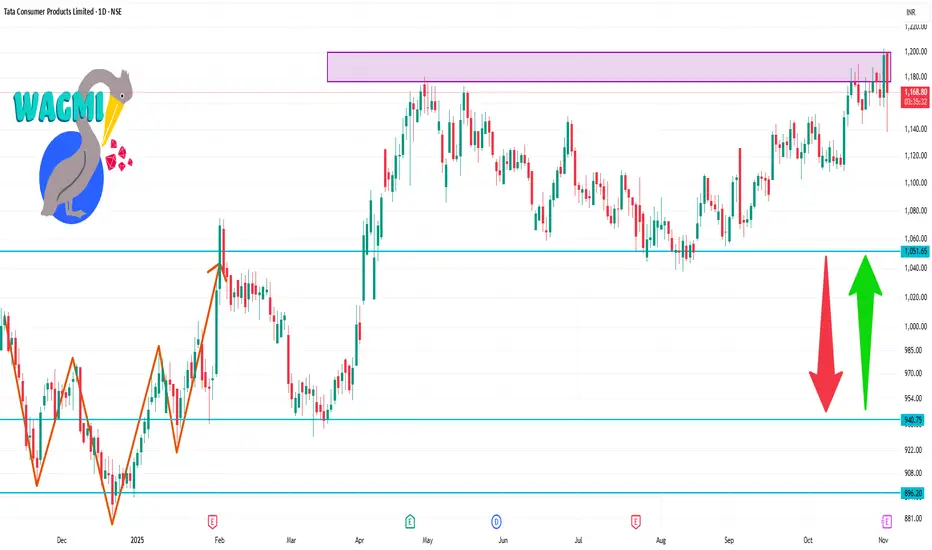
TATACONSUM 1 Day Time Frame 📊 Current Price Snapshot
Last traded around ₹ 1,155.30 on the NSE.
Day’s trading range (approx) ~ ₹ 1,157.20 to ₹ 1,169.40.
52-week range: ~ ₹ 882.90 (low) to ~ ₹ 1,191.20 (high).
🔍 Important Support & Resistance Levels
Resistance: ~ ₹ 1,170-1,190 zone (recent highs near 1,191).
Immediate Support: ~ ₹ 1,140-1,150 (recent price clustering).
Secondary Support: ~ ₹ 1,110-1,120 (if the first support fails).
Major Structural Support: ~ ₹ 1,020-1,030 (in case of deeper correction).
Part 8 Trading Master Class With ExpertsTypes of Options Based on Exercise Style
Options can also differ based on when they can be exercised:
American Options: Can be exercised any time before expiry (used in U.S. markets).
European Options: Can only be exercised on the expiry date (common in India and Europe).
On Indian exchanges like NSE, most index and stock options are European-style.

Options Trading StrategiesIntroduction
Options trading has evolved into one of the most dynamic and flexible segments of the financial markets. Unlike straightforward stock trading, where you buy or sell shares, options trading gives traders the ability to structure positions that benefit from different market conditions — bullish, bearish, neutral, or volatile.
An option is a derivative contract that gives the holder the right, but not the obligation, to buy or sell an underlying asset (such as a stock, index, or commodity) at a specified price (called the strike price) before or on a particular date (called the expiry date).
Understanding and applying options trading strategies can allow traders to control risk, enhance returns, and profit even when the market moves sideways — a flexibility unmatched in other financial instruments.
1. Understanding the Basics of Options
Before diving into strategies, it’s crucial to grasp the fundamentals.
a. Types of Options
There are two main types of options:
Call Option: Gives the buyer the right to buy the underlying asset.
Put Option: Gives the buyer the right to sell the underlying asset.
b. Key Terminologies
Premium: The price paid for the option.
Strike Price: The price at which the holder can buy or sell.
Expiration Date: The date when the option contract expires.
In-the-Money (ITM): When exercising the option is profitable.
Out-of-the-Money (OTM): When exercising the option would result in a loss.
At-the-Money (ATM): When the strike price equals the market price.
c. Participants in Options Market
Buyers (Holders): Have limited risk (premium paid) but unlimited profit potential (for calls).
Sellers (Writers): Have limited profit (premium received) but potentially unlimited risk.
2. Why Use Options?
Options offer multiple strategic advantages:
Hedging: Protect an existing position against adverse price moves.
Speculation: Profit from market direction or volatility.
Income Generation: Earn premiums through writing options.
Leverage: Control a large position with limited capital.
Portfolio Flexibility: Create payoff structures that match specific market views.
3. Classification of Options Trading Strategies
Options strategies can be broadly divided based on market outlook and complexity.
A. Based on Market View
Bullish Strategies – Expecting prices to rise.
Bearish Strategies – Expecting prices to fall.
Neutral Strategies – Expecting limited price movement.
Volatility Strategies – Expecting large or small market swings.
B. Based on Construction
Single-Leg Strategies: Using one option (e.g., Buy Call).
Multi-Leg Strategies: Combining multiple options to shape risk and reward (e.g., Bull Spread, Iron Condor).
4. Popular Bullish Option Strategies
When a trader expects the underlying asset to rise in price, these strategies can be used:
a. Long Call
Structure: Buy a Call Option.
Objective: Profit from a strong upward move.
Risk: Limited to the premium paid.
Reward: Unlimited upside potential.
Example: Buy 1 NIFTY 22,000 Call at ₹100 when NIFTY = 21,800.
If NIFTY rises to 22,500, the call becomes worth ₹500 — a significant gain.
b. Bull Call Spread
Structure: Buy one Call (lower strike) and Sell one Call (higher strike).
Objective: Profit from a moderate rise in the underlying.
Risk: Limited to net premium paid.
Reward: Capped at the difference between strikes minus premium.
Example:
Buy 22,000 Call @ ₹100
Sell 22,200 Call @ ₹50
Net Cost = ₹50
Max Profit = ₹150 – ₹50 = ₹100
c. Bull Put Spread
Structure: Sell a Put (higher strike) and Buy a Put (lower strike).
Objective: Earn income with limited risk if prices rise or stay stable.
Risk: Difference in strike prices minus premium received.
Reward: Limited to net premium received.
5. Popular Bearish Option Strategies
These are used when expecting prices to decline.
a. Long Put
Structure: Buy a Put Option.
Objective: Profit from a fall in the underlying.
Risk: Limited to premium paid.
Reward: Substantial, as the price can fall sharply.
Example: Buy NIFTY 22,000 Put at ₹120.
If NIFTY falls to 21,500, the Put’s value jumps to ₹500.
b. Bear Put Spread
Structure: Buy a Put (higher strike) and Sell a Put (lower strike).
Objective: Profit from a moderate price decline.
Risk: Limited to net premium paid.
Reward: Limited to the difference in strike prices minus premium.
c. Bear Call Spread
Structure: Sell a Call (lower strike) and Buy a Call (higher strike).
Objective: Earn premium when expecting limited or downward movement.
Risk: Limited; capped by the spread between strikes.
Reward: Limited to premium received.
6. Neutral or Range-Bound Strategies
When the trader expects the market to stay within a range, the goal is to profit from time decay or lack of volatility.
a. Iron Condor
Structure: Combine a Bull Put Spread and a Bear Call Spread.
Objective: Profit if the price remains within a defined range.
Risk: Limited to the width of spreads minus total premium received.
Reward: Limited to the total premium collected.
This is a popular non-directional strategy among experienced traders.
b. Butterfly Spread
Structure: Combination of three strike prices — Buy 1 ITM option, Sell 2 ATM options, Buy 1 OTM option.
Objective: Profit from minimal price movement around a central strike.
Risk: Limited to premium paid.
Reward: Limited but high if price closes near middle strike.
c. Calendar (Time) Spread
Structure: Buy a long-term option and sell a short-term option at the same strike.
Objective: Profit from time decay and stability in price.
Risk: Limited to net debit.
Reward: Moderate, depending on volatility and expiry behavior.
7. Volatility-Based Strategies
These strategies are not focused on direction but rather on how much the market moves.
a. Long Straddle
Structure: Buy 1 Call + 1 Put at the same strike and expiry.
Objective: Profit from large movements in either direction.
Risk: Limited to total premium paid.
Reward: Unlimited on upside or significant downside.
Ideal during major announcements or earnings results.
b. Long Strangle
Structure: Buy 1 OTM Call and 1 OTM Put.
Objective: Profit from high volatility or large price swings.
Risk: Lower cost than Straddle, but needs bigger move to profit.
Reward: Unlimited upside and substantial downside potential.
c. Short Straddle / Short Strangle
Structure: Sell both options (Call and Put).
Objective: Profit from low volatility and time decay.
Risk: Unlimited if market breaks out sharply.
Reward: Limited to premium received.
Used primarily by experienced traders who can manage risk closely.
8. Advanced Multi-Leg and Professional Strategies
a. Iron Butterfly
Structure: Combines aspects of Butterfly and Iron Condor.
Objective: Profit from minimal movement with higher premium capture.
Reward/Risk: Both limited; works best in stable markets.
b. Ratio Spreads
Structure: Buy 1 option and Sell multiple options of another strike.
Objective: Earn higher returns in mildly trending markets.
Risk: Can become unlimited if price moves sharply beyond expected range.
c. Covered Call
Structure: Own the underlying stock + Sell a Call Option on it.
Objective: Generate steady income from held positions.
Risk: Limited downside from stock, capped upside.
Best For: Long-term investors seeking extra yield.
d. Protective Put
Structure: Buy a Put while holding the stock.
Objective: Hedge downside risk (like an insurance policy).
Risk: Premium cost, but protection against steep losses.
9. Risk Management in Options Trading
Even the best strategy can fail without proper risk control.
Follow these golden principles:
Use position sizing – Don’t allocate more than 2–5% of capital per trade.
Set stop-loss levels – Define exit levels before entering.
Avoid over-leverage – Options are leveraged instruments; misuse can lead to rapid losses.
Monitor volatility – Volatility spikes can distort premiums.
Backtest and paper trade before going live.
Use hedging to balance directional exposure.
10. Choosing the Right Strategy
Selecting an options strategy depends on:
Market View: Bullish, Bearish, Neutral, or Volatile.
Risk Appetite: Conservative vs. Aggressive.
Time Horizon: Short-term trades vs. longer-term positions.
Volatility Levels: High volatility favors selling; low volatility favors buying.
For example:
Expecting big move? → Long Straddle or Strangle.
Expecting stability? → Iron Condor or Butterfly.
Expecting a mild uptrend? → Bull Call Spread.
Expecting moderate decline? → Bear Put Spread.
11. Common Mistakes to Avoid
Ignoring implied volatility before trading.
Using naked options without capital cushion.
Overtrading during volatile sessions.
Holding OTM options till expiry hoping for miracle moves.
Not considering time decay.
Skipping risk-reward calculations.
12. Practical Application and Example
Imagine NIFTY is at 22,000, and you expect a modest rise in two weeks.
You buy 22,000 Call @ ₹100
You sell 22,200 Call @ ₹50
→ Bull Call Spread.
If NIFTY closes at 22,300, your profit = ₹150 – ₹50 = ₹100 per unit.
If it falls, your loss = ₹50 (the premium net paid).
Thus, a defined risk and reward structure makes this strategy ideal for disciplined traders.
Conclusion
Options Trading Strategies open a vast field of opportunities for traders to profit from every kind of market — up, down, or sideways. What makes options powerful is their flexibility, limited-risk nature, and ability to hedge existing portfolios.
However, success in options trading doesn’t come from luck; it arises from understanding market structure, volatility, time decay, and disciplined execution. Traders who master both the art and science of strategy selection, risk management, and psychology can turn options into a consistent and powerful trading edge.
In essence, options trading is not about predicting the market but preparing for it.

Part 2 Intraday Master ClassStrategies in Option Trading
Options allow traders to build strategies tailored to market views—bullish, bearish, or neutral.
Some popular strategies include:
Covered Call: Selling a call option while holding the underlying asset to earn extra income.
Protective Put: Buying a put option to hedge against possible losses in a stock you own.
Straddle: Buying both a call and a put with the same strike and expiry to profit from volatility.
Strangle: Similar to a straddle but with different strike prices for the call and put.
Iron Condor: Combining multiple options to profit from low volatility conditions.
Such strategies help traders control risk and maximize profits under different market scenarios.

Future Outlook: Sustaining the IPO and SME Momentum1. The Current Landscape: A Golden Era of Listings
Over the last few years, India’s IPO market has seen an unprecedented rise in activity. From digital-first startups to traditional manufacturers, companies of all sizes have turned to public markets to raise growth capital. The mainboard has been dominated by big-ticket issues from established corporations, while the SME segment—once overlooked—has emerged as a thriving hub of entrepreneurial listings.
According to data from stock exchanges, the SME IPO segment alone has outperformed expectations, with subscription levels often reaching several hundred times the offer size. The growing investor base, increased participation of retail and HNI investors, and digital platforms simplifying IPO applications have all contributed to this boom.
For SMEs, going public is not just about capital—it is a signal of credibility and stability. Listing on the NSE Emerge or BSE SME platforms allows smaller firms to attract investors, improve transparency, and access long-term funding that can drive business expansion.
2. Drivers Behind the IPO and SME Boom
Several macroeconomic and structural factors have contributed to the ongoing surge:
a. Economic Growth and Confidence
India’s steady GDP growth, expanding middle class, and digital transformation have fostered an environment where both investors and businesses feel optimistic about the future. Companies view the stock market as a vital source of capital, while investors see it as a means to participate in the nation’s growth story.
b. Regulatory Support
The Securities and Exchange Board of India (SEBI) has played a pivotal role by introducing reforms to streamline IPO processes, enhance disclosure norms, and strengthen investor protection. The SME platform, in particular, was designed to give smaller businesses a simplified path to listing without the burden of excessive compliance.
c. Retail Investor Participation
A massive influx of new retail investors, driven by fintech innovations and easy access to trading apps, has transformed the market landscape. The democratization of stock investing has increased demand for new IPOs, especially those offering early-stage growth potential.
d. Favorable Liquidity and Low Interest Rates
In recent years, global liquidity and relatively low domestic interest rates have made equities a preferred asset class. Investors, in search of better returns, have flocked to IPOs—especially those showing strong fundamentals and growth prospects.
e. Rise of Domestic Institutional Investors
Domestic mutual funds, insurance companies, and pension funds have become significant participants in IPOs, lending stability and depth to the market. Their involvement ensures that quality issues receive sustained institutional backing.
3. The SME Edge: Empowering Grassroots Entrepreneurship
The SME platform is not just a mini version of the mainboard—it is a catalyst for grassroots economic growth. For small and medium enterprises, traditional financing options like bank loans are often limited due to lack of collateral or credit history. IPOs provide an alternative route to raise equity without diluting too much control or taking on debt.
Moreover, SMEs listed on the exchange gain visibility, attract partnerships, and establish brand credibility. Sectors such as manufacturing, IT services, pharmaceuticals, textiles, and renewable energy have been particularly active in this space.
The success of SME IPOs also reflects a shift in investor mindset. Investors are no longer solely focused on large-cap blue chips—they are now looking for early-stage growth stories that can multiply wealth over time. This behavioral change is instrumental in sustaining the SME ecosystem.
4. Challenges That Could Test the Momentum
While the outlook appears promising, sustaining the current momentum will not be without challenges.
a. Market Overvaluation
A surge in IPOs often brings with it concerns about inflated valuations. Companies may take advantage of bullish sentiment to price their offerings aggressively, leaving little room for post-listing gains. If too many IPOs underperform after listing, investor confidence can quickly erode.
b. Quality and Governance Concerns
Not all SMEs meet high corporate governance standards. Weak accounting practices, lack of transparency, or promoter-driven decision-making can hurt long-term investor trust. Regulators and exchanges need to ensure strict eligibility norms and monitoring.
c. Investor Overexuberance
Retail investors sometimes chase IPOs purely for short-term listing gains rather than evaluating fundamentals. This speculative behavior can lead to volatility and mispricing, potentially distorting the true value of companies.
d. Global Economic Uncertainty
External shocks—like rising oil prices, interest rate hikes in developed markets, or geopolitical tensions—can impact foreign inflows and dampen market sentiment. The IPO market, being sentiment-driven, is highly sensitive to such macro events.
e. Liquidity Constraints in SME Segment
Despite high subscription levels, secondary market liquidity in SME stocks remains limited. Thin trading volumes can make price discovery difficult, deterring institutional investors from entering the space.
5. The Role of Policy and Regulation in Sustaining Growth
To maintain the momentum in the IPO and SME markets, regulatory foresight and market discipline are crucial.
a. Strengthening Disclosure Norms
SEBI and stock exchanges must continue refining disclosure requirements, ensuring that companies provide detailed, accurate, and timely information. This helps investors make informed decisions and reduces the risk of mispricing.
b. Enhancing Market Infrastructure
Encouraging more market makers, improving liquidity mechanisms, and enabling seamless migration from SME platforms to the mainboard can sustain investor confidence and ensure market depth.
c. Investor Education
Empowering retail investors through awareness programs about risk management, valuation analysis, and long-term investing can reduce speculative tendencies. Financial literacy is vital for a healthy IPO ecosystem.
d. Supporting SME Ecosystem Development
Beyond listing, SMEs require policy support in areas like taxation, innovation funding, and export facilitation. A holistic ecosystem that nurtures entrepreneurship will naturally feed into the SME IPO pipeline.
6. Technological and Digital Innovations: The New Growth Lever
Technology is transforming how IPOs are managed, subscribed, and analyzed. Online platforms and digital brokers now enable seamless IPO participation with UPI integration, faster refunds, and transparent allotment processes.
Moreover, data analytics and AI-driven investment tools are helping investors assess company fundamentals more efficiently.
In the SME segment, digital transformation is allowing small firms to manage compliance, financial reporting, and investor relations more effectively. Blockchain-based record-keeping and e-KYC systems are further reducing operational risks and increasing trust in market systems.
As India continues to digitalize, technology will remain a cornerstone of the IPO ecosystem—driving transparency, reducing costs, and expanding investor access.
7. The Road Ahead: Building Sustainable Growth
Sustaining the IPO and SME momentum requires balance. A mature market is not one that constantly breaks records in listing numbers—but one that ensures the right companies, backed by solid fundamentals, reach investors at the right valuations.
a. Quality over Quantity
Regulators, underwriters, and exchanges should prioritize quality listings over mere volume. Encouraging companies with strong governance, profitability, and long-term growth potential ensures the integrity of the market.
b. Encouraging Long-Term Investment
Tax incentives or special frameworks for long-term investors in SMEs could encourage patient capital. Such measures can stabilize prices and encourage genuine ownership rather than speculative flipping.
c. ESG and Sustainability Focus
As global investors increasingly emphasize Environmental, Social, and Governance (ESG) factors, Indian IPOs and SMEs must align with these trends. Companies that adopt sustainable practices are more likely to attract foreign institutional capital.
d. Regional and Sectoral Diversification
Encouraging listings from tier-2 and tier-3 cities, as well as from sunrise sectors such as green energy, electric mobility, and digital infrastructure, can diversify the IPO landscape. This not only broadens economic participation but also decentralizes wealth creation.
8. Global Lessons: Learning from Mature Markets
India can draw valuable insights from global markets like the U.S. NASDAQ or Japan’s JASDAQ, where smaller enterprises have long leveraged capital markets for growth. These platforms emphasize strict listing standards, investor transparency, and efficient migration to larger exchanges.
Adopting similar best practices can strengthen India’s SME framework, making it globally competitive. Moreover, cross-border listings or foreign investor participation in SMEs can provide additional depth and capital flow.
9. Investor Sentiment and the Cycle of Confidence
At the heart of every IPO wave lies investor sentiment. Confidence breeds participation, and participation fuels growth. As long as investors continue to see tangible value creation—through robust earnings, transparent management, and steady post-listing performance—the momentum will sustain.
However, maintaining this sentiment requires market discipline. Regulators must curb speculative excesses, companies must deliver on promises, and investors must remain rational and informed.
10. Conclusion: The Path to a Resilient IPO and SME Ecosystem
The future of India’s IPO and SME markets is undoubtedly bright, but sustaining their growth demands maturity and foresight. The foundation has been laid—a dynamic entrepreneurial ecosystem, supportive regulations, and a digitally empowered investor base. The next phase must focus on strengthening fundamentals, promoting transparency, and fostering long-term value creation.
If India continues to blend innovation with discipline, its capital markets could evolve into one of the most robust and inclusive ecosystems globally. The IPO and SME momentum, therefore, is not just a passing phase—it represents the evolution of India’s financial identity, empowering both enterprises and investors to participate in the country’s growth journey.
The challenge ahead lies not in maintaining speed, but in ensuring direction—toward a sustainable, transparent, and inclusive market that stands the test of time.

Impact of Macro Events on Financial MarketsIntroduction
Financial markets are highly sensitive ecosystems that respond to a wide range of macroeconomic events. These events — such as changes in inflation, interest rates, GDP growth, geopolitical tensions, trade policies, or natural disasters — influence the way investors perceive risk and return. In simple terms, macro events set the tone of the market. They shape investor confidence, capital flows, and ultimately determine the direction of asset prices across equities, bonds, currencies, and commodities.
Understanding how macro events move markets is essential for traders, investors, and policymakers. This knowledge allows them to anticipate volatility, manage risk, and make informed decisions in a constantly changing global environment.
1. What Are Macro Events?
Macro events are large-scale economic or geopolitical developments that affect the overall economy rather than individual companies or sectors. These can be economic, political, or environmental in nature. Examples include:
Central bank monetary policy decisions (like interest rate hikes or cuts)
Fiscal policies (government spending and taxation)
Inflation and unemployment data releases
Global trade agreements or disputes
Natural disasters or pandemics
Political instability or wars
Technological disruptions or regulatory reforms
Each of these events sends ripples through financial systems — influencing investor sentiment, liquidity, and valuation across global markets.
2. The Economic Indicators That Drive Market Sentiment
Economic indicators are the heartbeat of financial markets. Investors closely monitor data releases to gauge the health of the economy and anticipate future policy moves. Some key indicators include:
a. Gross Domestic Product (GDP)
GDP growth signals the strength of an economy.
Rising GDP usually means higher corporate profits and stock market optimism.
Falling GDP or recessionary signs can push investors toward safer assets like government bonds or gold.
b. Inflation
Inflation reflects the general rise in prices of goods and services.
High inflation erodes purchasing power and prompts central banks to raise interest rates.
Low inflation can indicate weak demand and slow growth.
Both extremes can unsettle investors, as they affect future earnings and the cost of borrowing.
c. Interest Rates
Interest rate changes are one of the most direct macroeconomic influences on markets.
Rising rates make borrowing costlier and reduce the appeal of riskier assets like equities.
Falling rates encourage investment and consumption, often boosting stock prices.
d. Employment Data
Strong employment reports signal a healthy economy, but they can also increase fears of inflation and potential rate hikes. Weak job data, on the other hand, can trigger fears of slowdown but also raise expectations for policy support.
e. Consumer Confidence
This measures how optimistic consumers are about their financial situation and the overall economy. High confidence supports spending and market growth, while low confidence can lead to declines in demand and market pessimism.
3. Central Banks and Monetary Policy
The role of central banks — such as the U.S. Federal Reserve, European Central Bank (ECB), or the Reserve Bank of India (RBI) — cannot be overstated. Through monetary policy tools, they control liquidity and influence interest rates, inflation, and currency value.
Tight Monetary Policy: When inflation rises, central banks often raise interest rates or reduce liquidity. This makes credit more expensive, curbing excessive speculation. Equity markets typically react negatively as borrowing costs rise and corporate profits shrink.
Loose Monetary Policy: When economic growth slows, central banks lower interest rates or engage in quantitative easing (injecting liquidity into the system). This usually boosts market sentiment, as investors chase higher returns in equities and other risk assets.
For instance, the U.S. Federal Reserve’s aggressive rate hikes in 2022 to combat inflation triggered global stock market corrections and strengthened the U.S. dollar — affecting emerging market currencies and global capital flows.
4. Fiscal Policy and Its Market Impact
While central banks handle monetary policy, governments influence markets through fiscal policy — by adjusting taxation and spending.
Expansionary Fiscal Policy: Increased government spending or tax cuts boost economic activity and corporate earnings, supporting stock markets. However, if excessive, it can cause inflation and fiscal deficits.
Contractionary Fiscal Policy: Higher taxes or reduced spending can slow growth but help control inflation or reduce debt.
For example, massive fiscal stimulus packages during the COVID-19 pandemic (2020–2021) helped economies recover quickly but later contributed to inflationary pressures that shook global markets in 2022.
5. Geopolitical Events and Market Reactions
Political instability, wars, or trade conflicts create uncertainty, one of the biggest enemies of market stability.
Wars and Conflicts: Geopolitical tensions can disrupt global supply chains, raise commodity prices (especially oil), and trigger risk aversion.
Trade Wars: The U.S.-China trade war (2018–2019) is a prime example — tariffs and export restrictions hurt corporate earnings, global trade, and investor confidence.
Elections: Markets often react strongly to election outcomes that could change fiscal or regulatory policies.
Investors usually flock to safe-haven assets such as gold, the U.S. dollar, or government bonds during such uncertain times.
6. The Role of Globalization and Cross-Market Connections
Today’s markets are deeply interconnected. A macro event in one country can quickly spread across borders through trade, investment, and capital flows.
For instance:
A slowdown in China’s manufacturing sector affects global commodity prices, impacting countries like Australia, Brazil, and India.
U.S. Federal Reserve policies influence currency and bond markets worldwide, especially in emerging economies dependent on foreign capital.
This interconnection means that investors must think globally — not just about domestic events — to understand market dynamics.
7. Natural Disasters and Pandemics
Events such as earthquakes, floods, or pandemics can have both short-term shocks and long-term consequences on financial markets.
The COVID-19 pandemic caused one of the fastest global market crashes in March 2020 as lockdowns halted economic activity. However, extraordinary monetary and fiscal support led to one of the strongest bull runs soon after.
Similarly, natural disasters can disrupt industries (like agriculture or energy) and affect insurance, logistics, and infrastructure-related stocks.
These events highlight how market resilience and adaptability are tested in the face of global crises.
8. Commodity Prices and Currency Movements
Commodities and currencies are heavily influenced by macroeconomic events:
Oil Prices: Rising oil prices due to geopolitical tensions or supply shortages increase production costs and inflation, hurting equity markets but benefiting energy stocks.
Gold: Acts as a safe haven during economic or political uncertainty.
Currency Fluctuations: A strong domestic currency can hurt exporters but benefit importers. Conversely, a weak currency boosts exports but raises inflation.
For example, the sharp fall in the Indian rupee during periods of rising U.S. interest rates often leads to foreign outflows from Indian equities as investors seek safety in the dollar.
9. Investor Psychology and Behavioral Shifts
Beyond economic logic, human behavior magnifies the effects of macro events.
Markets are driven by fear and greed. When macro events introduce uncertainty, panic selling or herd behavior can exaggerate price swings.
Overreaction: Investors might sell off stocks excessively during economic shocks.
Euphoria: During periods of economic optimism, investors might ignore risks and inflate asset bubbles.
Understanding behavioral finance helps explain why markets sometimes react irrationally to macro news — moving far more than economic fundamentals justify.
10. Technological and Structural Changes
Technological disruptions and financial innovations also qualify as macro events when they reshape entire industries or economic systems.
Fintech and digital currencies have changed how money flows globally.
AI-driven automation affects employment and productivity patterns.
Energy transitions toward renewables influence oil markets and corporate investments.
Each structural shift creates new winners and losers in financial markets, altering the global investment landscape.
11. Case Studies: Macro Events and Market Impact
a. The 2008 Global Financial Crisis
Triggered by the U.S. housing bubble and subprime mortgage defaults, it caused massive global market crashes. Investors fled risky assets, and central banks worldwide adopted unprecedented stimulus policies. This event reshaped global financial regulation and risk management practices.
b. COVID-19 Pandemic (2020)
Markets plunged amid lockdowns, but aggressive fiscal and monetary stimulus soon led to a historic recovery. It demonstrated how quickly policy responses can stabilize markets during crises.
c. Russia-Ukraine War (2022)
The conflict disrupted global energy and grain supplies, spiking inflation worldwide. This led to tighter monetary policies globally and a volatile year for equities and bonds.
Each of these examples shows that macro events can both destroy and create market opportunities, depending on investor perception and timing.
12. How Traders and Investors Adapt
To navigate macro-driven markets, professionals use several strategies:
Diversification: Spreading investments across asset classes and geographies reduces exposure to single-event shocks.
Hedging: Using derivatives (like futures or options) to protect portfolios against adverse moves.
Top-down Analysis: Starting from macroeconomic trends to identify sectors and stocks likely to perform well.
Safe-haven Allocation: Holding assets like gold, U.S. Treasuries, or defensive stocks during uncertain times.
Understanding macro trends helps investors stay proactive rather than reactive.
13. The Role of Communication and Expectations
Sometimes, markets move not because of actual events, but because of expectations.
For example:
A central bank hinting at future rate hikes can move bond yields and stock prices even before the actual policy change.
Similarly, forward guidance from policymakers shapes how investors position themselves.
This psychological and anticipatory nature of markets means that information — not just action — can be a macro driver.
Conclusion
Macro events are the invisible hands guiding the pulse of global financial markets. Whether it’s a shift in central bank policy, a geopolitical crisis, or a breakthrough in technology, these forces determine how capital flows, how risk is priced, and how investors behave.
The ability to interpret macro signals and their potential ripple effects is what separates informed investors from the rest. In a world where markets are more interconnected than ever, no event occurs in isolation. Each policy decision, conflict, or data release sends waves across borders, influencing billions of dollars in market value within seconds.
Ultimately, understanding macro events is not just about predicting price movements — it’s about grasping how the global financial system breathes, reacts, and evolves in response to the constant rhythm of change.

The Rise of Jane Street in Global Finance1. Origins: A Humble Beginning with a Big Vision
Jane Street was founded in 2000 by a small group of traders — Tim Reynolds, Rob Granieri, Marc Gerstein, and Michael Jenkins — with a bold idea: to apply quantitative methods and technology-driven strategies to global trading. What set them apart from the start was their belief that trading was not just about speculation, but about solving complex mathematical problems efficiently.
Starting from a single office in New York City, the firm initially focused on exchange-traded funds (ETFs) — a market that was then in its infancy. ETFs were relatively new instruments, combining the flexibility of stock trading with the diversification of mutual funds. Many financial institutions did not yet understand their pricing complexities, but Jane Street’s founders recognized a goldmine of opportunity in the arbitrage and market-making potential of ETFs.
Through deep statistical analysis, coding expertise, and mathematical precision, Jane Street became one of the first firms to specialize in ETF arbitrage, helping create fair prices and efficient markets for these instruments.
2. Building the Quantitative Core
While most traditional Wall Street firms relied on intuition, experience, and aggressive speculation, Jane Street built its identity around quantitative rigor. Every trading decision was backed by data, models, and algorithms rather than mere hunches.
The firm recruited heavily from top universities, hiring mathematicians, physicists, and computer scientists instead of traditional finance professionals. This helped create a culture that was more akin to a research lab than a typical trading floor.
The use of probabilistic modeling, machine learning, and statistical arbitrage allowed Jane Street to find small inefficiencies in markets across thousands of instruments — equities, bonds, currencies, and derivatives — and trade them profitably.
What truly distinguished Jane Street was its technology-first philosophy. The company built nearly all its systems in-house, ensuring tight control, low latency, and adaptability. Its trading infrastructure allowed for lightning-fast execution — critical in markets where prices change in microseconds.
3. Mastering ETF Trading and Market Making
Jane Street’s early specialization in ETFs paid off enormously. As ETFs exploded in popularity worldwide, the firm became one of the largest ETF liquidity providers globally.
By constantly quoting buy and sell prices, Jane Street played a key role in ensuring that ETFs traded smoothly, even during volatile market conditions. It became the “invisible hand” behind countless trades — earning small margins but at massive volume.
During major market events, such as the 2008 financial crisis and the COVID-19 pandemic, Jane Street’s market-making capabilities were crucial in maintaining stability and liquidity. While many financial institutions pulled back, Jane Street stepped in — buying when others were fearful, providing prices when markets froze, and helping ensure continuous trading.
Their performance during crises cemented their reputation as a reliable backbone of modern markets.
4. Expansion into Global Markets
After conquering ETF trading, Jane Street expanded aggressively into new asset classes and regions. Offices were established in London, Hong Kong, and Amsterdam, transforming the firm into a truly global powerhouse.
The firm’s trading universe now includes:
Equities and ETFs across every major exchange
Fixed income instruments such as bonds and treasuries
Commodities and energy derivatives
Currencies (FX) and cryptocurrencies
Options and futures across various asset classes
Despite this diversification, Jane Street maintained a disciplined approach — only entering markets where its data-driven methods could yield a sustainable edge.
The company also became known for its cross-asset trading strategies — using correlations between asset classes to identify opportunities. For instance, changes in bond yields could signal moves in currencies or equity sectors, allowing Jane Street to capture value across interconnected markets.
5. The Technology Advantage
Technology is the beating heart of Jane Street’s rise. The firm’s internal systems are highly sophisticated, capable of handling massive data volumes in real-time. Every aspect — from pricing models and risk management to communication tools — is custom-built.
Jane Street uses the programming language OCaml for most of its systems, which is unusual in finance. OCaml allows for functional programming, helping the firm maintain robust, error-resistant, and efficient codebases. This gives them a stability advantage over competitors using more traditional financial software stacks.
Moreover, the firm’s automation and low-latency trading systems enable it to make decisions and execute orders faster than the human eye can blink. Yet, unlike many high-frequency trading (HFT) firms, Jane Street avoids reckless speed races. Instead, it uses technology strategically — focusing on smart execution, risk-adjusted returns, and long-term sustainability rather than pure velocity.
6. Culture: Collaboration and Intellectual Rigor
One of Jane Street’s most defining characteristics is its culture. Unlike the cutthroat environment typical of Wall Street, Jane Street emphasizes collaboration, transparency, and intellectual curiosity.
There are no large egos or “star traders” — everyone is encouraged to question, debate, and improve processes collectively. Meetings are analytical discussions rather than emotional arguments. Success is attributed to teams, not individuals.
The firm also has a flat organizational structure, where even junior employees are encouraged to contribute ideas. This approach fosters creativity and innovation — allowing new strategies to emerge from any level of the company.
Employees describe the culture as “academic yet pragmatic,” where curiosity is celebrated, and errors are treated as learning opportunities. This philosophy has helped Jane Street maintain consistency even as it scaled into a global enterprise.
7. The Role in Modern Market Liquidity
In today’s interconnected global markets, liquidity providers like Jane Street play an indispensable role. They ensure that buyers and sellers can transact efficiently without large price disruptions.
Jane Street’s algorithms continuously analyze order books, macroeconomic trends, and microstructure signals to offer tight bid-ask spreads — meaning better pricing for all market participants.
As markets have become more fragmented, with trades spread across dozens of exchanges, Jane Street’s ability to aggregate and balance liquidity across them gives it an enormous competitive advantage.
It’s estimated that the firm now trades trillions of dollars’ worth of securities annually, often accounting for a significant share of ETF trading volume globally.
8. Moving into Fixed Income and Cryptocurrencies
While equities and ETFs remain its backbone, Jane Street has successfully diversified into fixed income and digital assets — two of the most complex trading domains.
In fixed income markets, the firm became a major player in US Treasuries, corporate bonds, and interest rate derivatives. Its data-driven methods allow it to handle the opacity and illiquidity typical of bond markets more efficiently than many traditional banks.
Jane Street’s move into cryptocurrencies was another milestone. Unlike many firms that viewed crypto as speculative, Jane Street approached it with the same quantitative precision it applies to any asset. By becoming an early market maker for Bitcoin ETFs and crypto derivatives, it helped bring institutional stability to digital asset markets.
This adaptability — the ability to understand and trade emerging asset classes — showcases why Jane Street continues to stay ahead of the curve.
9. Risk Management and Discipline
For all its success, Jane Street’s longevity is built on one thing above all: risk control.
The firm operates on the principle that surviving bad days is more important than maximizing profits on good ones. Every trade is evaluated not just for potential return, but for its risk-adjusted value.
Sophisticated real-time risk management systems continuously monitor the firm’s positions across all markets, ensuring exposure stays within carefully defined limits.
Jane Street famously avoids “directional bets.” It doesn’t try to predict where markets will go — instead, it focuses on relative value trading, capturing small inefficiencies that exist between related securities. This disciplined, non-speculative philosophy has kept the firm stable even during turbulent times.
10. Jane Street’s Role in the 21st-Century Market Ecosystem
Today, Jane Street is more than a trading firm — it is a systemic player in global finance. Its algorithms help maintain efficient pricing across continents, its liquidity keeps ETFs and bonds flowing smoothly, and its risk discipline serves as a model for modern financial engineering.
Unlike investment banks, Jane Street doesn’t advise clients or manage portfolios; its business model is purely trading-based. Yet its impact rivals that of major banks.
As markets become increasingly electronic, data-driven, and cross-asset, firms like Jane Street are shaping the future architecture of global finance — where human intuition and machine intelligence coexist in harmony.
11. The Legacy and the Road Ahead
Jane Street’s rise reflects a broader transformation in finance — the shift from intuition-driven trading to algorithmic precision. It represents how intellectual humility, technological excellence, and a focus on long-term sustainability can outperform greed and speculation.
As artificial intelligence, blockchain, and decentralized finance (DeFi) evolve, Jane Street’s future will likely involve deeper integration of AI-powered models, quantum computing simulations, and global regulatory engagement.
But if its history is any guide, the firm will continue to adapt — quietly, intelligently, and effectively — without the need for flashy publicity or loud declarations.
Conclusion
The story of Jane Street is not just the story of a trading firm; it’s a story about the evolution of modern finance itself.
From its origins in ETF arbitrage to becoming one of the most dominant forces in global liquidity, Jane Street has shown that success in markets today comes not from speculation but from discipline, technology, collaboration, and continuous learning.
It stands as a testament to what finance can achieve when math meets markets, when data meets discipline, and when humility meets innovation.
In a world that often celebrates noise, Jane Street thrives in silence — executing billions in trades daily, quietly shaping the very structure of the global financial system.

What Are Cryptocurrencies? A Simplified Overview1. The Basic Definition: What Is a Cryptocurrency?
A cryptocurrency is a digital or virtual form of money that uses cryptography (a method of securing information) to ensure secure transactions. Unlike traditional currencies such as the rupee, dollar, or euro — which are issued and controlled by governments or central banks — cryptocurrencies operate on decentralized networks, usually based on blockchain technology.
This means no single authority, like a bank or government, controls cryptocurrency. Instead, users themselves verify and record transactions through computer networks spread across the globe.
In short: Cryptocurrency = Digital Money + Cryptography + Decentralization
2. The Birth of Cryptocurrency: A Revolution in Digital Money
The idea of digital money isn’t entirely new. Efforts to create online currencies started as early as the 1980s and 1990s. But these early systems failed because they depended on a central authority, which made them vulnerable to fraud and manipulation.
The real breakthrough came in 2009, when a mysterious individual (or group) under the name Satoshi Nakamoto introduced Bitcoin — the first successful decentralized cryptocurrency.
Bitcoin solved two major problems that earlier attempts couldn’t:
Double-spending problem – ensuring digital money couldn’t be copied or spent twice.
Trust problem – enabling users to transact without needing to trust a middleman or central authority.
The launch of Bitcoin marked the beginning of a new financial era — one where money could move freely and securely on the internet.
3. How Cryptocurrencies Work
At the heart of every cryptocurrency lies a technology called the blockchain.
Think of a blockchain as a public digital ledger — a kind of record book that’s accessible to everyone but can’t be changed or tampered with.
Here’s how it works step by step:
Transaction Creation:
When someone sends cryptocurrency to another person (say, sending Bitcoin to a friend), that transaction is broadcast to a network of computers.
Verification:
These computers (called nodes) verify the transaction details — ensuring the sender actually has enough funds and that there’s no duplication.
Block Formation:
Verified transactions are grouped together into a “block”.
Blockchain Addition:
Once verified, this block is added to the existing chain of previous transactions — forming a continuous and secure “blockchain”.
Immutability:
Once a block is added, it cannot be altered. This makes blockchain systems highly secure and transparent.
Every participant in the network can view the transactions, but nobody can modify them. This creates a trustless system, meaning people don’t need to trust each other — they only need to trust the system’s mathematics and cryptography.
4. Mining: The Backbone of Cryptocurrency Creation
Most cryptocurrencies (like Bitcoin) are “mined” rather than printed. Mining refers to the process of using powerful computers to solve complex mathematical problems that validate transactions and create new coins.
When miners solve these problems, they add new blocks to the blockchain.
As a reward for their effort and energy, they receive new cryptocurrency coins.
This process not only issues new coins into circulation but also keeps the network secure and decentralized.
However, mining requires significant computing power and electricity. As a result, it has raised environmental concerns, leading newer cryptocurrencies to adopt more energy-efficient methods such as Proof of Stake (PoS) instead of Proof of Work (PoW) used by Bitcoin.
5. Types of Cryptocurrencies
While Bitcoin was the pioneer, thousands of other cryptocurrencies have since emerged, each with unique purposes and features. Some popular examples include:
Bitcoin (BTC):
The original and most valuable cryptocurrency. Often referred to as “digital gold”.
Ethereum (ETH):
Introduced the concept of smart contracts — programmable digital agreements that execute automatically when conditions are met.
Ripple (XRP):
Designed to make international payments faster and cheaper, especially for banks and financial institutions.
Litecoin (LTC):
A lighter, faster version of Bitcoin, often used for smaller transactions.
Cardano (ADA) and Solana (SOL):
Focus on scalability and energy efficiency for decentralized applications (DApps).
Stablecoins (like USDT, USDC):
These are cryptocurrencies pegged to stable assets like the US dollar to reduce volatility.
Meme coins (like Dogecoin, Shiba Inu):
Created for fun or community engagement, though some gained massive popularity.
The cryptocurrency ecosystem continues to expand, with coins serving purposes from gaming and supply chain management to healthcare and finance.
6. Why Are Cryptocurrencies So Popular?
Several reasons explain why cryptocurrencies have gained such massive popularity worldwide:
Decentralization and Independence:
People are drawn to the idea of money that isn’t controlled by banks or governments.
High Return Potential:
Early investors in Bitcoin and other cryptocurrencies saw extraordinary gains, inspiring millions to invest.
Transparency and Security:
Blockchain records are public and cannot be altered, which increases trust.
Borderless Transactions:
You can send money across countries instantly, with minimal fees and no need for conversion.
Financial Inclusion:
Cryptocurrencies can provide banking access to people in remote areas who lack traditional financial infrastructure.
Technological Innovation:
Blockchain technology opened the door for smart contracts, NFTs, and decentralized finance (DeFi), reshaping industries.
7. Risks and Challenges of Cryptocurrencies
Despite their promise, cryptocurrencies also come with significant challenges and risks:
Volatility:
Prices of cryptocurrencies can fluctuate dramatically. Bitcoin, for example, can gain or lose thousands of dollars in a single day.
Regulatory Uncertainty:
Governments worldwide are still developing laws to regulate crypto trading, taxation, and consumer protection.
Security Risks:
While blockchains are secure, cryptocurrency exchanges and wallets can be hacked if users are careless.
Environmental Concerns:
Mining consumes large amounts of electricity, raising questions about sustainability.
Lack of Understanding:
Many people invest without fully understanding the technology, leading to poor financial decisions.
Scams and Fraud:
Fake coins, Ponzi schemes, and rug pulls have caused investors to lose billions globally.
These issues show that while crypto offers freedom and innovation, it also demands responsibility, education, and regulation.
8. The Role of Blockchain: The Foundation of Crypto
Blockchain is the real hero behind cryptocurrencies. It ensures transparency, security, and decentralization.
Each block in the blockchain contains:
A list of transactions
A timestamp
A unique code (hash)
A reference to the previous block
This interconnected system prevents tampering and creates a permanent record of all transactions.
Beyond cryptocurrencies, blockchain is now being adopted in industries like:
Banking (for fast settlements)
Supply Chain Management (to track goods)
Healthcare (for secure patient data)
Voting Systems (to prevent fraud)
Real Estate (for transparent ownership records)
This shows that blockchain’s potential goes far beyond digital money — it can revolutionize how trust and information are managed in society.
9. The Legal and Regulatory Landscape
Different countries view cryptocurrencies differently:
El Salvador became the first nation to adopt Bitcoin as legal tender in 2021.
India, the U.S., and the European Union allow crypto trading but are working on stricter rules for taxation and anti-money laundering.
Some countries like China have banned crypto transactions altogether.
In India, the government does not recognize crypto as legal tender but allows its trading and taxes it at 30% on profits, similar to gambling or speculative income. This reflects a cautious but open approach.
Over time, global regulation is expected to bring more clarity, investor protection, and institutional participation in the crypto market.
10. The Future of Cryptocurrencies
The future of cryptocurrencies is still being written. Some believe crypto will replace traditional banking systems, while others see it as a speculative bubble. However, one thing is certain — the underlying technology is here to stay.
Here are a few emerging trends shaping the future:
Central Bank Digital Currencies (CBDCs):
Many countries are launching their own digital versions of national currencies (like India’s Digital Rupee) to combine the benefits of crypto with government control.
Decentralized Finance (DeFi):
Platforms allowing people to lend, borrow, and trade without banks are gaining massive popularity.
Tokenization of Assets:
Real-world assets like real estate, gold, or art are being represented digitally through blockchain tokens.
Mainstream Adoption:
Companies like Tesla, PayPal, and Visa are integrating cryptocurrencies into their payment systems.
Regulated Crypto Ecosystems:
With better laws and security, institutional investors (like mutual funds and pension funds) are entering the market, bringing legitimacy and stability.
Despite challenges, crypto continues to evolve, pushing the boundaries of how we define money and value.
11. The Human Side: A Shift in Financial Power
Beyond technology, cryptocurrencies represent a philosophical and social shift.
For centuries, financial systems have been controlled by powerful intermediaries — banks, governments, and corporations. Crypto challenges this by empowering individuals directly.
It promotes:
Financial freedom
Transparency
Equal access
Innovation through collaboration
In this sense, cryptocurrencies are not just a new asset class — they symbolize a movement toward democratizing finance.
12. Conclusion: The Evolution of Money
Cryptocurrencies began as a simple idea — to create digital money independent of centralized control. In just over a decade, they have transformed into a global financial revolution influencing technology, policy, and economics.
They are more than an investment trend; they represent the next evolution of how humans exchange value, trust systems, and manage wealth. Yet, as with all powerful innovations, they require understanding, caution, and responsibility.
As the world continues to embrace digital transformation, cryptocurrencies will likely play an essential role — whether as alternative investments, technology enablers, or the foundation of the next-generation financial system.
The Role of Sub-Brokers in India’s Financial MarketIntroduction
India’s financial market is one of the fastest-growing in the world, driven by rising participation from retail investors, a robust regulatory framework, and increasing digitalization. Within this ecosystem, sub-brokers have historically played a vital role as intermediaries who connect investors to the stock market through registered stockbrokers.
Although technological advancements and new regulatory norms have transformed their traditional role, sub-brokers continue to be significant, especially in expanding the reach of capital markets into smaller towns and rural areas. Their contribution lies not only in client acquisition but also in investor education, market accessibility, and financial inclusion.
Who is a Sub-Broker?
A sub-broker is an individual or entity who acts as an agent on behalf of a stockbroker to facilitate buying, selling, and trading of securities for clients. They do not hold direct membership of a stock exchange but work under a registered stockbroker who has that membership.
Essentially, a sub-broker serves as a bridge between the investor and the main broker. Before 2018, sub-brokers were directly registered with the Securities and Exchange Board of India (SEBI). However, SEBI later discontinued new registrations under this category, directing intermediaries to register instead as Authorised Persons (APs) under brokers.
Evolution of Sub-Brokers in India
The journey of sub-brokers in India is tied closely to the growth of the Indian stock market.
1. Pre-Demat Era
Before the introduction of electronic trading in the 1990s, the stock market was largely paper-based and operated through physical share certificates. Investors relied heavily on personal connections and local agents—who acted as early sub-brokers—to execute trades and manage portfolios.
2. Post-Demat and Online Trading
With the establishment of National Stock Exchange (NSE) and Central Depository Services (CDSL) in the 1990s, trading moved online. Sub-brokers began using digital platforms provided by brokers to execute client trades more efficiently, allowing them to serve a wider base of investors.
3. SEBI’s Regulatory Transformation
SEBI introduced strict norms to bring transparency to sub-broker operations. However, as technology simplified client onboarding, SEBI decided in 2018 to merge the “sub-broker” category into Authorised Persons to streamline supervision and compliance under brokers. Despite the name change, the function remains nearly identical — connecting clients to brokers and markets.
Registration and Compliance Framework
A sub-broker (or now an Authorised Person) must be associated with a SEBI-registered trading member or broker.
Key Requirements:
Broker Association: Must have a written agreement with a SEBI-registered broker.
Education and Experience: Generally, a graduate with sound knowledge of the stock market is preferred.
Infrastructure: Should have office space, internet access, and client service capacity.
KYC and AML Compliance: Must ensure all clients undergo Know-Your-Customer verification and follow Anti-Money Laundering norms.
Revenue Sharing Agreement: Income is typically commission-based, agreed mutually between the sub-broker and the broker.
Transition to Authorised Persons (APs):
After SEBI discontinued the sub-broker category, all existing sub-brokers were required to migrate to the AP model. This made regulatory control more streamlined and reduced duplication in supervision.
Functions of Sub-Brokers in the Financial Market
Sub-brokers perform several crucial functions that contribute to the health and expansion of India’s capital markets.
1. Client Acquisition and Onboarding
One of the most vital roles of sub-brokers is identifying potential investors, guiding them through account opening procedures, and ensuring compliance with KYC requirements. They help new investors, especially in smaller cities, understand trading basics and invest safely.
2. Trade Execution Support
Sub-brokers assist clients in executing trades through the broker’s platform. They explain market orders, stop-loss mechanisms, and portfolio diversification strategies, ensuring investors make informed decisions.
3. Investor Education
For many first-time investors, the sub-broker acts as a teacher. They provide insights into how the stock market works, how to interpret trends, and how to avoid common pitfalls. Their role as educators has been crucial in spreading market literacy across semi-urban and rural regions.
4. Advisory and Relationship Management
Sub-brokers often offer personalized guidance on stock selection, mutual funds, derivatives, or IPOs based on client risk profiles. They maintain long-term relationships by providing continuous portfolio updates and market insights.
5. Expanding Market Reach
Sub-brokers are instrumental in expanding the capital market’s reach. Many investors in Tier II and Tier III cities access stock markets for the first time through local sub-brokers, bridging the urban-rural investment gap.
6. After-Sales and Customer Service
Beyond trade execution, sub-brokers handle client grievances, documentation, and other service issues. Their local presence ensures clients receive quick and reliable support.
Revenue Model of Sub-Brokers
Sub-brokers primarily earn through commission-sharing with the broker. The typical structure involves:
Brokerage Sharing: A certain percentage (ranging from 40% to 80%) of the brokerage charged to clients is shared with the sub-broker.
Incentives: Brokers may offer incentives for achieving higher trading volumes or for onboarding a specific number of clients.
Advisory Fees: In some cases, sub-brokers may charge clients directly for financial advisory or portfolio management services (if authorized).
This model allows sub-brokers to scale their income with client activity while maintaining flexibility in operations.
Technological Transformation and Its Impact
The digital revolution in India’s financial services has redefined the role of sub-brokers.
1. Rise of Discount Brokers
Discount brokers such as Zerodha, Groww, and Upstox have simplified trading through mobile apps and zero-commission models. This reduced dependence on human intermediaries, impacting the traditional sub-broker structure.
2. Digital Client Onboarding
Online KYC, e-signatures, and instant account openings have made it easier for clients to join directly through digital platforms. Sub-brokers now use digital tools for faster onboarding and data management.
3. Hybrid Model Emergence
While online platforms dominate in metros, sub-brokers have adopted a hybrid model—using technology to execute trades but maintaining personal relationships to guide clients, especially those uncomfortable with technology.
4. Data-Driven Advisory
Modern sub-brokers use analytical tools, AI-based platforms, and CRM systems to provide smarter investment advice, track client portfolios, and generate better returns.
Challenges Faced by Sub-Brokers
Despite their importance, sub-brokers face several challenges in the evolving market environment.
1. Regulatory Changes
The shift from sub-broker to Authorised Person created confusion initially, requiring re-registration and adjustment to new norms.
2. Reduced Commissions
With the advent of discount brokers offering low-cost trading, sub-brokers have faced declining commission margins, affecting their income potential.
3. Technological Competition
Automated trading platforms and robo-advisors are reducing the need for manual guidance, especially among tech-savvy investors.
4. Compliance Burden
Strict KYC, reporting, and data privacy requirements demand administrative and technological investments that small sub-brokers may struggle to afford.
5. Market Volatility
Income of sub-brokers is linked to trading volumes. During market downturns, when investor participation drops, their revenue can fall sharply.
Regulatory Oversight by SEBI
SEBI has established a robust framework to ensure that sub-brokers or authorised persons operate transparently.
Key Regulations Include:
Mandatory association with SEBI-registered brokers.
Clear disclosure of revenue-sharing arrangements.
Strict prohibition against unauthorized trading or mis-selling.
Maintenance of investor grievance redressal mechanisms.
Continuous compliance audits and reporting.
These measures safeguard investor interests and maintain trust in the capital market.
Role in Financial Inclusion
Sub-brokers are essential in extending financial inclusion by:
Introducing stock market participation in smaller towns.
Encouraging investments in mutual funds and IPOs.
Helping individuals understand long-term wealth creation through equities.
Assisting in systematic investment planning (SIPs) and retirement planning.
Their local presence and personalized service have helped thousands of first-time investors navigate the complexities of financial markets.
The Future of Sub-Brokers in India
The future of sub-brokers lies in adaptation and evolution.
1. Shift to Advisory and Wealth Management
Instead of relying solely on trade commissions, many sub-brokers are transitioning to financial advisory, mutual fund distribution, and insurance services to diversify income.
2. Partnership with Digital Platforms
Collaborations with online brokers and fintech firms allow sub-brokers to leverage technology while maintaining a local relationship-driven model.
3. Focus on Tier II and Tier III Cities
As India’s smaller cities witness growing disposable income, sub-brokers will play a key role in onboarding new investors and expanding the financial ecosystem.
4. Upskilling and Certification
Continuous training in financial products, regulatory compliance, and technology will help sub-brokers remain competitive in the evolving landscape.
Conclusion
Sub-brokers have been a cornerstone of India’s financial market journey — from paper-based trading floors to digital stock exchanges. Their role as connectors, educators, and facilitators has expanded access to the market, empowered retail investors, and strengthened the foundation of financial inclusion.
Even though the structure has evolved into the Authorised Person model, the essence of their contribution remains unchanged. As India moves toward deeper capital market participation and digital finance, sub-brokers who embrace technology, transparency, and advisory-based services will continue to play an irreplaceable role in shaping the next phase of India’s financial growth.

Arbitrage as the Invisible Hand of Market BalanceUnderstanding the Concept of Arbitrage and Why Cross-Market Opportunities Exist.
Introduction: The Timeless Appeal of Arbitrage
In the world of finance and trading, arbitrage is one of the oldest and most reliable concepts for making profits with minimal risk. The idea is simple yet powerful — taking advantage of price discrepancies for the same asset across different markets or instruments. Arbitrageurs act as the balancing agents of the financial ecosystem. By exploiting small differences in prices, they help maintain market efficiency and price stability.
While it might sound straightforward — buy low here, sell high there — in practice, arbitrage is an intricate process driven by technology, timing, and global financial linkages. Cross-market arbitrage, in particular, shows how interconnected today’s world is, where an event in New York or London can instantly impact prices in Mumbai or Singapore.
Let’s delve deeper into what arbitrage means, its types, and why cross-market opportunities continue to exist despite the rise of advanced trading systems and AI-driven algorithms.
1. What is Arbitrage?
Arbitrage is the practice of simultaneously buying and selling an asset in different markets to profit from the difference in price. The key here is simultaneity — both transactions occur at the same time to lock in a risk-free profit.
In essence, arbitrage ensures that the law of one price holds true: an identical asset should have the same price across all markets. When this is not the case, arbitrageurs step in, quickly exploiting the gap until prices converge again.
Example:
Suppose shares of Company X trade at ₹1,000 on the National Stock Exchange (NSE) and ₹1,005 on the Bombay Stock Exchange (BSE). A trader can buy on NSE and sell on BSE simultaneously, earning ₹5 per share in profit before transaction costs. While this seems small, when executed at scale with automation, such trades can generate significant returns.
2. The Core Principle: The Law of One Price
At the heart of arbitrage lies the law of one price, which states that in an efficient market, identical assets should trade for the same price when exchange rates, transaction costs, and other frictions are considered.
If gold is priced at ₹6,000 per gram in India and $70 per gram in the U.S., and the exchange rate is ₹85 per dollar, then ₹6,000/₹85 = $70.5 per gram — nearly identical. Any meaningful difference would invite traders to move gold (physically or virtually) from one market to another until prices align.
However, real-world markets aren’t always perfectly efficient, which gives rise to temporary price imbalances — and hence, arbitrage opportunities.
3. Types of Arbitrage in Financial Markets
Arbitrage comes in several forms, each suited to different asset classes and market structures. Below are the most common:
a) Spatial (Geographical) Arbitrage
This is the classic form of arbitrage where an asset is bought in one location and sold in another. Common examples include commodities, currencies, or stocks listed on multiple exchanges.
b) Temporal Arbitrage
This occurs when traders exploit price differences across time periods. For instance, buying a stock today and selling a futures contract for delivery next month when the future price is higher.
c) Statistical Arbitrage
Here, traders use quantitative models to identify mispriced securities based on historical relationships. It’s not purely risk-free but relies on probability and mean reversion.
d) Triangular Arbitrage (Currency Markets)
In the forex market, triangular arbitrage involves exploiting discrepancies among three currency pairs. For instance, if EUR/USD, USD/GBP, and EUR/GBP don’t align mathematically, a trader can profit by cycling through the three conversions.
e) Merger or Risk Arbitrage
This form occurs during corporate events such as mergers or acquisitions. Traders speculate on price movements between the target company’s current price and the offer price.
f) Cross-Market Arbitrage
This involves exploiting price differences for the same or related assets across different markets or asset classes — such as spot and futures, or equity and derivatives markets.
Cross-market arbitrage is increasingly important in today’s globalized, interconnected trading landscape.
4. Understanding Cross-Market Arbitrage
Cross-market arbitrage happens when traders take advantage of price differences for the same security, index, or commodity across multiple exchanges or platforms — often across borders.
For example, if Reliance Industries trades at ₹2,500 on the NSE but ₹2,507 on the Singapore Exchange (SGX) as a derivative instrument, an arbitrageur could buy the cheaper one and sell the higher-priced version, profiting from the spread until prices converge.
This form of arbitrage often occurs between:
Spot and futures markets (cash-and-carry arbitrage)
Domestic and international exchanges
Equity and derivative markets
Cryptocurrency exchanges across countries
The profit margins may be narrow, but in high-volume or algorithmic environments, these trades can yield consistent gains.
5. Why Do Cross-Market Opportunities Exist?
If markets are efficient, one might wonder — why do such price differences exist at all? Theoretically, arbitrage should eliminate inefficiencies quickly. However, several real-world frictions allow opportunities to emerge and persist, at least temporarily.
Let’s explore the main reasons:
a) Market Segmentation
Not all investors have access to all markets. Regulatory barriers, currency restrictions, or exchange-specific membership requirements can create segmented markets, allowing the same asset to trade at different prices.
For instance, Chinese A-shares often trade at higher valuations on mainland exchanges compared to Hong Kong-listed H-shares of the same company due to limited investor access in mainland markets.
b) Currency Exchange Rates
When assets are priced in different currencies, exchange rate movements can create temporary mispricing. Even slight discrepancies in forex rates can lead to arbitrage between markets.
c) Liquidity Differences
Some markets are more liquid than others. Lower liquidity can lead to price delays or inefficiencies, allowing faster traders to exploit differences between high-liquidity and low-liquidity venues.
d) Information Asymmetry
Not all markets react to information simultaneously. If news reaches one market faster, prices there adjust sooner, creating short-lived arbitrage opportunities elsewhere.
e) Transaction Delays and Infrastructure Gaps
Even in an era of high-frequency trading, minor lags in data transmission or order execution can result in tiny but exploitable differences between exchanges.
f) Demand and Supply Imbalances
Cross-market demand differences — due to institutional orders, fund flows, or hedging needs — can push prices temporarily away from equilibrium, creating room for arbitrage.
g) Regulatory and Tax Factors
Different tax structures, capital controls, or transaction charges across countries can cause effective price differences for the same asset.
6. How Arbitrage Helps Maintain Market Efficiency
Arbitrage isn’t just about making profits — it plays a crucial stabilizing role in the global financial system.
Whenever arbitrageurs exploit price gaps, their actions force prices back toward equilibrium. For example, buying in the cheaper market increases demand (raising the price) while selling in the expensive market increases supply (lowering the price). This self-correcting mechanism ensures that prices remain aligned across regions and instruments.
In this sense, arbitrage acts as a natural regulator of market inefficiencies, contributing to:
Price uniformity
Efficient capital allocation
Market liquidity
Reduced volatility
7. The Role of Technology in Arbitrage
In earlier decades, arbitrage required manual observation, phone calls, and physical trade execution. Today, it’s dominated by algorithms and high-frequency trading (HFT).
Modern arbitrageurs use advanced systems to:
Track price discrepancies in microseconds
Execute simultaneous trades across exchanges
Manage massive volumes with minimal latency
Technological advancements such as co-location (placing servers near exchange data centers), API connectivity, and AI-driven analytics have transformed arbitrage from human-driven intuition to machine-executed precision.
However, this also means that arbitrage opportunities now close much faster — often within milliseconds — requiring traders to invest heavily in technology.
8. Risks and Challenges in Arbitrage
While arbitrage is considered “risk-free” in theory, in reality, several factors can turn it risky:
Execution Risk: Prices may change before both sides of the trade are completed.
Latency Risk: Delays in order processing can erase profits.
Transaction Costs: Fees, taxes, and slippage can turn a profitable trade into a loss.
Regulatory Restrictions: Some countries restrict cross-border or high-frequency trading.
Currency Risk: Exchange rate fluctuations can alter effective profits.
Thus, while arbitrage is low-risk compared to speculative trading, it demands precision, capital, and infrastructure to succeed consistently.
9. Real-World Examples of Cross-Market Arbitrage
a) NSE–BSE Price Differentials
Large-cap Indian stocks often trade simultaneously on both exchanges. Automated systems constantly scan for minute price differences to execute cross-exchange arbitrage.
b) SGX–Nifty Futures Arbitrage
For years, the SGX Nifty index futures in Singapore traded slightly differently than Indian NSE Nifty futures. Arbitrageurs would buy in one market and sell in the other, balancing the two indices.
c) Cryptocurrency Exchanges
Crypto markets, being decentralized and fragmented, often exhibit significant cross-exchange price differences. For instance, Bitcoin might trade at a premium in South Korea compared to the U.S. — known as the “Kimchi Premium.”
10. The Future of Arbitrage in a Globalized Market
As technology continues to advance and global connectivity deepens, traditional arbitrage margins are shrinking. However, new forms of arbitrage are emerging, especially with the rise of:
Digital assets and tokenized securities
Decentralized finance (DeFi) platforms
Algorithmic and machine-learning-based trading strategies
Cross-market inefficiencies will likely persist in newer, evolving markets where regulatory fragmentation, liquidity gaps, and data asymmetry continue to exist.
In other words, while arbitrage profits might be slimmer, the scope of opportunities is expanding — not disappearing.
Conclusion
Arbitrage is more than just a trading strategy — it’s a mechanism that keeps the global financial system efficient and interconnected. By seizing fleeting opportunities born from imperfections, arbitrageurs ensure that prices reflect true value across geographies and instruments.
Cross-market opportunities exist because no market is perfectly efficient. Differences in time zones, liquidity, regulation, and information flow continuously create temporary imbalances. For traders equipped with speed, strategy, and precision, these moments translate into consistent profits — and for the broader system, into greater market harmony and stability.
In a world that trades 24/7 across borders, arbitrage will always find a way — adapting to new technologies, instruments, and markets — remaining one of the purest expressions of financial logic and opportunity.

INDUSTOWER 1 Day View🎯 Key Levels for the Day
Based on recent technical data:
Support zone: ~ ₹ 338-346 range (some sources show support near ₹ 339/₹ 334).
Immediate resistance: ~ ₹ 382-395 zone. For example, one chart flags ~ ₹ 394.50-395 as breakout resistance.
A more conservative support/resistance grid shows:
Support ~ ₹ 346.90, ~ ₹ 339.40, ~ ₹ 334.80
Resistance ~ ₹ 395.20, ~ ₹ 401.90, ~ ₹ 408.10
🔍 My Interpretation
Since current is ~ ₹ 361-362:
If the price drops below ~ ₹ 338-340, that may signal weakness.
If it rises and closes above ~ ₹ 390-395 with momentum/volume, then upside potential opens.
Between ~ ₹ 340 and ~ ₹ 390 is the current “zone of interest” — price may oscillate here unless breakout happens.

What Are MEME Stocks? The Viral Phenomenon Explained1. Understanding Meme Stocks
Meme stocks are shares of companies that gain sudden popularity and price surges primarily through social media hype rather than financial metrics. Platforms like Reddit (r/WallStreetBets), Twitter (now X), YouTube, and TikTok play a key role in spreading discussions, memes, and buying calls.
Unlike traditional stocks whose prices are influenced by earnings reports or macroeconomic indicators, meme stocks move largely on viral momentum. A meme stock’s rise often begins when a group of retail investors collectively decide to buy shares — not necessarily because the company has strong fundamentals, but because they believe they can drive up the price together.
This phenomenon democratized market influence, empowering small investors to move prices once thought controllable only by large institutions.
2. The Spark: GameStop and AMC Revolution
The meme stock phenomenon entered the mainstream in January 2021 during the GameStop (GME) short squeeze saga.
GameStop, a struggling American video game retailer, had been heavily shorted by hedge funds betting that its price would fall. Retail traders on Reddit’s r/WallStreetBets noticed this excessive short interest and decided to buy and hold GME shares en masse, creating a short squeeze — a scenario where short sellers are forced to buy back shares to cover their positions, driving prices even higher.
The stock skyrocketed from around $20 to nearly $500 within weeks.
Soon after, AMC Entertainment, BlackBerry, and Bed Bath & Beyond became part of the same movement. For many retail traders, this wasn’t just about profits — it was a symbolic battle of the small investor versus Wall Street elites. It represented a collective digital uprising, coordinated not by analysts or hedge funds but by memes, emojis, and hashtags.
3. How Social Media Fueled the Frenzy
The rise of meme stocks is inseparable from the influence of social media communities. Platforms like Reddit and Twitter became virtual trading floors, where users shared screenshots of trades, jokes about hedge funds, and rallying cries like “Hold the Line!” or “To the Moon!”.
Memes — humorous images or catchphrases — acted as emotional fuel. They simplified complex financial concepts into shareable content, creating a sense of belonging among retail traders. Instead of dry market analysis, posts often carried cultural energy, blending humor, defiance, and optimism.
Moreover, apps like Robinhood provided zero-commission trading and gamified interfaces, encouraging participation from young, first-time investors. This convergence of technology, humor, and finance birthed a new breed of traders who saw the market not only as a profit engine but also as a social movement.
4. The Psychology Behind Meme Stocks
At its core, the meme stock mania is as much about emotion as it is about economics. Several psychological forces drive this movement:
a) Fear of Missing Out (FOMO)
When investors see others posting massive profits online, they rush to join in before “it’s too late.” The viral nature of meme stocks amplifies this herd behavior.
b) The Power of Community
Online forums give traders a sense of unity. It’s not just about making money — it’s about belonging to a digital tribe with shared goals, humor, and enemies (often Wall Street).
c) Revenge Trading
For many, buying meme stocks was a symbolic act of resistance against institutional investors. The 2008 financial crisis left deep scars, and this movement became a way for retail traders to “fight back.”
d) Speculative Thrill
Meme stocks offer the excitement of massive short-term gains. The adrenaline rush from volatile price moves creates a gambling-like experience, which can be addictive.
e) The “Diamond Hands” Mentality
A popular meme phrase, diamond hands, refers to holding onto a stock despite volatility, symbolizing loyalty and resilience against selling pressure.
Together, these psychological drivers created a feedback loop — social excitement drove price rallies, and rising prices fueled even greater enthusiasm.
5. The Role of Technology and Retail Platforms
The meme stock revolution wouldn’t have been possible without the technological democratization of trading. Mobile apps like Robinhood, Zerodha, Groww, and Webull broke down barriers that once favored institutional players.
Key enablers included:
Zero-commission trading, making frequent transactions affordable.
Fractional investing, allowing users to buy parts of expensive shares.
Easy access to market data and real-time discussions.
Social trading communities, where users share strategies and screenshots.
Technology turned investing into a viral experience, merging finance with digital culture. What was once a Wall Street-exclusive domain became an open playground for anyone with a smartphone.
6. Fundamental vs. Sentimental Value
Traditional investors analyze fundamentals — revenue, profits, balance sheets, and future prospects. Meme stock traders, however, operate on sentimental value — the shared belief that a stock’s price can rise simply because enough people want it to.
In meme stocks:
Valuation is often disconnected from fundamentals.
Price is driven by social momentum rather than intrinsic worth.
Sentiment is volatile and can shift overnight.
This emotional market behavior challenges classic theories of efficient markets, suggesting that modern finance is also a theater of collective psychology.
7. The Aftermath: Volatility and Reality Check
While some early traders made fortunes, most late entrants faced heavy losses as prices crashed once the hype faded. For instance:
GameStop (GME) fell over 80% from its peak after the initial mania.
AMC Entertainment (AMC) also retraced most of its gains.
These crashes highlighted a crucial truth: momentum-based markets are unsustainable without continuous new demand. Meme stocks are often volatile and speculative, resembling short-term trading battles rather than long-term investments.
However, the phenomenon left an enduring mark — it revealed that collective retail investors can move markets, a notion once thought impossible.
8. Meme Stocks in India: A Growing Trend
While the meme stock craze originated in the U.S., India, too, is witnessing its own version. Platforms like Twitter (X), Telegram, and YouTube have become hubs where traders discuss small-cap or penny stocks that can “explode.”
Stocks such as Suzlon Energy, Vodafone Idea, Zomato, and Paytm have at times displayed meme-like behavior — where social buzz, not fundamentals, triggered sharp rallies.
This trend is especially visible among young investors who entered markets post-2020, drawn by social media content and a desire for fast profits. Though not as extreme as GameStop’s story, the Indian market’s growing retail participation shows similar psychological patterns — community-driven speculation, influencer effects, and herd excitement.
9. Risks and Regulatory Concerns
Meme stock trading brings both opportunity and danger. Regulators worldwide, including SEBI and the U.S. SEC, have raised concerns over market manipulation and misinformation.
Key risks include:
Extreme volatility, leading to rapid losses.
Pump-and-dump schemes, where influencers artificially inflate prices.
Emotional decision-making, ignoring risk management.
Platform restrictions, as seen when trading apps halted meme stock orders in 2021 due to liquidity stress.
Regulators now monitor online discussions and social trading platforms more closely to prevent coordinated manipulation.
10. Lessons for Investors
The meme stock era offers valuable takeaways for traders and long-term investors alike:
Understand Market Psychology: Price moves are not always rational. Emotions and narratives often overpower fundamentals.
Avoid Herd Mentality: Entering trades solely because “everyone else is doing it” can be disastrous.
Do Your Own Research (DYOR): Always analyze a company’s financial health before investing.
Diversify: Don’t put all your capital in one speculative play.
Separate Entertainment from Investment: Trading for fun is fine — but never risk money you can’t afford to lose.
11. The Cultural Impact of Meme Stocks
Beyond finance, meme stocks became a pop-culture event. They inspired documentaries, news debates, and even movies (like Dumb Money, released in 2023).
They also reshaped public perception of investing. Millions of young people who had never cared about the stock market began to see trading as accessible, even cool.
The term “stonks” (a humorous take on “stocks”) became a symbol of modern finance — blending irony, humor, and rebellion. Meme stocks thus bridged two worlds: Wall Street’s seriousness and the internet’s playfulness.
12. The Future of Meme Stocks
Will meme stocks fade away? Not entirely.
While the 2021 mania may not return in the same form, social-driven investing is here to stay. Platforms now integrate community discussions directly into trading apps, and sentiment analysis tools are being used by institutions to monitor online chatter.
In India, the rise of finfluencers (financial influencers) mirrors this global shift — where retail narratives can sway short-term market sentiment. Future meme stocks might emerge around trending sectors like renewable energy, EVs, or AI, driven by excitement and online buzz.
However, with greater awareness and regulation, the next wave may be more structured and transparent, balancing social energy with financial prudence.
Conclusion: The Meme Stock Legacy
The meme stock revolution redefined what it means to “invest.” It blurred lines between trading and activism, community and speculation, humor and finance.
It revealed a deeper truth — that markets are not just mechanical systems of numbers and charts, but human arenas of belief, behavior, and shared emotion.
While many lost money chasing viral trends, the movement empowered millions to learn, engage, and question long-standing power dynamics in finance.
In the end, meme stocks symbolize more than speculative chaos — they represent the digital democratization of investing, where anyone, anywhere, can shape the market narrative with nothing more than a smartphone, a meme, and a mission.

The Cost of Common Trading Mistakes1. The Price of Poor Risk Management
Perhaps the single most costly mistake in trading is the failure to manage risk effectively. Risk management isn’t exciting — it’s not about predicting which stock will rally or when the market will crash — but it’s what separates long-term survivors from those who blow up their accounts.
The mistake: Traders often risk too much on a single position or fail to use stop-losses. They believe “this trade can’t go wrong,” which is usually when it does.
The cost: A single large loss can wipe out weeks or even months of steady gains. For instance, risking 20% of capital per trade means losing just five trades in a row could reduce your account by over 60%.
The fix: Never risk more than 1–2% of your capital on any single trade. Always define exit points before entering. Position sizing and disciplined stop-loss placement are your best defense against market uncertainty.
In trading, your number one job is not to make money — it’s to protect your capital.
2. Overtrading: When Action Becomes Addiction
Overtrading is one of the most silent killers of profitability. The temptation to “always be in the market” arises from boredom, greed, or the illusion of control.
The mistake: Taking too many trades in a day or week, often without solid setups or edge.
The cost: High transaction costs, emotional fatigue, and poor decision-making. Frequent trades erode profits through brokerage fees and slippage. More importantly, it leads to mental exhaustion, increasing the likelihood of impulsive actions.
The fix: Focus on quality, not quantity. A single high-probability setup can be more profitable than 10 random ones. Define your trading plan and stick to it — trade only when the odds align with your edge.
Remember: patience pays more than constant participation.
3. Ignoring the Power of Emotions
Trading is as much a psychological game as it is a financial one. Emotions like fear, greed, and impatience cloud rational judgment, turning what should be a strategic activity into an emotional rollercoaster.
The mistake: Traders panic-sell during drawdowns or chase prices when they see momentum building.
The cost: Fear often causes traders to exit winning positions too early, while greed makes them hold losing ones for too long. Both habits destroy risk-reward balance and long-term profitability.
The fix: Develop emotional discipline. Stick to predefined rules. Consider journaling your trades and feelings to identify emotional triggers. Meditation, mindfulness, or even stepping away from screens can help maintain balance.
Markets reward logic, not emotion.
4. Lack of a Trading Plan
Without a structured plan, trading becomes guesswork — and guesswork rarely pays.
The mistake: Many traders enter trades based on “gut feeling” or tips from others. They lack clear entry and exit rules, risk limits, or defined objectives.
The cost: Inconsistent results and an inability to measure performance. Without a plan, traders don’t know what’s working or failing, making improvement impossible.
The fix: Every trader should build a Trading Plan that includes:
Market selection (e.g., equities, commodities, forex)
Entry/exit rules
Stop-loss and take-profit strategy
Risk per trade
Maximum drawdown tolerance
Time commitment and review schedule
Once you have a plan — follow it with discipline. Adjust it only after analyzing sufficient data, not on emotion.
5. The Dangers of Averaging Down
Averaging down — buying more of a losing position — is one of the most expensive mistakes traders make. It stems from ego and denial.
The mistake: When a stock drops, traders add more, believing it’s “cheaper now.” They hope the market will reverse.
The cost: If the trend continues downward, losses multiply quickly. Averaging down can turn a small, manageable loss into a portfolio disaster.
The fix: Respect stop-losses. Never add to a losing trade unless it’s part of a pre-tested, rule-based scaling strategy. The best traders add to winning positions, not losing ones.
Hope is not a trading strategy.
6. FOMO and Chasing Trends
The Fear of Missing Out (FOMO) is a modern-day trading plague. Watching others profit from a sharp rally often triggers impulsive buying — usually right before the trend reverses.
The mistake: Entering trades too late, when prices are overextended.
The cost: Buying at tops and selling at bottoms. The emotional rush of chasing momentum leads to poor entries and steep losses.
The fix: Accept that missing some moves is part of trading. Opportunities never end; markets are infinite. Instead of chasing, plan your entries ahead — set alerts and wait for pullbacks.
Discipline will always beat excitement.
7. Neglecting Market Conditions
A strategy that works in a trending market might fail miserably in a choppy one. Many traders ignore the context in which they are trading.
The mistake: Applying the same approach regardless of volatility, liquidity, or trend conditions.
The cost: Misaligned trades — for example, trend-following in sideways markets or scalping in low-volume environments.
The fix: Always assess market structure before trading. Identify whether the market is trending, consolidating, or reversing. Adjust position size, targets, and stop-loss accordingly.
Adaptation is the hallmark of professional trading.
8. Lack of Continuous Learning
Markets evolve — what worked yesterday might not work tomorrow. Many traders, after some early success, stop learning and refining their edge.
The mistake: Relying on outdated strategies or ignoring new tools like algorithmic signals, volume profiles, or AI-based analysis.
The cost: Reduced performance and missed opportunities. The cost of stagnation is gradual but devastating.
The fix: Treat trading as a lifelong learning process. Read, backtest, follow credible analysts, and review your trades weekly. Stay flexible and open-minded.
In trading, education is cheaper than ignorance.
9. Ignoring Position Sizing
Even with a good strategy, poor position sizing can lead to disaster.
The mistake: Betting too big when confident and too small when uncertain — purely based on emotion.
The cost: Volatile results and emotional burnout. Large positions increase stress and magnify mistakes.
The fix: Use a consistent formula, such as the 2% rule, meaning you risk only 2% of capital per trade. Position sizing should depend on stop-loss distance and account equity, not “gut feeling.”
Consistency builds compounding.
10. Revenge Trading
After a loss, some traders immediately jump into another trade, desperate to recover. This is known as revenge trading — a fast track to bigger losses.
The mistake: Trading emotionally after a setback without analysis or patience.
The cost: Poor entries, disregard for setups, and compounding losses. It also damages psychological balance.
The fix: Accept losses as part of the business. Take a break after significant drawdowns. Review what went wrong before returning to the market.
In trading, emotional control is wealth control.
11. Neglecting Data and Journaling
Professional traders analyze data — amateur traders rely on memory. The absence of trade journaling means lessons are forgotten, and mistakes are repeated.
The mistake: Not recording trades, reasoning, and emotional state.
The cost: Inability to identify patterns of success or failure. Without analytics, improvement is random.
The fix: Maintain a trading journal noting entry/exit points, market context, emotions, and results. Over time, this becomes a goldmine of self-knowledge.
You can’t fix what you don’t measure.
12. Blindly Following Others
Social media, Telegram groups, and “expert” calls have created a dangerous herd mentality in trading.
The mistake: Copying trades of others without understanding the logic behind them.
The cost: When trades go wrong — and they often do — followers panic because they lack conviction. Losses multiply due to delayed exits and emotional confusion.
The fix: Learn from others but think independently. Build your own thesis for every trade. Blind faith in “tips” is financial suicide.
Confidence comes from clarity, not consensus.
13. Neglecting the Broader Picture
Focusing only on charts and ignoring macroeconomic factors is another costly error. Economic data, interest rates, and geopolitical events shape price behavior.
The mistake: Overreliance on technicals without considering news or sentiment shifts.
The cost: Unexpected volatility and stop-loss hits during major announcements.
The fix: Combine technical and fundamental awareness. Track calendars for earnings, policy announcements, and macro events.
Markets move because of context, not just candles.
14. Misunderstanding Leverage
Leverage amplifies both profits and losses. Many traders misuse it, seduced by the idea of “fast money.”
The mistake: Using excessive leverage without understanding margin requirements or potential drawdowns.
The cost: A small price move against your position can trigger a margin call or total account wipeout.
The fix: Use leverage cautiously. Consider it a double-edged sword. If your system isn’t consistently profitable, leverage will only accelerate losses.
Leverage doesn’t make you rich — discipline does.
15. Failure to Accept Mistakes
The most expensive mistake of all is not learning from mistakes. Every loss has a lesson, but many traders refuse to confront their errors, blaming the market instead.
The mistake: Denial of responsibility and lack of self-assessment.
The cost: Repeating the same pattern until the account is gone.
The fix: Treat every loss as data, not defeat. Review trades weekly. Identify recurring errors and eliminate them.
In trading, humility pays compound interest.
Conclusion: Every Mistake Has a Price — Learn Before You Pay
Trading mistakes are inevitable — but repeating them is optional. Every poor decision has a financial cost, an emotional cost, and an opportunity cost. What separates successful traders from struggling ones isn’t luck or genius; it’s the willingness to analyze, adapt, and evolve.
Avoiding these common mistakes won’t make you instantly rich, but it will prevent you from going broke — and in trading, that’s the real foundation of success.
Master your risk, control your emotions, plan your trades, and treat every mistake as a tuition fee paid to the market. Over time, those lessons compound — just like profits do.
Part 4 Learn Instiutitonal Trading Intrinsic and Time Value
An option’s premium has two parts:
Intrinsic Value: The amount by which an option is “in the money.”
For a call option, it’s the difference between the current price and the strike price.
For a put option, it’s the difference between the strike price and the current price.
Time Value: Represents the potential for the option to gain more value before expiration. The longer the time to expiry, the higher the time value.
Example:
If a stock is trading at ₹1,200 and a call option with a strike price of ₹1,000 is priced at ₹220, then:
Intrinsic Value = ₹200 (₹1,200 - ₹1,000)
Time Value = ₹20 (₹220 - ₹200)

SUZLON 1 Day Time Frame📌 Current price
The stock is trading around ₹53.82 (latest close) according to multiple sources.
🔍 Key levels for the day
Pivot / reference zone: ~ ₹54.22.
Resistance levels:
R1 ~ ₹54.79
R2 ~ ₹55.75
R3 ~ ₹56.32
Support levels:
S1 ~ ₹53.26
S2 ~ ₹52.69
S3 ~ ₹51.73
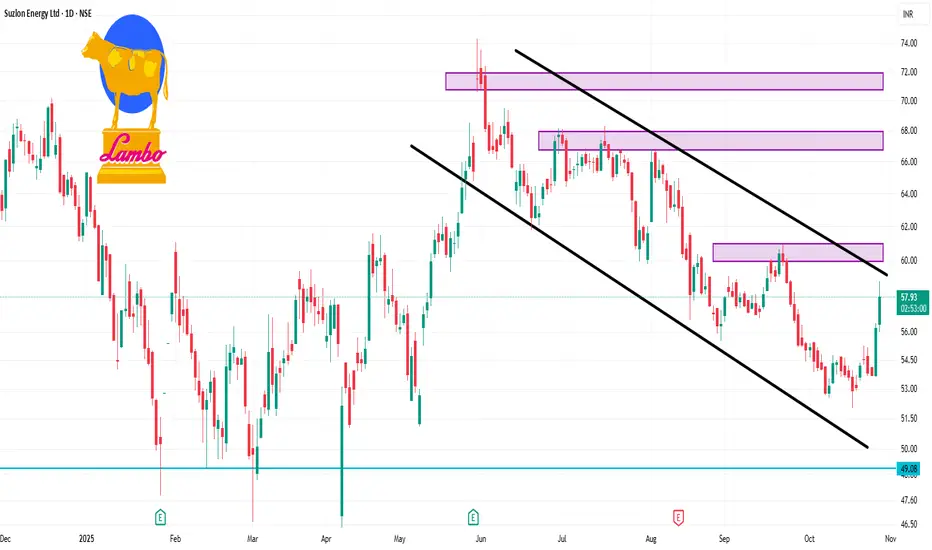
Infrastructure & Capital Goods Momentum: Building India’s Growth1. Sector Overview: Foundation of Economic Growth
The Infrastructure and Capital Goods sectors are closely linked yet distinct in nature.
Infrastructure represents the creation of physical assets like roads, highways, airports, ports, metros, power grids, pipelines, and urban development projects.
Capital Goods refers to manufacturing equipment and machinery used in producing goods and services — such as engineering equipment, construction machinery, electrical systems, heavy vehicles, and automation tools.
Together, these sectors form the backbone of industrial expansion. When infrastructure improves, industrial productivity rises. And when capital goods companies thrive, it indicates that industries are investing in new capacities — a key sign of economic confidence.
2. Revival of the Capex Cycle
After nearly a decade of subdued corporate investment post-2012, India’s private capital expenditure is witnessing a broad-based revival.
Several trends are converging to create this momentum:
Government-Led Push:
The Indian government’s capital expenditure has increased by over 3.5x since FY17, with infrastructure allocations crossing ₹11 lakh crore in Budget FY25. Flagship programs like Gati Shakti, National Infrastructure Pipeline (NIP), and PM Gati Shakti Master Plan are ensuring integrated infrastructure development.
Private Sector Reinvestment:
After years of deleveraging, Indian corporates have cleaned up their balance sheets. Now, with improved demand visibility and strong profitability, private players are again investing in capacity expansion — especially in sectors like cement, steel, energy, and manufacturing.
PLI and Make-in-India Push:
The Production Linked Incentive (PLI) schemes across multiple sectors — including electronics, auto components, renewables, and defence — are catalyzing fresh capital investments. This, in turn, is boosting demand for industrial equipment and capital goods.
Urbanization and Infrastructure Expansion:
India’s urbanization rate, currently around 36%, is expected to cross 40% by 2030. This urban transition is driving demand for smart cities, transport corridors, real estate, and public utilities.
In essence, India’s capex cycle has entered a structurally positive phase — and that’s what’s fueling the ongoing rally in infrastructure and capital goods stocks.
3. Infrastructure Sector Momentum
3.1 Roads & Highways
The roads and highways segment remains the biggest beneficiary of the government’s infrastructure focus. The Ministry of Road Transport & Highways continues to allocate record budgets under the Bharatmala Pariyojana scheme.
Construction pace has averaged 35 km per day, with an aim to cross 45 km/day by 2026.
Companies like IRB Infra, KNR Constructions, HG Infra, and PNC Infratech have witnessed healthy order inflows and margin expansion.
Toll monetization and hybrid annuity models (HAM) have reduced financial risks and ensured sustainable cash flows.
3.2 Railways & Metro Projects
Indian Railways’ capital outlay crossed ₹2.5 lakh crore in FY25, focused on modernization, track electrification, and station redevelopment.
Metro rail expansion in Tier-2 cities (like Surat, Patna, Nagpur, and Indore) is opening new project opportunities.
Stocks like IRCON, RVNL, RITES, and Titagarh Rail Systems have gained sharply due to strong order pipelines and profitability visibility.
3.3 Power & Energy Infrastructure
The power infrastructure story is evolving beyond traditional generation to transmission and renewable integration.
Companies like Power Grid, KEC International, Techno Electric, and Kalpataru Projects are winning large transmission and substation orders.
The upcoming Green Energy Corridors project and National Smart Grid Mission are creating long-term opportunities in grid modernization and electrification.
3.4 Urban Infra & Water Management
Urban infrastructure — including housing, water supply, sanitation, and waste management — is gaining momentum under AMRUT 2.0, Jal Jeevan Mission, and Smart City Mission.
Players like VA Tech Wabag, L&T Construction, and NCC Ltd. are executing large urban infra contracts.
Demand for efficient project management and technology integration is driving digitalization in infra execution.
4. Capital Goods Sector Momentum
The capital goods sector’s resurgence is a clear signal that industrial demand is returning. This segment has seen a sharp order inflow in FY24-FY25, driven by public and private capex revival.
4.1 Industrial Equipment & Engineering
Companies such as Larsen & Toubro (L&T), ABB India, Siemens, and Thermax are reporting record order books.
L&T’s order inflow has crossed ₹3.3 lakh crore, with visibility across oil & gas, defence, power, and infrastructure.
Engineering exports have also picked up due to global supply chain diversification, giving Indian firms an edge.
4.2 Electrical & Automation
The automation and electrification segments are witnessing significant growth due to India’s industrial digitization wave.
ABB, Siemens, and Schneider Electric are benefiting from demand for smart factories, process automation, and EV charging infrastructure.
Domestic players like CG Power and Industrial Solutions, KEC, and Polycab are seeing strong growth in transformers, cables, and industrial systems.
4.3 Defence & Aerospace Manufacturing
The government’s push for Atmanirbhar Bharat in defence production is reshaping the landscape.
With import substitution policies and 74% FDI allowance in defence manufacturing, companies like HAL, BEL, Bharat Dynamics, and Mazagon Dock are expanding capacity.
Defence PSUs have robust order books and steady revenue visibility for the next 4–5 years.
4.4 Machinery & Construction Equipment
The construction equipment segment is riding the infrastructure boom.
ACE, JCB India, and Tata Hitachi are seeing high utilization and sales volumes.
The mechanization of rural infrastructure and smart city projects is further expanding their market.
5. Financial Performance & Market Trends
5.1 Order Book Strength
Order books across infrastructure and capital goods companies have hit multi-year highs.
For instance:
L&T’s consolidated order book: ₹4.8 lakh crore
ABB India’s order inflow growth: 25% YoY
IRCON, RVNL, and RITES: Combined orders exceeding ₹1 lakh crore
These numbers highlight strong execution visibility for the next 2–3 years.
5.2 Margin Expansion
With raw material prices stabilizing and better execution efficiency, companies are reporting operating margin improvement.
Project delays are reducing due to better financing models and project management tools.
5.3 Stock Market Momentum
Both sectors have been market leaders in the 2024–2025 rally:
The BSE Capital Goods Index surged over 60% YoY, outperforming the Sensex.
The Infrastructure Index gained nearly 45% YoY, led by PSUs and construction majors.
Retail and institutional investors have increased exposure, especially in public-sector and midcap engineering stocks.
6. PSU Leadership: The New Growth Drivers
Public Sector Undertakings (PSUs) have emerged as major beneficiaries of this momentum.
Companies like BEL, BHEL, RVNL, NBCC, and IRCON have delivered multi-bagger returns in the past two years.
These PSUs are executing large government projects with improved financial discipline and better dividend payouts.
Investor perception has shifted — PSUs are no longer “value traps,” but strategic growth vehicles aligned with national infrastructure goals.
7. Key Growth Drivers Ahead
Budgetary Allocation Continuity:
The government’s FY26 budget is likely to sustain high capital expenditure, ensuring visibility for the next several years.
Private Capex Acceleration:
Sectors like cement, metals, renewables, and chemicals are entering new capacity expansion phases, boosting machinery and engineering demand.
Green & Renewable Transition:
India’s target of 500 GW renewable capacity by 2030 will generate opportunities across energy transmission, grid modernization, and clean tech equipment.
Global Supply Chain Realignment:
Multinational companies are diversifying away from China, positioning India as a manufacturing hub — benefiting domestic capital goods makers.
Digital & Automation Integration:
The adoption of industrial automation, robotics, and IoT is creating long-term opportunities for high-tech engineering firms.
8. Challenges and Risks
While the outlook remains robust, certain risks need monitoring:
Execution Delays: Large infra projects still face bureaucratic and land acquisition challenges.
Commodity Price Volatility: Sudden spikes in steel, cement, or copper prices can affect margins.
Interest Rate Sensitivity: Infrastructure companies are capital-intensive, and high borrowing costs can impact profitability.
Global Demand Slowdown: Exports of capital goods may face headwinds if global growth slows in 2025–2026.
9. Investment Outlook: Sustained Multi-Year Opportunity
The Infrastructure & Capital Goods theme represents one of the strongest multi-year investment opportunities in India’s growth story.
Key investment themes include:
PSU Infrastructure Leaders: IRCON, RVNL, BEL, NBCC
Private Engineering Majors: L&T, Siemens, ABB, Thermax
Construction & EPC Specialists: KNR Constructions, HG Infra, NCC, Kalpataru
Electrical Equipment & Automation: CG Power, Polycab, KEI Industries, KEC International
Investors should focus on companies with:
High order book-to-revenue ratios
Healthy balance sheets
Strong execution track records
Exposure to sunrise sectors like renewables, defence, and automation
10. Conclusion
India’s Infrastructure and Capital Goods momentum marks the beginning of a new growth era.
After years of policy groundwork, the country is witnessing the materialization of its infrastructure dreams — from world-class highways to modern railways, from green energy corridors to smart cities.
The capital goods industry, in turn, is powering this transformation with engineering excellence, technological adoption, and renewed corporate confidence.
With government capex and private investments working in tandem, these sectors are not just cyclical plays anymore — they represent structural growth themes for the next decade.
As India builds the foundation for its $5 trillion economy target, Infrastructure and Capital Goods will remain its most powerful pillars — delivering both economic strength and market leadership.

IT Sector Reversal Plays1. Background: The Downtrend in the IT Sector
From 2022 to mid-2024, the Indian IT sector witnessed a significant correction. After peaking during the pandemic-era digital boom, IT stocks went through a period of multiple headwinds:
Margin pressures due to rising employee costs and elevated attrition.
Slowdown in global tech spending, especially in the U.S. and Europe, as clients became cautious about discretionary IT projects.
Macroeconomic uncertainty—rising interest rates, inflation, and recession fears affected deal pipelines.
Valuation compression after excessive run-ups during 2020–2021.
Major companies like Infosys, TCS, Wipro, HCLTech, and Tech Mahindra faced 25–40% price corrections from their highs. Even mid-cap IT names such as LTIMindtree, Coforge, Mphasis, and Persistent Systems lost significant value as growth visibility weakened.
But as markets evolve, every extended correction eventually sets the stage for a reversal — and that’s where the IT sector stands now.
2. The Current Setup: Signs of Reversal Emerging
Since mid-2024, a gradual shift in market tone has become visible. Several indicators now suggest the IT sector could be transitioning from a bearish phase to a structural recovery phase. Let’s break down the key reversal signals:
a) Technical Bottom Formation
The Nifty IT Index, after correcting nearly 35% from its 2021 peak, has formed a strong multi-quarter base around the 28,000–30,000 range.
Higher lows are visible on weekly charts, indicating that selling pressure is subsiding.
Volume spikes during up-moves suggest accumulation by institutional investors.
The 200-day moving average (DMA), which acted as resistance for nearly two years, has now been decisively reclaimed by most IT heavyweights.
Relative Strength Index (RSI) readings have shifted from bearish to neutral-bullish territory (above 50), reinforcing momentum buildup.
b) Valuation Comfort Zone
Post-correction, the sector’s valuation multiples have normalized:
The Nifty IT Index trades at 20–22x forward earnings, compared to 32–35x at the 2021 peak.
This makes the risk–reward ratio attractive, especially with improving earnings visibility in FY26.
c) Macro Tailwinds Re-emerging
Global inflation has cooled off, prompting central banks like the U.S. Federal Reserve to hint at rate cuts. Lower interest rates support IT spending, especially on digital transformation and cloud modernization.
Dollar stability and moderate INR depreciation enhance revenue visibility for export-heavy Indian IT companies.
The AI and automation cycle is creating fresh demand pockets across industries, opening new revenue streams.
Together, these factors suggest that the worst may be behind the IT sector, setting the stage for meaningful reversals.
3. Fundamental Triggers Behind the Reversal
Beyond charts and valuations, several fundamental developments are adding strength to the reversal narrative.
a) Rebound in Deal Wins
In recent quarters, large-cap IT companies have reported healthy deal signings:
TCS and Infosys are witnessing multi-year transformation contracts from BFSI, retail, and manufacturing clients.
HCLTech and LTIMindtree are leading in cloud modernization and digital engineering deals.
Tech Mahindra has stabilized its communications business and is pivoting to AI-driven customer experience solutions.
Total contract value (TCV) figures have improved sequentially, reflecting a revival in client confidence.
b) Margin Recovery
After years of pressure from rising wage costs and attrition, IT firms are now benefiting from:
Lower employee churn (attrition down to 13–14% vs. 22–24% in FY23).
Reduced subcontracting expenses as project utilization improves.
AI-driven productivity tools reducing manpower dependency.
Together, these trends are expected to lift operating margins by 100–150 bps over FY26.
c) Cost Optimization and Automation Push
Indian IT companies are actively adopting Generative AI, automation platforms, and cloud-based delivery models to improve productivity and reduce delivery costs.
Examples include:
Infosys’ Topaz platform,
TCS’ AI.WorkBench, and
HCLTech’s AI Force initiative.
These not only enhance efficiency but also attract higher-value projects, boosting profitability and client stickiness.
d) Demand Diversification
While BFSI and telecom remain key verticals, growth is emerging from manufacturing, energy, healthcare, and retail—driven by Industry 4.0, sustainability analytics, and customer experience technologies.
4. Leadership Rotation Within the Sector
Not all IT stocks will perform equally during a reversal. Leadership rotation is already visible across categories:
a) Large-Cap Leaders
TCS: Stable growth, superior margins, strong AI pipeline. Technically leading with a breakout above long-term resistance near ₹4,200.
HCLTech: Operational excellence, resilient client mix, and cloud deals supporting momentum.
Infosys: Recovering from weak quarters; strong positioning in digital transformation and automation.
These stocks form the anchor base of the reversal.
b) Mid-Cap Outperformers
Mid-cap IT names often outperform in the second phase of reversals due to higher growth potential.
Coforge: Strong U.S. exposure, digital engineering capabilities.
LTIMindtree: Aggressive client acquisition and synergistic benefits post-merger.
Persistent Systems: Consistent revenue growth from AI, data analytics, and product engineering.
Mphasis: Benefiting from stability in BFSI and new-gen cloud deals.
c) Small-Cap Recovery Plays
Select niche players such as Sonata Software, Birlasoft, and Zensar Technologies are showing early breakout structures, driven by turnaround earnings and margin expansion.
5. Institutional Flows and Market Sentiment
Foreign Institutional Investors (FIIs), who were heavy sellers in IT during 2022–2023, have returned to the sector in 2025 as valuations turned attractive and U.S. recession fears faded.
Data shows:
FIIs have increased exposure to IT by nearly 12% over the last two quarters.
Domestic Mutual Funds are also raising IT weights in portfolios, reversing the underweight stance.
This institutional participation is a critical confirmation of a sectoral reversal, indicating confidence in medium-term earnings visibility.
6. The Role of AI and Digital Transformation
A structural driver of the IT sector’s next growth cycle will be Artificial Intelligence (AI) and GenAI-led transformation. Global enterprises are investing heavily in:
AI-driven automation of business workflows,
Cloud data modernization,
Predictive analytics, and
Cybersecurity.
Indian IT companies, with their massive engineering talent and delivery scale, are strategically positioned to capture a significant portion of this demand.
This emerging AI monetization cycle could power the next 3–5 years of sustainable growth, making the ongoing reversal more structural than cyclical.
7. Potential Risks to the Reversal
While optimism is building, investors must remain aware of risks that could slow or invalidate the reversal:
Global demand slowdown due to renewed economic shocks.
Currency volatility, especially sharp INR appreciation against USD.
Delay in AI monetization or overhyped expectations.
Geopolitical disruptions in the U.S. or Europe impacting client budgets.
However, these risks appear manageable in the current macro context, with most IT companies maintaining strong balance sheets and consistent cash flows.
8. Strategic Outlook: How Traders and Investors Can Play the Reversal
a) Short-Term Traders
Focus on momentum plays — buying on dips near support zones and exiting near resistance.
Use RSI and volume confirmation for entry points.
b) Positional Investors
Build exposure in phased accumulation, especially in large-cap names like TCS, Infosys, and HCLTech, as they offer stability and dividend yield.
c) Aggressive Investors
Look toward mid-cap IT with improving earnings visibility — Coforge, Persistent, and LTIMindtree — for higher alpha generation during the reversal.
d) Long-Term Portfolio Builders
Adopt a three-year horizon, aligning with the global digital and AI transformation wave. The IT sector’s structural uptrend could mirror the 2013–2017 rally phase.
Conclusion: From Fear to Opportunity
The Indian IT sector stands at a pivotal juncture in late 2025. After nearly three years of correction and consolidation, the stage appears set for a broad-based reversal, driven by:
Stabilizing global macro conditions,
Margin recovery and deal wins,
AI-led transformation opportunities, and
Renewed institutional participation.
From a market structure perspective, IT is shifting from accumulation to breakout, making it one of the most promising contrarian plays heading into FY26.
In essence, “IT Sector Reversal Plays” are not just short-term technical bounces but potentially the beginning of a multi-year structural recovery, where leadership will rotate from defensive large caps to agile mid-cap innovators.
For investors with patience, discipline, and an eye on evolving technology trends, this reversal could mark the next wealth creation phase in India’s capital markets.

Midcap & Smallcap Index Volatility1. Understanding Midcap and Smallcap Indices
Before diving into volatility, it’s important to understand what midcap and smallcap indices represent.
Nifty Midcap 100 Index: This tracks the performance of the top 100 mid-sized companies listed on NSE, ranked from 101 to 200 by full market capitalization.
Nifty Smallcap 100 Index: This tracks the next 100 companies, ranked from 201 to 300 by market capitalization.
These indices help investors monitor the performance of mid- and small-sized businesses in India — companies that are neither as large nor as stable as blue-chip giants, but often more dynamic, growing, and entrepreneurial in nature.
2. What Is Volatility?
Volatility is a measure of how much and how quickly the price of a stock or index moves over a period of time. In simple words, it reflects the degree of price fluctuation.
High volatility: Prices move sharply up or down within short periods.
Low volatility: Prices move gradually or remain relatively stable.
For example, if the Nifty Midcap 100 rises 2% one day, falls 3% the next, and rises 4% the following day, it’s showing high volatility. In contrast, the Nifty 50 (large-cap) might move only ±0.5% on average during the same period.
Volatility can be historical (based on past price movements) or implied (based on expectations embedded in options pricing). In this explanation, we focus mainly on historical and structural volatility of midcap and smallcap indices.
3. Why Midcap and Smallcap Indices Are More Volatile
There are several reasons why these segments show higher volatility than large caps:
(a) Liquidity Constraints
Midcap and smallcap stocks are often less liquid, meaning fewer buyers and sellers trade them compared to large caps. As a result, even small trading volumes can lead to large price swings.
For instance, a ₹10 crore order might barely move Reliance Industries’ price but can cause a 5–10% jump or fall in a smallcap company.
(b) Limited Institutional Participation
Large-cap stocks attract foreign institutional investors (FIIs) and domestic mutual funds due to their size, governance, and liquidity. Midcaps and smallcaps, however, often have limited institutional coverage.
This means retail sentiment can heavily influence prices, increasing volatility.
(c) Business Fragility
Smaller companies generally face higher business risks — such as dependence on fewer products, markets, or clients. During economic slowdowns, their earnings can decline sharply, which directly reflects in stock prices.
(d) Information Asymmetry
Midcap and smallcap companies often have limited analyst coverage, and information about their operations, financials, or management decisions may not be widely available.
This creates uncertainty, and uncertainty breeds volatility.
(e) Retail and Momentum Trading
Retail traders dominate the smallcap segment, and many of them chase momentum rather than fundamentals. When stocks rally, more traders jump in, fueling a sharp rise; when prices fall, panic selling intensifies — both driving up volatility.
4. Historical Perspective of Midcap & Smallcap Volatility
Over the past decade, Indian midcap and smallcap indices have displayed cycles of extreme outperformance followed by deep corrections. Let’s look at key phases:
(i) 2014–2017: The Bull Run
Post the 2014 general elections, midcaps and smallcaps experienced a historic rally.
Economic optimism, policy reforms, and liquidity inflows lifted investor confidence.
Between 2014 and 2017, the Nifty Midcap 100 delivered over 100% returns, and the Smallcap 100 gained more than 120%.
However, this sharp rise came with high volatility — daily swings of 1.5–3% were common.
(ii) 2018–2019: Sharp Correction
After years of outperformance, valuations became stretched.
Rising interest rates, liquidity concerns, and corporate defaults triggered a massive correction.
The Smallcap index fell over 30–40% from its peak, while the Midcap index dropped around 25–30%.
This period highlighted the downside volatility risk of small companies.
(iii) 2020: Pandemic Crash and Recovery
The COVID-19 crash in March 2020 wiped out years of gains in weeks. The Smallcap index fell over 45% in less than a month.
However, when liquidity flooded the market later in 2020–21, these same indices rebounded dramatically — doubling or tripling in value.
This shows how midcap and smallcap volatility cuts both ways — losses and gains.
(iv) 2023–2024: New Volatility Phase
Post-2023, the Indian smallcap and midcap segments once again became hot due to strong retail inflows, mutual fund SIPs, and manufacturing revival themes.
But by mid-2024, SEBI and AMFI began cautioning investors about overheated valuations, leading to bouts of profit booking and corrections — clear signs of rising volatility again.
5. Measuring Volatility
Volatility can be quantified using several metrics:
(a) Standard Deviation
It measures how much daily returns deviate from the average return.
A higher standard deviation means higher volatility.
For example:
Nifty 50 annualized volatility: around 10–12%
Nifty Midcap 100: around 18–22%
Nifty Smallcap 100: around 24–30%
(b) Beta (β)
Beta measures how much an index moves relative to a benchmark (like Nifty 50).
Midcap index beta ≈ 1.3–1.5
Smallcap index beta ≈ 1.6–1.8
This means smallcaps move almost 1.8 times more than large caps on average.
(c) India VIX vs. Segment Volatility
While India VIX reflects volatility expectations of the Nifty 50, the implied volatility for smallcap/midcap stocks tends to be higher during uncertain or speculative phases.
6. Factors Influencing Volatility in Midcaps & Smallcaps
(a) Economic Conditions
Mid- and small-sized companies are highly sensitive to economic cycles.
When GDP growth slows or interest rates rise, these businesses often suffer earlier than large caps.
(b) Liquidity Flow
Mutual fund and retail inflows can fuel rallies; sudden outflows can trigger steep declines.
(c) Corporate Earnings
Since many midcap and smallcap companies have small profit bases, even small fluctuations in earnings can lead to big price changes.
(d) Market Sentiment
These indices are more sentiment-driven. Positive narratives like “Make in India,” “Renewable Energy,” or “Defence Manufacturing” often create sharp thematic rallies.
(e) Global Triggers
Although midcap and smallcap companies are mostly domestic-focused, global events (like oil price spikes, US Fed rate hikes, or geopolitical tensions) can still affect them via liquidity or risk appetite channels.
7. The Double-Edged Sword of Volatility
Volatility in midcap and smallcap indices isn’t inherently bad — it’s a double-edged sword.
For traders, volatility provides opportunities for quick profits. Price swings mean frequent entry and exit points.
For investors, it offers chances to buy quality companies at lower valuations during corrections.
However, volatility also brings emotional stress and the risk of large losses if one chases momentum blindly.
8. Managing Volatility – Risk Control Strategies
Here’s how traders and investors can handle volatility in midcap and smallcap segments:
(a) Diversification
Avoid concentrating too much capital in a few small stocks. Spread exposure across sectors to reduce specific risk.
(b) Staggered Investment
Use Systematic Investment Plans (SIPs) or phased buying instead of lump-sum entries to average out volatility.
(c) Quality Filter
Focus on companies with:
Strong balance sheets
Consistent earnings
Low debt-to-equity ratios
Credible management
Not all smallcaps are speculative — many future large-caps emerge from this space.
(d) Technical & Volume Analysis
Traders can use volume profile, moving averages, and support-resistance levels to gauge strength and avoid entering during euphoria or exhaustion phases.
(e) Stop-Loss Discipline
Always use predefined stop-loss levels to protect against deep drawdowns.
(f) Macro Monitoring
Keep an eye on:
RBI’s monetary policy
Inflation trends
FIIs’ flow data
Fiscal deficit
as these macro factors influence liquidity and sentiment — the lifeblood of mid/smallcap rallies.
9. Psychological Aspect of Volatility
Volatility tests not just portfolios but also patience and psychology.
When prices fall sharply, retail investors often panic and sell at lows. Conversely, when prices surge, they chase high-flying stocks at inflated valuations.
Successful participants in midcap/smallcap segments are those who:
Think long-term
Avoid herd mentality
Use volatility as a friend, not an enemy
Remember Warren Buffett’s words:
“Be fearful when others are greedy, and greedy when others are fearful.”
That advice fits midcap and smallcap investing perfectly.
10. Current Scenario (2025 Outlook)
As of late 2025, volatility in midcap and smallcap indices remains elevated due to multiple factors:
Concerns over stretched valuations
Shifts in interest rate expectations
Sector rotations between infrastructure, renewables, and financials
Heavy retail participation via smallcap mutual funds and direct trading
Regulatory bodies like SEBI and AMFI continue monitoring fund inflows to ensure stability. Meanwhile, many analysts suggest stock-specific investing instead of chasing the broader index, as valuations in some pockets remain high.
In short:
Volatility = Opportunity + Risk
Selectivity = Survival
11. Conclusion
Midcap and smallcap indices are the heartbeat of India’s growth story. They represent emerging leaders, innovative businesses, and fast-expanding industries. However, with high potential comes high volatility.
Key takeaways:
Midcaps and smallcaps are structurally more volatile than large caps due to liquidity, size, and sentiment factors.
Their volatility can amplify both bullish rallies and bearish corrections.
Understanding volatility helps traders time entries better and helps investors hold quality names with conviction.
Risk management, diversification, and patience are essential tools for navigating this roller coaster.
In essence, midcap and smallcap volatility is not something to fear — it’s something to respect and manage. For those who understand its rhythm, volatility becomes a powerful ally in building long-term wealth.

Renewable & Energy Transition Stocks – The Future of Sustainable1. Introduction: The Global Energy Shift
The 21st century has witnessed a dramatic transformation in how the world generates and consumes energy. The era of fossil fuels — coal, oil, and gas — which once powered industrial revolutions and global economies, is now giving way to cleaner, sustainable alternatives. This shift, termed the Energy Transition, refers to the movement from carbon-intensive energy sources to low-carbon and renewable ones like solar, wind, hydro, bioenergy, and green hydrogen.
The driving forces behind this transition are multifold:
Climate Change Concerns: Rising global temperatures and carbon emissions have triggered urgent calls for decarbonization.
Technological Advancements: The cost of solar and wind energy has fallen by over 80% in the last decade.
Government Policies: Global accords like the Paris Agreement and domestic policies such as India’s National Green Hydrogen Mission are pushing clean energy adoption.
Investor Sentiment: ESG (Environmental, Social, Governance) investing has grown exponentially, favoring companies aligned with sustainability.
As a result, renewable and energy transition stocks have emerged as one of the most exciting themes in modern markets, offering long-term growth prospects while aligning with global sustainability goals.
2. Understanding Renewable & Energy Transition Stocks
Renewable and energy transition stocks are companies involved in producing, developing, or enabling clean and sustainable energy technologies. These may include:
Renewable energy producers – Solar, wind, hydro, geothermal.
Equipment manufacturers – Solar panels, wind turbines, inverters.
Energy storage & battery companies – Lithium-ion, solid-state batteries.
Green hydrogen producers – Companies working on electrolysis and hydrogen fuel infrastructure.
Electric vehicle (EV) ecosystem firms – Battery suppliers, charging network operators, EV manufacturers.
Grid modernization and smart energy firms – Companies enabling efficient distribution and storage of renewable energy.
These businesses are at the forefront of what is often called the “Green Industrial Revolution.”
3. The Global Landscape of Renewable Energy
Globally, renewable energy has reached an inflection point. According to the International Energy Agency (IEA), renewables are expected to account for more than 50% of global electricity generation by 2030.
Key trends include:
Solar Power Boom: Solar PV capacity is doubling roughly every three years, making it the cheapest energy source in many regions.
Wind Energy Expansion: Offshore wind is gaining strong momentum in Europe and Asia.
Battery Storage Growth: Global battery capacity is projected to grow 20-fold by 2030, crucial for stabilizing intermittent renewable sources.
Green Hydrogen Revolution: Countries like Japan, Germany, and India are investing billions to develop hydrogen as a clean fuel alternative for heavy industries and transport.
Carbon Trading & ESG Investing: Institutional investors are allocating capital towards companies that meet sustainability benchmarks.
4. India’s Renewable Energy Revolution
India has emerged as a global leader in renewable energy adoption. With a strong policy push, ambitious targets, and a growing domestic industry, India’s clean energy ecosystem is rapidly expanding.
Key Highlights:
Installed Renewable Capacity: Over 190 GW (as of 2025), out of a total power capacity of ~440 GW.
Target: 500 GW of non-fossil fuel-based capacity by 2030.
Solar Energy: India ranks among the top 5 globally in solar installations, driven by states like Rajasthan, Gujarat, and Tamil Nadu.
Wind Power: Tamil Nadu and Gujarat lead India’s onshore wind capacity.
Hydrogen & EV Push: The National Green Hydrogen Mission aims to make India a global hub for hydrogen production and export.
Government Support: Initiatives like the PLI (Production Linked Incentive) schemes, Renewable Purchase Obligations (RPOs), and Carbon Credit Frameworks are fueling sectoral growth.
5. Major Segments in the Energy Transition Ecosystem
A. Solar Energy
Solar power is the crown jewel of the renewable revolution. Falling panel costs, improved efficiency, and government subsidies have made it highly competitive.
Key Indian Players:
Adani Green Energy Ltd. (AGEL): One of the world’s largest solar power developers with over 20 GW pipeline projects.
Tata Power Renewable Energy Ltd.: Focused on solar EPC, rooftop solar, and battery storage.
Waaree Energies & Vikram Solar: Leading module manufacturers benefiting from domestic demand and exports.
B. Wind Energy
Wind remains a crucial pillar, particularly for coastal and high-wind states.
Key Players:
Suzlon Energy Ltd.: India’s leading wind turbine manufacturer, rebounding from past debt with new orders.
Inox Wind Ltd.: Active in turnkey projects and turbine manufacturing.
C. Energy Storage & Battery Technology
The renewable revolution is incomplete without storage solutions. Batteries stabilize grid supply and support EVs.
Leading Firms:
Amara Raja Energy & Mobility Ltd.
Exide Industries Ltd.
Tata Chemicals (in EV battery materials).
Reliance Industries Ltd. (building Giga factories for cell manufacturing).
D. Electric Vehicles & Charging Infrastructure
EVs are a cornerstone of the clean energy transition. With government incentives (FAME II, PLI), India’s EV ecosystem is expanding fast.
Top Stocks:
Tata Motors: Leading EV carmaker.
Olectra Greentech: Electric bus manufacturer.
Exicom Tele-Systems & Servotech Power Systems: EV charging infrastructure.
Ola Electric: Upcoming IPO; focuses on two-wheelers and battery tech.
E. Green Hydrogen & Fuel Cells
Hydrogen is expected to revolutionize industrial and heavy transport sectors.
Top Indian Participants:
Reliance Industries: Investing heavily in green hydrogen and solar.
NTPC & IOC: Setting up pilot hydrogen projects.
Larsen & Toubro (L&T): Partnering in electrolyzer manufacturing.
F. Power Utilities Transitioning to Green
Traditional energy companies are also diversifying into renewables.
Examples:
NTPC Green Energy Ltd.
JSW Energy Ltd.
Torrent Power Ltd.
These firms are gradually reducing coal dependency and increasing renewable capacity.
6. Financial Performance & Market Trends
Renewable energy stocks have been among the top performers globally over the past five years.
In India, several renewable and transition-related stocks have delivered multibagger returns due to strong project pipelines, policy support, and rising energy demand.
Key Market Drivers:
Falling Input Costs: Lower cost of solar modules, wind turbines, and storage systems.
Strong Policy Support: Clear long-term targets and PLI incentives.
Rising Institutional Interest: ESG and green funds are channeling massive capital into this space.
Corporate Decarbonization Goals: Large corporations are sourcing renewable power for sustainability commitments.
However, volatility remains due to:
Supply chain disruptions (solar modules, lithium).
Interest rate fluctuations impacting capital-intensive projects.
Policy execution delays in large-scale installations.
7. Global Leaders in Renewable & Transition Stocks
Globally, several companies lead the charge:
NextEra Energy (USA): One of the world’s largest renewable power generators.
Enphase Energy & SolarEdge (USA): Specialize in solar inverters and microinverters.
Vestas (Denmark) & Siemens Gamesa (Spain): Global wind turbine giants.
Plug Power (USA) & Nel ASA (Norway): Leaders in hydrogen technology.
Tesla (USA): Beyond EVs, Tesla’s energy division is revolutionizing battery storage and solar solutions.
These global firms often set benchmarks for innovation and profitability in the sector, influencing investor sentiment in emerging markets like India.
8. Government Policies Driving India’s Energy Transition
India’s renewable momentum is underpinned by robust government initiatives:
National Solar Mission: Aims to make India a global solar leader.
PLI Scheme for Solar & Batteries: Incentives for domestic manufacturing to reduce import dependency.
Green Hydrogen Mission (₹19,744 crore): To produce 5 MMT of green hydrogen annually by 2030.
Energy Conservation Act Amendment (2022): Introduced carbon trading and stricter emission norms.
State-level Net Metering Policies: Promote rooftop solar adoption.
Such initiatives provide long-term policy stability and investor confidence.
9. Challenges Facing the Sector
Despite rapid growth, several hurdles persist:
High Capital Costs: Initial investments remain steep.
Land Acquisition Issues: Large-scale solar and wind projects need vast land areas.
Transmission Constraints: Renewable energy is often produced far from consumption centers.
Storage Limitations: Battery technology, though improving, remains expensive.
Policy Uncertainty: Frequent regulatory changes at the state level can affect project timelines.
Nevertheless, technology improvements and economies of scale are expected to reduce these challenges over time.
10. Future Outlook (2025–2035)
The next decade is expected to be transformational for renewable and energy transition stocks.
Growth Catalysts:
India’s commitment to Net Zero by 2070 ensures decades of policy and investment support.
Corporate Power Purchase Agreements (PPAs) will boost renewable demand.
Hydrogen & Battery Ecosystem Development will attract global partnerships.
Digitalization & AI Integration in energy management will improve efficiency.
Global Capital Inflows: Sovereign and ESG funds are increasing allocations to clean energy projects.
By 2030, India could see over $250 billion in renewable investments, creating immense opportunities for investors.
11. Investment Perspective: How to Approach the Sector
From an investment standpoint, renewable & transition stocks can be categorized as:
Core Energy Producers: Adani Green, NTPC Green, JSW Energy.
Equipment Manufacturers: Waaree Energies, Suzlon, Inox Wind.
Storage & Battery Makers: Amara Raja, Exide, Tata Chemicals.
EV Ecosystem Players: Tata Motors, Olectra, Servotech Power.
Diversified Conglomerates: Reliance, L&T, IOC (expanding into hydrogen and renewables).
Investors should focus on:
Long-term vision: These are structural growth stories, not short-term trades.
Strong balance sheets: Many players are capital-intensive.
Government-backed projects: Ensure visibility of revenues.
Technological advantage: Efficiency and innovation lead to higher margins.
12. Conclusion: The Dawn of a Green Era
The energy transition is not merely a policy trend — it’s a paradigm shift reshaping the global economy. Renewable and energy transition stocks are at the heart of this transformation, symbolizing the movement toward a sustainable, low-carbon future.
India stands at a unique juncture: with abundant sunlight, a vast coastline for wind potential, supportive policies, and entrepreneurial drive, it is poised to become one of the world’s top green energy hubs.
For investors, the renewable energy sector offers not just returns, but an opportunity to participate in building the energy foundation of the future. While short-term volatility may persist, the long-term trajectory is unmistakably upward — driven by innovation, necessity, and the world’s collective pursuit of sustainability.

Banking Sector Leadership & PSU Bank Rally – A Deep Dive1. Introduction
The Indian stock market has witnessed several phases of leadership rotation over the years. At times, technology stocks dominate; at other times, energy or infrastructure sectors take the front seat. However, whenever the broader market gears up for a major uptrend or a new bull cycle begins, the Banking sector often takes the leadership role — and within that, Public Sector Undertaking (PSU) banks frequently emerge as key outperformers.
The recent rally in PSU banks and the resurgence of the banking sector as a whole highlight not just cyclical market behavior but also deep structural changes in the Indian economy. To understand this movement, it’s important to analyze both why banking leads and what’s fueling the PSU bank rally in particular.
2. Why Banking Sector Often Leads the Market
a. Core to Economic Growth
Banks are the financial backbone of any economy. When economic activity expands — whether through manufacturing, infrastructure, or consumer spending — banks benefit directly. Credit growth picks up, deposit bases rise, and loan demand strengthens. Therefore, the health and momentum of the banking sector often act as a mirror of economic strength.
b. Credit Cycle Expansion
A strong economy usually corresponds to an expanding credit cycle. When businesses borrow more for expansion, and individuals take more loans for consumption (homes, vehicles, education), banks record higher net interest income (NII) and better profitability.
During the early-to-mid phase of a bull market, credit growth typically accelerates sharply, turning the banking sector into a market leader.
c. Interest Rate Cycle and Net Interest Margins
The interest rate environment plays a crucial role. When rates stabilize after a hiking cycle, banks — especially those with a large low-cost deposit base — witness margin expansion. With loan yields rising faster than deposit costs, Net Interest Margin (NIM) improves.
This scenario often unfolds in the mid-stages of economic recovery — precisely when the stock market’s optimism about growth is at its peak.
d. Heavy Market Weightage
In indices like the Nifty 50 and Bank Nifty, banking and financial services account for around 35–40% of total weightage. Naturally, whenever large investors — both domestic and foreign — turn bullish on India, their first entry point is often the banking sector, leading to index-level leadership.
3. Banking Sector’s Structural Transformation
The Indian banking landscape has undergone a major transformation over the last decade — both in private and public sectors.
a. Clean-up of Balance Sheets
Post the 2014–2018 NPA crisis, Indian banks, particularly PSUs, faced massive challenges due to bad loans, corporate defaults, and poor asset quality. The Insolvency and Bankruptcy Code (IBC) and RBI’s asset quality reviews forced banks to recognize, provision, and resolve bad assets.
Today, most major banks — especially SBI, Bank of Baroda, Canara Bank, and Union Bank — have net NPA ratios below 1%–1.2%, compared to 5–6% a few years ago. This clean-up has set the stage for a sustainable recovery.
b. Digitization & Efficiency Gains
The digital transformation in banking — UPI, mobile apps, digital KYC, and paperless loans — has enhanced operational efficiency, reduced cost-to-income ratios, and improved customer acquisition. PSU banks, once lagging behind in technology, have now made significant progress through partnerships with fintechs and internal digital drives (like SBI’s YONO or BoB World).
c. Government Recapitalization and Consolidation
Between FY2017 and FY2021, the Indian government infused over ₹3 lakh crore into PSU banks, strengthening their capital buffers. Additionally, bank mergers created stronger entities — for example:
Bank of Baroda absorbed Dena and Vijaya Bank,
Canara Bank merged with Syndicate Bank,
Union Bank merged with Andhra and Corporation Bank.
This consolidation reduced fragmentation, created scale, and enhanced competitiveness.
4. The PSU Bank Rally – What’s Driving It?
The PSU bank rally has been one of the most notable themes in the Indian stock market in recent years. After a decade of underperformance, these stocks have turned into multi-baggers, with several PSU banks delivering 200–500% returns in just 2–3 years.
Let’s decode the reasons behind this rally:
a. Massive Valuation Re-rating
For a long time, PSU banks traded at deep discounts to book value — often between 0.3x to 0.6x — reflecting investor pessimism. With the clean-up of balance sheets, profitability return, and stable management, the market started to re-rate these banks.
Currently, large PSU banks trade at 1.0–1.5x P/B, still lower than private peers (2.5x–4x), leaving room for further revaluation.
b. Return of Profitability
Post-2020, PSU banks started showing consistent quarterly profits, driven by lower provisioning costs and higher NII.
Example:
SBI’s FY2025 profits are expected to exceed ₹75,000 crore,
Canara Bank, BoB, and Union Bank are recording ROEs above 15%, levels not seen in over a decade.
These results changed investor sentiment from skepticism to confidence.
c. Credit Growth Momentum
PSU banks are witnessing robust credit growth of 12–14%, led by retail loans (housing, personal, auto), SME lending, and corporate capex revival. Their strong presence in rural and semi-urban areas gives them an edge in deposit mobilization, leading to stable funding costs.
d. Capital Adequacy & Improved Asset Quality
Thanks to recapitalization and internal profit generation, most PSU banks now have Capital Adequacy Ratios above 14%, giving them room to expand their balance sheets. Their Gross NPA ratios have fallen below 4%, compared to 10–12% in 2018.
e. FII and DII Interest
Foreign Institutional Investors (FIIs) and Domestic Institutional Investors (DIIs) have both turned net buyers of PSU banks. The segment is considered a proxy for India’s growth story — benefiting from both cyclical and structural drivers.
Moreover, PSU banks offer attractive dividend yields (3–5%) and stable earnings visibility, making them a favorite in the current interest rate environment.
5. Comparing PSU vs Private Banks
Parameter PSU Banks Private Banks
Valuation (P/B) 0.9–1.5x 2.5–4.0x
ROE/ROA Improving (12–15%) High (16–18%)
NIM 3–3.3% 3.5–4.5%
Asset Quality Improved, but slightly lower Very strong
Technology Adoption Rapidly catching up Already advanced
Growth Drivers Retail, Infra, SME, Rural Credit Premium Retail, Digital, Corporate
Investor Sentiment Recovering fast Already strong
The valuation gap between PSU and private banks has started narrowing, but PSUs still remain value plays, whereas private banks are seen as quality growth plays.
6. Banking Sector as Market Leader in 2025 Cycle
In the ongoing market cycle, banking is again showing signs of leadership emergence, driven by several factors:
a. Capex Revival
India’s private and public sector capex is gaining momentum — from roads and ports to data centers and manufacturing. Banks will play a financing role in this multi-trillion-rupee expansion phase.
b. Liquidity & Deposit Growth
Despite competition from small finance and fintech banks, traditional banks — especially PSUs — have maintained strong CASA (Current Account Savings Account) ratios, ensuring liquidity. This gives them pricing power in a tightening liquidity environment.
c. Credit Quality Cycle at Its Best
With low slippages and strong recoveries, India is in the best credit quality cycle in two decades. Credit costs (provisions as a % of assets) are at multi-year lows, directly boosting profitability.
d. Government Support & Reforms
The government continues to push for PSU bank modernization, privatization of smaller entities, and improvement in governance. The “bad bank” (NARCL) initiative has further helped clear legacy NPAs.
e. Rising Financialization of Savings
With rising income levels and formalization, more money is flowing into banking and financial systems — deposits, mutual funds, and loans — further deepening the sector’s dominance.
7. Technical & Market Structure Perspective
From a market structure angle, the Bank Nifty index is often the leading indicator for Nifty’s trend direction. Historically:
When Bank Nifty outperforms Nifty, it signals broad-based bullishness.
When PSU banks outperform private banks, it often indicates a mid-stage bull market, where value stocks catch up with growth stocks.
As of 2025, both Bank Nifty and Nifty PSU Bank Index are trading near record highs, showing strong volume support, healthy price structure, and institutional accumulation — confirming that leadership lies with the banking pack.
8. Risks & Challenges
Despite strong fundamentals, certain risks remain:
Interest Rate Volatility: A sharp rate hike cycle can squeeze margins.
Global Slowdown: If export demand or global growth falters, corporate loan demand may soften.
Competition from Fintechs: Fintechs may eat into certain profitable retail segments.
Policy Risks: Privatization delays or regulatory tightening can temporarily hurt PSU valuations.
However, these are manageable risks in the current macro setup, as most PSU and private banks maintain high provisioning buffers and stable management practices.
9. Outlook for 2025 and Beyond
The outlook for the banking sector remains constructive and bullish. Analysts expect:
Credit growth of 12–14% CAGR,
NIMs to remain steady,
ROEs to sustain above 14%,
Asset quality to remain stable.
PSU banks are expected to narrow the valuation gap with private banks as they continue to deliver consistent profits, higher dividends, and improved governance.
In the medium term (2025–2027), the PSU Bank Index could potentially outperform broader indices, supported by:
Credit growth in infrastructure, housing, and MSMEs,
Rising investor confidence,
India’s macroeconomic resilience.
10. Conclusion
The Banking sector’s leadership in the market is not accidental — it is rooted in economic cycles, financial system dominance, and investor psychology. Every major bull market in India’s history has been led, directly or indirectly, by banks.
The PSU Bank rally represents not just a price recovery but a structural turnaround story — from being crisis-hit entities plagued by NPAs and inefficiency to becoming profitable, tech-savvy, dividend-paying institutions aligned with India’s growth narrative.
As India’s GDP moves toward the $5 trillion mark, and capex, consumption, and credit cycles expand together, banks — both private and public — will remain the torchbearers of the next leg of India’s equity bull market.

Institutional Trading SecretsUnderstanding the Power Behind the Markets
Institutional trading refers to the buying and selling of securities by large financial organizations such as mutual funds, hedge funds, pension funds, insurance companies, and investment banks. These institutions handle large pools of capital and have the ability to influence market movements significantly. Unlike retail traders, institutions operate with complex algorithms, proprietary research, and vast resources. Understanding the secrets behind institutional trading provides insights into how professional money moves and how markets truly function beneath the surface.
1. The Foundation of Institutional Trading
Institutional trading is built on the principles of scale, strategy, and information. Institutions are responsible for managing billions of dollars in assets, meaning their trades can affect prices, liquidity, and volatility. Unlike individual traders, institutional players do not focus on small daily profits; they aim for consistent, risk-adjusted returns over the long term.
Their edge comes from three primary advantages:
Access to superior information and research
Advanced trading technology and algorithms
Ability to influence market microstructure
These institutions employ teams of analysts, quants, and traders who specialize in market data interpretation, economic forecasting, and risk management. Every trade is calculated with precision, often based on complex quantitative models rather than emotion or speculation.
2. The Role of Liquidity and Market Impact
One of the biggest secrets of institutional trading lies in liquidity management. Because institutions deal with massive order sizes, they cannot simply place all their trades at once. Doing so would cause the market to move against them — a phenomenon known as market impact.
To avoid this, institutions use execution algorithms that break large orders into smaller chunks. These algorithms might spread trades across different times of the day or execute them across multiple exchanges. Common strategies include:
VWAP (Volume-Weighted Average Price): Trades are executed based on the average trading volume to minimize deviation from the day’s average price.
TWAP (Time-Weighted Average Price): Orders are distributed evenly over a specific time period to reduce visibility.
Iceberg Orders: Only a small portion of the total order is visible in the order book, hiding the true size of the position.
This ability to manage liquidity allows institutions to build or exit massive positions quietly, without alerting other market participants.
3. The Power of Information and Data Analysis
Institutional traders rely on information asymmetry — having better data and faster insights than others. While retail traders might use chart patterns or news, institutions have access to:
Real-time data feeds from multiple exchanges
Proprietary research reports
Satellite data and alternative data sources (such as shipping volumes, credit card transactions, and social media sentiment)
High-frequency data on order flow and market depth
Using these datasets, institutions employ quantitative analysts (quants) to create predictive models. These models identify statistical relationships between variables, helping predict short-term price movements or long-term trends.
For example, a hedge fund may use machine learning models to detect patterns in market volatility before major announcements, or to identify correlations between commodities and currency pairs.
The key advantage lies not just in the quantity of data, but in the speed and accuracy of interpretation. Milliseconds can make the difference between profit and loss — hence, institutions invest heavily in low-latency systems and high-speed trading infrastructure.
4. Algorithmic and High-Frequency Trading (HFT)
A large portion of institutional trading today is algorithmic. These trades are executed by automated systems that use predefined rules and mathematical models. High-Frequency Trading (HFT), a subset of algorithmic trading, takes this to an extreme — executing thousands of trades per second to capture small inefficiencies.
HFT firms exploit microstructure inefficiencies, such as latency arbitrage or temporary mispricing between markets. They use co-location, placing their servers physically close to exchange servers to gain microsecond advantages.
Some common institutional algorithmic strategies include:
Statistical Arbitrage: Profiting from temporary pricing discrepancies between correlated assets.
Market Making: Providing liquidity by continuously quoting buy and sell prices, earning the spread.
Momentum Ignition: Detecting and amplifying short-term momentum in a stock to profit from price continuation.
Event-Driven Trading: Reacting instantly to earnings announcements, mergers, or macroeconomic data.
While these methods are controversial for their speed and complexity, they enhance overall market liquidity and efficiency — though often at the cost of retail traders who cannot compete with their speed.
5. Institutional Order Flow and “Smart Money” Movement
Another secret weapon of institutional trading is order flow analysis — tracking where the “smart money” is moving. Institutions often coordinate trades across different asset classes to hedge risk or exploit correlations. For example, when an institution buys a large amount of NIFTY futures, it may simultaneously hedge by shorting correlated global indices or purchasing options to manage volatility exposure.
This coordinated movement of funds creates institutional footprints, often visible in sudden spikes in volume, price momentum, or open interest. Professional traders and market analysts try to detect these footprints to “follow the smart money.”
For instance, if heavy institutional buying is detected in the banking sector, it may signal a longer-term bullish trend that retail traders can align with.
6. Dark Pools and Hidden Liquidity
One of the lesser-known aspects of institutional trading is the use of dark pools — private exchanges where large trades are executed anonymously.
Unlike public exchanges (like NSE or BSE), dark pools allow institutions to buy or sell significant quantities without revealing their intentions to the market. This protects them from adverse price movement caused by front-running or speculation.
Dark pools help maintain stability in the market by preventing sudden volatility. However, they also reduce transparency, which can disadvantage smaller market participants who cannot see these hidden orders.
7. Risk Management and Portfolio Hedging
Institutions never trade without a comprehensive risk management framework. Every position is assessed based on its potential drawdown, volatility, and correlation with other holdings.
They use Value-at-Risk (VaR) models, stress testing, and scenario analysis to simulate potential losses under various conditions. For example, a portfolio manager may test how their portfolio would perform if oil prices drop 20% or interest rates rise by 1%.
Institutions also employ hedging instruments such as:
Derivatives (futures, options, and swaps) to offset market exposure.
Currency hedges to protect international investments.
Interest rate swaps to manage bond portfolio risks.
By combining multiple hedging layers, institutions ensure consistent performance even in volatile markets.
8. Behavioral and Sentiment Analysis
Beyond numbers, institutional traders also study market psychology. They monitor sentiment indicators like the VIX (Volatility Index), Put-Call Ratios, and Institutional Investor Confidence Index to gauge crowd behavior.
Some advanced firms apply natural language processing (NLP) to scan news headlines, earnings transcripts, and even social media posts in real time. The goal is to quantify sentiment and anticipate how collective emotions might affect price movements.
This behavioral edge allows institutions to stay one step ahead — buying when fear dominates and selling when euphoria peaks.
9. The Role of Prime Brokers and Custodians
Institutions do not operate alone. They rely on prime brokers and custodians to execute, clear, and settle trades efficiently. Prime brokers offer leverage, research, and risk management tools. They also provide access to short-selling opportunities and synthetic products.
Custodians, on the other hand, ensure safekeeping of assets and manage compliance, reporting, and settlements. This interconnected network ensures that large volumes of capital can move globally without friction or error.
10. Institutional Trading in India
In the Indian market, institutional participation is dominated by Foreign Institutional Investors (FIIs) and Domestic Institutional Investors (DIIs) such as mutual funds, insurance companies, and pension funds.
Their trades have a massive influence on the direction of the NIFTY and SENSEX indices. For instance, sustained FII inflows usually push the market upward, while heavy outflows can trigger sharp corrections.
Indian institutions are also embracing algorithmic and quantitative strategies, aided by the rapid modernization of exchanges like the NSE, which support co-location and API-based trading. The growth of mutual funds and ETFs has further increased institutional control over market liquidity and price discovery.
11. How Retail Traders Can Learn from Institutions
While retail traders cannot match institutional power, they can learn from their principles:
Trade with a plan: Use a disciplined, data-driven strategy rather than emotion.
Focus on risk: Limit losses with proper stop-losses and portfolio diversification.
Follow liquidity: Trade in stocks or sectors where institutions are active — their presence adds predictability and stability.
Analyze institutional activity: Track FII/DII data, open interest changes, and large block trades to infer smart money direction.
Adopt technology: Use algorithmic tools, scanners, and analytics to level the playing field.
12. The Future of Institutional Trading
The future of institutional trading lies in AI-driven decision-making, blockchain integration, and decentralized finance (DeFi). Artificial intelligence is already helping institutions automate not just execution but also research and portfolio optimization.
With blockchain, trade settlements may become instantaneous, reducing counterparty risk. Meanwhile, DeFi could open institutional access to tokenized assets and decentralized liquidity pools.
As markets evolve, the line between institutional and retail trading will continue to blur — but institutions will remain the key players shaping market trends and innovations.
Conclusion
Institutional trading is the invisible hand guiding global markets. Behind every price movement lies a calculated series of actions from funds and institutions managing vast sums of money. Their “secrets” are not mystical — they stem from disciplined execution, superior data, advanced algorithms, and rigorous risk management.
For retail traders, understanding these mechanisms provides not only perspective but also opportunity. By studying how institutional money flows, aligning trades with their direction, and adopting their disciplined mindset, individuals can navigate markets more intelligently.
In essence, the greatest secret of institutional trading is consistency — a relentless pursuit of efficiency, precision, and control. Institutions may move billions, but their real strength lies in the strategy and science behind every move.