Institutional Trading SecretsUnderstanding the Power Behind the Markets
Institutional trading refers to the buying and selling of securities by large financial organizations such as mutual funds, hedge funds, pension funds, insurance companies, and investment banks. These institutions handle large pools of capital and have the ability to influence market movements significantly. Unlike retail traders, institutions operate with complex algorithms, proprietary research, and vast resources. Understanding the secrets behind institutional trading provides insights into how professional money moves and how markets truly function beneath the surface.
1. The Foundation of Institutional Trading
Institutional trading is built on the principles of scale, strategy, and information. Institutions are responsible for managing billions of dollars in assets, meaning their trades can affect prices, liquidity, and volatility. Unlike individual traders, institutional players do not focus on small daily profits; they aim for consistent, risk-adjusted returns over the long term.
Their edge comes from three primary advantages:
Access to superior information and research
Advanced trading technology and algorithms
Ability to influence market microstructure
These institutions employ teams of analysts, quants, and traders who specialize in market data interpretation, economic forecasting, and risk management. Every trade is calculated with precision, often based on complex quantitative models rather than emotion or speculation.
2. The Role of Liquidity and Market Impact
One of the biggest secrets of institutional trading lies in liquidity management. Because institutions deal with massive order sizes, they cannot simply place all their trades at once. Doing so would cause the market to move against them — a phenomenon known as market impact.
To avoid this, institutions use execution algorithms that break large orders into smaller chunks. These algorithms might spread trades across different times of the day or execute them across multiple exchanges. Common strategies include:
VWAP (Volume-Weighted Average Price): Trades are executed based on the average trading volume to minimize deviation from the day’s average price.
TWAP (Time-Weighted Average Price): Orders are distributed evenly over a specific time period to reduce visibility.
Iceberg Orders: Only a small portion of the total order is visible in the order book, hiding the true size of the position.
This ability to manage liquidity allows institutions to build or exit massive positions quietly, without alerting other market participants.
3. The Power of Information and Data Analysis
Institutional traders rely on information asymmetry — having better data and faster insights than others. While retail traders might use chart patterns or news, institutions have access to:
Real-time data feeds from multiple exchanges
Proprietary research reports
Satellite data and alternative data sources (such as shipping volumes, credit card transactions, and social media sentiment)
High-frequency data on order flow and market depth
Using these datasets, institutions employ quantitative analysts (quants) to create predictive models. These models identify statistical relationships between variables, helping predict short-term price movements or long-term trends.
For example, a hedge fund may use machine learning models to detect patterns in market volatility before major announcements, or to identify correlations between commodities and currency pairs.
The key advantage lies not just in the quantity of data, but in the speed and accuracy of interpretation. Milliseconds can make the difference between profit and loss — hence, institutions invest heavily in low-latency systems and high-speed trading infrastructure.
4. Algorithmic and High-Frequency Trading (HFT)
A large portion of institutional trading today is algorithmic. These trades are executed by automated systems that use predefined rules and mathematical models. High-Frequency Trading (HFT), a subset of algorithmic trading, takes this to an extreme — executing thousands of trades per second to capture small inefficiencies.
HFT firms exploit microstructure inefficiencies, such as latency arbitrage or temporary mispricing between markets. They use co-location, placing their servers physically close to exchange servers to gain microsecond advantages.
Some common institutional algorithmic strategies include:
Statistical Arbitrage: Profiting from temporary pricing discrepancies between correlated assets.
Market Making: Providing liquidity by continuously quoting buy and sell prices, earning the spread.
Momentum Ignition: Detecting and amplifying short-term momentum in a stock to profit from price continuation.
Event-Driven Trading: Reacting instantly to earnings announcements, mergers, or macroeconomic data.
While these methods are controversial for their speed and complexity, they enhance overall market liquidity and efficiency — though often at the cost of retail traders who cannot compete with their speed.
5. Institutional Order Flow and “Smart Money” Movement
Another secret weapon of institutional trading is order flow analysis — tracking where the “smart money” is moving. Institutions often coordinate trades across different asset classes to hedge risk or exploit correlations. For example, when an institution buys a large amount of NIFTY futures, it may simultaneously hedge by shorting correlated global indices or purchasing options to manage volatility exposure.
This coordinated movement of funds creates institutional footprints, often visible in sudden spikes in volume, price momentum, or open interest. Professional traders and market analysts try to detect these footprints to “follow the smart money.”
For instance, if heavy institutional buying is detected in the banking sector, it may signal a longer-term bullish trend that retail traders can align with.
6. Dark Pools and Hidden Liquidity
One of the lesser-known aspects of institutional trading is the use of dark pools — private exchanges where large trades are executed anonymously.
Unlike public exchanges (like NSE or BSE), dark pools allow institutions to buy or sell significant quantities without revealing their intentions to the market. This protects them from adverse price movement caused by front-running or speculation.
Dark pools help maintain stability in the market by preventing sudden volatility. However, they also reduce transparency, which can disadvantage smaller market participants who cannot see these hidden orders.
7. Risk Management and Portfolio Hedging
Institutions never trade without a comprehensive risk management framework. Every position is assessed based on its potential drawdown, volatility, and correlation with other holdings.
They use Value-at-Risk (VaR) models, stress testing, and scenario analysis to simulate potential losses under various conditions. For example, a portfolio manager may test how their portfolio would perform if oil prices drop 20% or interest rates rise by 1%.
Institutions also employ hedging instruments such as:
Derivatives (futures, options, and swaps) to offset market exposure.
Currency hedges to protect international investments.
Interest rate swaps to manage bond portfolio risks.
By combining multiple hedging layers, institutions ensure consistent performance even in volatile markets.
8. Behavioral and Sentiment Analysis
Beyond numbers, institutional traders also study market psychology. They monitor sentiment indicators like the VIX (Volatility Index), Put-Call Ratios, and Institutional Investor Confidence Index to gauge crowd behavior.
Some advanced firms apply natural language processing (NLP) to scan news headlines, earnings transcripts, and even social media posts in real time. The goal is to quantify sentiment and anticipate how collective emotions might affect price movements.
This behavioral edge allows institutions to stay one step ahead — buying when fear dominates and selling when euphoria peaks.
9. The Role of Prime Brokers and Custodians
Institutions do not operate alone. They rely on prime brokers and custodians to execute, clear, and settle trades efficiently. Prime brokers offer leverage, research, and risk management tools. They also provide access to short-selling opportunities and synthetic products.
Custodians, on the other hand, ensure safekeeping of assets and manage compliance, reporting, and settlements. This interconnected network ensures that large volumes of capital can move globally without friction or error.
10. Institutional Trading in India
In the Indian market, institutional participation is dominated by Foreign Institutional Investors (FIIs) and Domestic Institutional Investors (DIIs) such as mutual funds, insurance companies, and pension funds.
Their trades have a massive influence on the direction of the NIFTY and SENSEX indices. For instance, sustained FII inflows usually push the market upward, while heavy outflows can trigger sharp corrections.
Indian institutions are also embracing algorithmic and quantitative strategies, aided by the rapid modernization of exchanges like the NSE, which support co-location and API-based trading. The growth of mutual funds and ETFs has further increased institutional control over market liquidity and price discovery.
11. How Retail Traders Can Learn from Institutions
While retail traders cannot match institutional power, they can learn from their principles:
Trade with a plan: Use a disciplined, data-driven strategy rather than emotion.
Focus on risk: Limit losses with proper stop-losses and portfolio diversification.
Follow liquidity: Trade in stocks or sectors where institutions are active — their presence adds predictability and stability.
Analyze institutional activity: Track FII/DII data, open interest changes, and large block trades to infer smart money direction.
Adopt technology: Use algorithmic tools, scanners, and analytics to level the playing field.
12. The Future of Institutional Trading
The future of institutional trading lies in AI-driven decision-making, blockchain integration, and decentralized finance (DeFi). Artificial intelligence is already helping institutions automate not just execution but also research and portfolio optimization.
With blockchain, trade settlements may become instantaneous, reducing counterparty risk. Meanwhile, DeFi could open institutional access to tokenized assets and decentralized liquidity pools.
As markets evolve, the line between institutional and retail trading will continue to blur — but institutions will remain the key players shaping market trends and innovations.
Conclusion
Institutional trading is the invisible hand guiding global markets. Behind every price movement lies a calculated series of actions from funds and institutions managing vast sums of money. Their “secrets” are not mystical — they stem from disciplined execution, superior data, advanced algorithms, and rigorous risk management.
For retail traders, understanding these mechanisms provides not only perspective but also opportunity. By studying how institutional money flows, aligning trades with their direction, and adopting their disciplined mindset, individuals can navigate markets more intelligently.
In essence, the greatest secret of institutional trading is consistency — a relentless pursuit of efficiency, precision, and control. Institutions may move billions, but their real strength lies in the strategy and science behind every move.
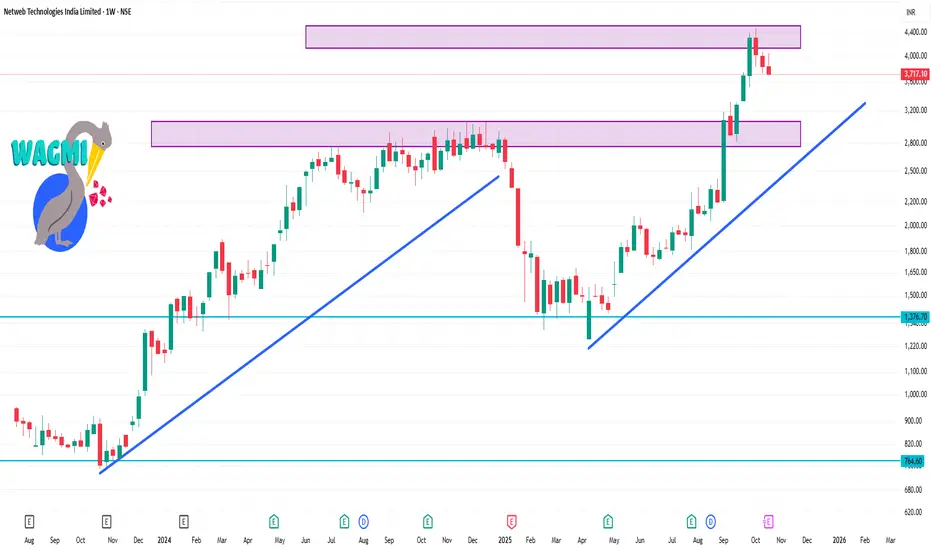
Trendlinebounce

High-Frequency Trading (HFT) in the Indian MarketIntroduction
High-Frequency Trading (HFT) represents one of the most advanced and technology-driven forms of trading in modern financial markets. It relies on powerful algorithms, lightning-fast computers, and low-latency connections to execute a large number of orders within microseconds. In India, HFT has gradually become an integral part of the trading ecosystem, especially after the introduction of sophisticated trading infrastructure by exchanges like the National Stock Exchange (NSE) and the Bombay Stock Exchange (BSE). Though often controversial, HFT contributes significantly to liquidity, efficiency, and price discovery in Indian capital markets.
Understanding High-Frequency Trading (HFT)
HFT is a subset of algorithmic trading where computers make decisions to buy or sell securities based on pre-programmed instructions. The key distinction lies in speed — trades are executed in microseconds, a fraction of the time it takes a human to blink.
HFT algorithms analyze multiple market conditions such as order book depth, price trends, and volatility to identify fleeting profit opportunities. These opportunities often exist for mere milliseconds, so the ability to react faster than competitors determines success.
The backbone of HFT includes:
Colocation services – where trading firms place their servers close to exchange data centers to minimize latency.
Ultra-low latency networks – to ensure rapid data transmission and order execution.
High-speed data feeds – providing real-time updates on prices and market depth.
Evolution of HFT in India
HFT made its first appearance in India in the late 2000s, when the NSE introduced colocation services in 2010. This allowed institutional traders and brokers to place their servers within exchange premises, significantly reducing order execution times.
By 2012, the share of HFT and algorithmic trades in total market volume had reached approximately 30–40%, primarily led by institutional investors and proprietary trading firms.
Over the years, the Indian market has witnessed:
Growth of technology infrastructure – The NSE and BSE adopted advanced trading systems and low-latency networks.
Entry of domestic and global algorithmic trading firms – Many firms specializing in market making and statistical arbitrage began operating in India.
Regulatory oversight – The Securities and Exchange Board of India (SEBI) introduced several guidelines to ensure fairness and transparency, including mandatory audits, approval processes, and controls against manipulative practices.
Today, estimates suggest that over 50% of trades in Indian equity and derivatives markets involve some form of algorithmic or high-frequency trading activity.
How HFT Works
HFT firms rely on a combination of mathematics, computer science, and finance. The typical HFT process involves several stages:
Market Data Collection
HFT systems continuously collect tick-by-tick data from multiple sources – stock exchanges, news feeds, and global markets.
Signal Generation
Algorithms process this data using statistical models and machine learning techniques to identify potential trading opportunities, such as arbitrage or momentum signals.
Order Execution
Once a signal is generated, orders are executed automatically. HFT systems use smart order routing to send orders to the exchange with the best available price and liquidity.
Risk Management
Real-time risk monitoring ensures that exposure limits are not breached and that orders conform to regulatory and internal compliance standards.
Post-Trade Analysis
After trades are completed, systems analyze performance metrics to refine future strategies.
The entire cycle – from data analysis to trade execution – can occur within microseconds.
Popular HFT Strategies in the Indian Market
HFT encompasses various strategies, each designed to exploit short-term inefficiencies:
Market Making
Market makers continuously quote buy and sell prices to provide liquidity. They profit from the bid-ask spread and help reduce market volatility. Many Indian brokers engage in HFT-based market making on NSE’s derivatives and currency segments.
Statistical Arbitrage
This involves identifying mispricings between correlated assets or instruments. For example, if two stocks historically move together but temporarily diverge, HFT algorithms can exploit the spread before it converges again.
Index Arbitrage
HFT systems arbitrage between an index and its constituent stocks. For instance, if the Nifty 50 futures deviate from its underlying basket’s fair value, algorithms execute trades to capture the difference.
Latency Arbitrage
This strategy leverages speed advantages to exploit price discrepancies that exist for milliseconds between exchanges or instruments.
Event-Based Trading
HFT systems respond instantly to news events, economic data releases, or corporate announcements by analyzing sentiment and trading accordingly.
Liquidity Detection (Sniffing)
Some algorithms attempt to detect large hidden orders (iceberg orders) placed by institutional investors and trade strategically around them.
Infrastructure Enabling HFT in India
The success of HFT heavily depends on the trading infrastructure. Indian exchanges have developed world-class facilities to support low-latency trading:
Colocation Services: NSE and BSE offer colocation racks where brokers can install their trading servers next to the exchange’s systems.
Dedicated Leased Lines and Microwave Networks: For ultra-fast data transfer, firms use optical fiber or microwave links that minimize latency.
Advanced Matching Engines: Exchange engines are optimized to match orders in microseconds.
Smart Order Routers: These ensure that trades are executed at the best available price across multiple exchanges.
Regulatory Framework by SEBI
The Securities and Exchange Board of India (SEBI) has been proactive in regulating HFT to ensure fair and transparent markets. Some key guidelines include:
Colocation Access Norms (2010)
Exchanges were directed to ensure equal access to colocation facilities without favoritism.
Algorithmic Trading Approval (2012)
Brokers using algos must get each strategy approved by the exchange.
Order-to-Trade Ratio Limits (2015)
To discourage excessive order cancellations, SEBI set limits on the ratio of orders placed to trades executed.
Randomization of Order Processing (2017)
To reduce latency advantage, exchanges were asked to randomize the order queue slightly.
Audit and Reporting Requirements
Regular algorithmic audits ensure compliance with market integrity and prevent manipulative practices like spoofing or layering.
Latency Equalization Plans (LEP)
SEBI and exchanges have discussed measures to equalize latency across participants, ensuring that small brokers and retail investors are not disadvantaged.
Advantages of HFT in the Indian Market
Enhanced Liquidity
HFT provides continuous buy and sell orders, reducing bid-ask spreads and ensuring smoother price discovery.
Efficient Price Discovery
By reacting instantly to new information, HFT ensures that prices reflect available data faster.
Reduced Transaction Costs
Higher liquidity translates into tighter spreads, benefiting all market participants.
Improved Market Depth
HFT firms add orders at multiple price levels, enhancing overall market depth and stability.
Technological Advancement
The presence of HFT has encouraged Indian exchanges and brokers to adopt cutting-edge technology and infrastructure.
Risks and Criticisms
Despite its advantages, HFT has drawn criticism due to concerns about fairness, stability, and manipulation.
Market Manipulation
Practices like “spoofing” (placing fake orders) or “quote stuffing” (flooding the market with orders to slow competitors) can distort prices.
Systemic Risk
A malfunctioning algorithm can trigger flash crashes. The 2012 Knight Capital incident in the U.S. and minor glitches in Indian markets highlight this risk.
Unequal Access
Large institutions with access to colocation enjoy a speed advantage over smaller brokers and retail traders, raising fairness concerns.
Reduced Investor Confidence
Rapid and unexplained price movements may discourage long-term investors.
Regulatory Complexity
Constant monitoring and evolving technology make regulation challenging for SEBI and exchanges.
Case Studies and Incidents
NSE Co-location Controversy (2015–2018)
Allegations emerged that certain brokers received unfair access to NSE’s trading systems via colocation, giving them a latency advantage. SEBI imposed fines on NSE and directed reforms to ensure transparency.
Flash Crashes and Volatility Events
On several occasions, Indian markets witnessed sudden sharp movements attributed to algorithmic errors. For instance, in October 2012, a rogue algorithm triggered a 15% intraday fall in Nifty, causing temporary panic before recovery.
These incidents emphasized the need for robust surveillance and fail-safes.
The Role of HFT in Derivatives and Currency Markets
HFT plays a particularly vital role in futures, options, and currency derivatives, where speed and liquidity are crucial.
In the Nifty futures segment, HFT accounts for nearly 40–50% of the trading volume.
In currency derivatives, HFT improves market depth and helps maintain efficient exchange rate discovery.
By arbitraging between futures, options, and cash markets, HFT participants ensure alignment in prices across instruments.
Impact on Retail and Institutional Investors
For retail investors, HFT’s influence is both positive and negative:
Positive: Better liquidity, tighter spreads, and faster execution.
Negative: Limited ability to compete on speed; occasional volatility spikes may trigger stop-losses.
Institutional investors, on the other hand, leverage algorithmic systems for better execution and reduced slippage, often partnering with HFT firms for liquidity provision.
Technological Trends Shaping the Future of HFT
The next decade of HFT in India will be shaped by:
Artificial Intelligence (AI) and Machine Learning – Algorithms capable of adaptive decision-making and predictive analytics.
Quantum Computing – Offering potentially exponential speed gains.
Blockchain and Distributed Ledger Technology – Could revolutionize trade settlements.
5G and Edge Computing – Further reducing latency for real-time data transmission.
Integration of Global Markets – Cross-border HFT strategies as regulatory harmonization improves.
Future Outlook of HFT in India
The future of HFT in India is promising yet requires balanced oversight.
SEBI’s regulatory vigilance ensures that technology-driven efficiency doesn’t come at the cost of fairness or stability. With the Digital India initiative, expanding broadband infrastructure, and growing fintech innovation, India is set to witness a new wave of algorithmic sophistication.
HFT will likely extend beyond equities into commodities, bonds, and crypto-like regulated digital assets once frameworks evolve. However, the emphasis must remain on equal access, ethical algorithm design, and investor protection.
Conclusion
High-Frequency Trading has transformed India’s financial landscape, introducing speed, precision, and efficiency at unprecedented levels. While it brings liquidity and innovation, it also introduces challenges of fairness, stability, and ethical conduct.
The Indian regulatory system, guided by SEBI and supported by exchanges like NSE and BSE, continues to evolve to strike the right balance between technological progress and market integrity.
In the years ahead, as technology continues to reshape trading, HFT will remain a defining force in India’s journey toward becoming a globally competitive, transparent, and technology-driven financial market.
Financial Future Plan: A Roadmap to Sustainable ProsperityIntroduction
In today’s dynamic and unpredictable world, financial planning is not merely a choice—it is a necessity. The global economy constantly evolves with technological innovation, inflationary pressures, changing job markets, and shifting investment opportunities. Against this backdrop, a financial future plan acts as a guiding framework to achieve financial stability, security, and long-term wealth creation. It provides clarity about one’s income, expenses, savings, investments, and risk management strategies. A well-crafted financial plan enables individuals and families to meet their short-term needs while securing their future aspirations such as education, retirement, home ownership, and legacy planning.
1. Understanding Financial Planning
Financial planning refers to the process of managing one’s finances to achieve life goals systematically. It involves assessing current financial conditions, identifying objectives, and developing strategies to meet those goals through savings, investments, insurance, and debt management.
A financial future plan is both proactive and adaptive. It not only addresses current needs but also anticipates future uncertainties like medical emergencies, job loss, or economic downturns. It provides a sense of control and peace of mind, ensuring that financial decisions are made with a long-term perspective rather than short-term impulses.
2. Importance of Financial Future Planning
The significance of planning for the financial future cannot be overstated. It provides multiple benefits, including:
Goal Achievement:
Financial planning transforms dreams into achievable goals—whether it’s buying a home, starting a business, or ensuring a comfortable retirement.
Budget Discipline:
It instills financial discipline by tracking income and expenses, helping avoid unnecessary spending and encouraging consistent saving.
Crisis Preparedness:
By building an emergency fund and obtaining insurance, a financial plan shields individuals from unexpected financial shocks.
Wealth Creation:
Strategic investments across asset classes like equities, bonds, and real estate ensure capital appreciation and income generation.
Tax Efficiency:
Proper planning helps minimize tax liability through legal avenues like deductions, exemptions, and investment-linked benefits.
Financial Independence:
Ultimately, a sound plan enables individuals to live life on their own terms without depending on others for financial support.
3. Core Components of a Financial Future Plan
A comprehensive financial plan integrates multiple elements that work together to build long-term financial health. These components include:
a) Goal Setting
Every financial journey begins with goal setting. Goals must be SMART — Specific, Measurable, Achievable, Relevant, and Time-bound. Examples include:
Saving ₹20 lakhs for a child’s education within 10 years
Buying a home worth ₹80 lakhs in 15 years
Accumulating ₹1 crore for retirement by age 60
Setting clear goals helps determine the investment amount, time horizon, and risk appetite.
b) Budget Management
Budgeting forms the foundation of financial control. It involves listing monthly income sources, categorizing expenses, and ensuring savings are prioritized. The 50-30-20 rule serves as a useful guideline — allocating 50% to needs, 30% to wants, and 20% to savings or debt repayment.
c) Emergency Fund
An emergency fund acts as a financial cushion against unforeseen circumstances such as job loss, hospitalization, or urgent repairs. Ideally, it should cover 6–12 months of essential expenses and be parked in a liquid, low-risk instrument such as a savings account or money market fund.
d) Debt Management
Debt, if unmanaged, can derail financial progress. A strong plan involves reducing high-interest loans first (like credit card dues or personal loans) and maintaining a healthy credit score. Strategic borrowing for productive assets such as education or housing can be beneficial when aligned with repayment capacity.
e) Insurance and Risk Protection
Insurance is a critical risk-mitigation tool. Life, health, and asset insurance ensure financial security in case of unforeseen events. Term life insurance provides income replacement for dependents, while health insurance covers escalating medical costs, which are often financially draining.
f) Investment Planning
Investment planning transforms savings into wealth. Diversification across asset classes—equities, mutual funds, bonds, real estate, gold, and alternative assets—balances risk and return. Asset allocation should match the investor’s goals, time horizon, and risk tolerance.
Short-term goals may use fixed deposits or short-duration funds.
Medium-term goals may favor balanced or hybrid mutual funds.
Long-term goals can leverage equity mutual funds or direct equity for higher returns.
g) Retirement Planning
Retirement planning ensures financial independence during non-earning years. Early planning leverages the power of compounding, allowing small, regular contributions to grow substantially. Instruments such as the National Pension System (NPS), Public Provident Fund (PPF), and Employee Provident Fund (EPF) serve as reliable long-term savings avenues.
h) Tax Planning
Tax optimization enhances returns by reducing liabilities. Investors can utilize deductions under Sections 80C, 80D, and 80G of the Indian Income Tax Act through investments in ELSS mutual funds, insurance premiums, and health coverage. Efficient tax planning aligns with overall financial goals without compromising liquidity.
i) Estate and Legacy Planning
This ensures a smooth transfer of wealth to the next generation. Drafting a will or creating a trust prevents legal disputes and preserves wealth continuity. It reflects responsible financial stewardship and secures the family’s future.
4. Steps to Create a Financial Future Plan
Crafting an effective financial plan involves a structured, step-by-step approach:
Step 1: Assess Your Current Financial Position
Analyze income, expenses, assets, and liabilities to understand your financial baseline. This assessment reveals strengths, weaknesses, and areas for improvement.
Step 2: Define Clear Objectives
List your short-term (1–3 years), medium-term (3–10 years), and long-term (10+ years) financial goals. Prioritize them based on urgency and importance.
Step 3: Evaluate Risk Appetite
Every investor’s risk tolerance differs based on age, income, and financial obligations. Younger investors can take higher equity exposure, while older individuals may prefer stable income instruments.
Step 4: Design an Investment Strategy
Create a diversified portfolio that aligns with your time horizon and goals. Review and rebalance periodically to adapt to market or personal changes.
Step 5: Build an Emergency Fund
Set aside a dedicated corpus for unexpected expenses before aggressively investing in growth assets.
Step 6: Protect with Insurance
Ensure adequate life and health coverage. For dependents, term insurance with a sum assured 10–15 times the annual income is advisable.
Step 7: Implement and Monitor
Execution is the bridge between planning and success. Regularly review your plan—annually or after significant life events—to ensure alignment with changing circumstances.
5. The Role of Technology in Financial Planning
Digital transformation has revolutionized personal finance management. Today, individuals can track expenses, analyze investments, and plan for goals using fintech platforms, robo-advisors, and mobile applications.
Robo-advisory platforms provide algorithm-driven portfolio suggestions based on individual risk profiles.
Investment apps enable systematic investing through SIPs (Systematic Investment Plans).
AI-driven analytics offer insights into spending patterns, credit behavior, and tax-saving opportunities.
Technology has made financial planning more accessible, transparent, and data-driven, even for beginners.
6. Challenges in Financial Future Planning
Despite its importance, many individuals face hurdles in developing a robust financial plan:
Lack of Awareness:
Many people underestimate the value of long-term planning, focusing instead on immediate needs.
Inflation and Lifestyle Creep:
Rising costs erode purchasing power, while lifestyle upgrades often outpace income growth.
Market Volatility:
Fluctuating markets can test investors’ patience and confidence, leading to impulsive decisions.
Over-Reliance on Debt:
Easy credit availability can create long-term liabilities, restricting future financial flexibility.
Inconsistent Saving Habits:
Irregular savings and lack of budgeting discipline delay wealth creation.
Addressing these challenges requires awareness, education, and a disciplined approach to money management.
7. Financial Future Planning Across Life Stages
Financial priorities evolve over time. Hence, the plan must adapt to life stages:
Early Career (20s–30s):
Focus on budgeting, building emergency funds, and starting early investments. Opt for aggressive asset allocation (higher equity exposure) to leverage compounding.
Mid-Life (30s–50s):
Balance growth and stability. Prioritize child education, home loans, and insurance coverage while maintaining consistent retirement contributions.
Pre-Retirement (50s–60s):
Shift towards capital preservation. Rebalance portfolios toward fixed income, annuities, and low-risk instruments.
Retirement and Beyond:
Emphasize steady income streams, healthcare coverage, and estate management. Avoid risky investments and focus on liquidity and stability.
8. The Psychological Aspect of Financial Planning
Money management is as much about mindset as mathematics. Emotional biases—such as overconfidence, fear of loss, or herd behavior—can distort rational decision-making. Successful financial planning requires emotional intelligence, patience, and goal-focused discipline. Adopting a long-term view helps investors ride through volatility and resist impulsive behavior.
9. Role of Financial Advisors
Professional financial advisors play a crucial role in designing, executing, and monitoring financial plans. They offer expertise in portfolio diversification, tax efficiency, and estate management. With regulatory oversight and fiduciary responsibility, advisors ensure that strategies align with clients’ best interests.
10. Conclusion
A financial future plan is the blueprint for achieving stability, growth, and independence in an uncertain world. It combines analytical rigor with practical wisdom—balancing today’s needs with tomorrow’s aspirations. Whether one earns modestly or abundantly, financial success ultimately depends on discipline, consistency, and informed decision-making.
By budgeting wisely, investing intelligently, and preparing for risks, individuals can secure not only their financial well-being but also the peace of mind that comes with control over their economic destiny. As the saying goes, “A goal without a plan is just a wish.” A financial plan transforms that wish into reality—building a secure, prosperous, and confident future.

Derivatives Hedge RisksIntroduction
In the intricate and volatile world of finance, risk management stands as a central pillar for investors, corporations, and financial institutions alike. Among the most sophisticated tools available for mitigating financial uncertainty are derivatives. These financial instruments derive their value from an underlying asset, such as stocks, bonds, commodities, currencies, or interest rates. Derivatives have evolved over the decades from simple forward agreements between merchants into a complex ecosystem of futures, options, swaps, and other innovative contracts. Their fundamental purpose remains the same — to hedge risks and ensure stability in uncertain market environments.
This essay explores how derivatives hedge risks, the various types of derivatives used for hedging, real-world applications, and the benefits and challenges of their use in modern financial systems.
1. Understanding Derivatives
A derivative is a financial contract whose value depends on, or is “derived” from, the value of an underlying asset or benchmark. The main types of underlying assets include:
Equities (Stocks)
Commodities (Oil, Gold, Wheat, etc.)
Interest rates
Foreign currencies
Market indices (Nifty, S&P 500, etc.)
The most common types of derivatives are forwards, futures, options, and swaps. Each type serves a unique purpose in risk management.
2. The Concept of Hedging
Hedging is a strategy designed to protect against potential losses from adverse price movements. It is akin to purchasing insurance. Just as an individual buys health or car insurance to reduce exposure to personal financial loss, investors or companies use derivatives to insure against financial risks.
For example, a farmer expecting to harvest wheat in three months worries that wheat prices might drop. By entering a futures contract to sell wheat at a predetermined price, the farmer locks in the selling price today, thus hedging against future price declines. Similarly, an airline company worried about rising jet fuel prices might use derivatives to lock in current fuel costs.
3. Types of Derivatives Used for Hedging
3.1 Forwards
A forward contract is a customized agreement between two parties to buy or sell an asset at a specified future date for a price agreed upon today.
Example: A coffee exporter expects to sell 1,000 kilograms of coffee beans in six months. To protect against a potential fall in coffee prices, the exporter enters into a forward contract with a buyer to sell the coffee at ₹250 per kg in six months.
Hedging Impact: Regardless of future price fluctuations, the exporter knows exactly how much revenue will be received, eliminating uncertainty.
However, forwards carry a counterparty risk, as there is no centralized exchange to guarantee contract fulfillment.
3.2 Futures
Futures contracts are standardized versions of forward contracts, traded on regulated exchanges like the NSE or BSE in India. They obligate the buyer and seller to transact the underlying asset at a fixed price and date.
Example: A gold jewelry manufacturer expects to buy 10 kg of gold in two months. To hedge against potential price increases, the manufacturer buys gold futures today at ₹60,000 per 10 grams. If gold prices rise to ₹65,000, the manufacturer benefits because the futures contract offsets the increased cost.
Key Advantage: Futures contracts eliminate counterparty risk through exchange clearing houses, which act as intermediaries guaranteeing the trade.
3.3 Options
An option provides the right, but not the obligation, to buy or sell an asset at a predetermined price (called the strike price) before or at expiration.
Call Option: Gives the right to buy the underlying asset.
Put Option: Gives the right to sell the underlying asset.
Example (Put Option for Hedging):
A stock investor holding shares of Infosys worries that its price might fall. The investor buys a put option with a strike price of ₹1,500. If Infosys drops to ₹1,300, the investor can sell at ₹1,500, limiting losses.
Example (Call Option for Hedging):
An importer expecting to pay in U.S. dollars in three months can buy a call option on USD/INR. If the dollar strengthens, the importer exercises the option and locks in a favorable exchange rate.
Options are highly flexible tools and are widely used for both portfolio protection and speculative strategies.
3.4 Swaps
Swaps are contracts between two parties to exchange cash flows or other financial instruments. The most common forms are interest rate swaps and currency swaps.
Interest Rate Swap Example:
A company with a variable-rate loan fears rising interest rates. It enters an interest rate swap to convert its floating payments into fixed payments, thus stabilizing its interest expenses.
Currency Swap Example:
An Indian firm borrowing in U.S. dollars but earning revenue in rupees may enter into a currency swap with a U.S. firm that needs rupees, effectively exchanging currency obligations and reducing exchange rate exposure.
Swaps are primarily used by corporations and financial institutions to manage interest rate and currency risks.
4. How Derivatives Hedge Specific Types of Risk
4.1 Price Risk
Price risk refers to the uncertainty of future market prices for commodities, securities, or other assets.
Hedging with Futures: Farmers, manufacturers, and commodity traders lock in prices to protect against unfavorable movements.
Example: Oil producers sell crude oil futures to hedge against a potential decline in oil prices.
4.2 Currency Risk
Currency or foreign exchange risk arises when transactions or investments involve multiple currencies.
Hedging with Forwards or Options: Exporters and importers use currency forwards or options to fix exchange rates.
Example: An Indian IT firm expecting dollar revenue may hedge by selling USD-INR forwards to avoid losses from a depreciating dollar.
4.3 Interest Rate Risk
Interest rate fluctuations can impact loan costs, bond prices, and investment returns.
Hedging with Swaps or Futures: Companies convert floating-rate debt to fixed-rate using swaps or use interest rate futures to stabilize borrowing costs.
Example: A bank holding fixed-rate loans but funding them with variable-rate deposits can use an interest rate swap to balance its risk exposure.
4.4 Credit Risk
Credit derivatives, such as credit default swaps (CDS), hedge against the risk of borrower default.
Example: A bank holding corporate bonds buys a CDS to receive compensation if the issuer defaults, thus transferring credit risk to another party.
4.5 Portfolio Risk
Investors use index options and futures to hedge entire portfolios.
Example: A mutual fund anticipating short-term market volatility sells Nifty futures to protect its holdings from a potential downturn. When prices fall, profits from the futures offset losses in the portfolio.
5. Real-World Applications of Derivative Hedging
1. Corporate Sector
Airlines: Hedge against fuel price volatility using oil futures.
Exporters: Protect against foreign exchange fluctuations using currency forwards.
Manufacturers: Lock input costs with commodity futures to stabilize production costs.
2. Banking and Financial Institutions
Banks and mutual funds use derivatives to manage interest rate, credit, and market risks. Derivatives allow them to protect profit margins and maintain asset-liability stability.
3. Investors and Portfolio Managers
Investors use derivatives to hedge positions or reduce volatility. For instance, a fund manager may use put options on indices to safeguard portfolios during uncertain markets.
6. Advantages of Using Derivatives for Hedging
Risk Reduction:
Derivatives minimize exposure to adverse market movements, providing financial stability.
Cost Efficiency:
Derivative contracts often require less capital compared to holding physical assets.
Flexibility:
Options and swaps can be customized to specific risk needs, offering tailored protection.
Liquidity:
Major derivatives markets (like NSE, CME, or LME) offer high liquidity, making entry and exit easy.
Global Integration:
Derivatives enable international firms to manage risks across multiple markets and currencies seamlessly.
7. Risks and Challenges in Using Derivatives
While derivatives serve as powerful hedging instruments, they come with their own set of risks:
Leverage Risk:
Small price changes in the underlying asset can lead to large losses because derivatives often involve high leverage.
Counterparty Risk:
In over-the-counter (OTC) derivatives like forwards or swaps, one party may default on obligations.
Complexity:
Some derivatives are highly complex, requiring advanced understanding and monitoring. Misuse can lead to significant losses.
Speculative Misuse:
Although derivatives are designed for hedging, they can be used for speculation, amplifying market volatility.
Regulatory and Legal Risks:
Changes in regulations or lack of oversight may affect contract enforceability and transparency.
8. Case Studies of Derivative Hedging
1. Southwest Airlines (U.S.)
Southwest famously hedged against rising oil prices by using long-term crude oil futures. When oil prices surged in the 2000s, Southwest’s fuel costs remained low, giving it a major competitive edge.
2. Infosys Technologies (India)
Infosys, a major exporter of software services, uses currency derivatives to hedge against rupee appreciation. By locking in exchange rates, Infosys protects its dollar revenues from currency volatility.
3. Tata Steel
Tata Steel uses commodity derivatives to hedge against fluctuations in iron ore and coal prices, stabilizing input costs and ensuring consistent profitability.
9. The Indian Derivatives Market
India’s derivatives market has expanded rapidly since the early 2000s, driven by the National Stock Exchange (NSE) and the Bombay Stock Exchange (BSE).
The NSE introduced index futures in 2000, followed by index options and stock derivatives.
Commodity derivatives are traded through exchanges such as the Multi Commodity Exchange (MCX).
Currency and interest rate derivatives have enabled corporations and investors to hedge efficiently in a globally connected economy.
Regulatory oversight by SEBI ensures transparency, standardization, and risk management practices in derivative trading.
10. The Future of Derivative Hedging
The future of derivatives lies in technological innovation, blockchain-based smart contracts, and AI-driven risk management. With globalization, financial products are increasingly interconnected, and derivatives will continue to evolve as essential instruments for financial stability.
Emerging areas include:
Environmental Derivatives: For hedging carbon credits and climate risks.
Crypto Derivatives: Managing risks in digital asset markets.
AI-Enhanced Hedging Models: Predictive analytics improving hedge accuracy.
Conclusion
Derivatives are indispensable tools in modern finance for hedging and managing risks. They empower corporations, investors, and governments to stabilize cash flows, lock in prices, and protect portfolios from adverse market movements. Whether it’s a farmer securing crop prices, a multinational corporation mitigating currency fluctuations, or an investor guarding against market downturns, derivatives act as the financial world’s safety net.
However, their power must be wielded with caution. When used responsibly, derivatives strengthen financial resilience and promote global economic stability. When misused, they can amplify systemic risks, as seen during past financial crises.
In essence, derivatives are not inherently risky — it is how they are managed that determines their impact. When effectively structured and properly regulated, derivatives remain one of the most potent instruments for hedging risks and ensuring long-term financial security in an unpredictable world.

Sector Rotation Strategies in IndiaIntroduction
In the dynamic landscape of financial markets, investors constantly seek methods to outperform benchmarks and manage risks effectively. One such approach is sector rotation—a strategy that capitalizes on the natural ebb and flow of different sectors within the economy. In the Indian context, where cyclical and structural shifts frequently influence market behavior, sector rotation strategies have gained immense significance. By identifying which sectors are poised for growth and reallocating capital accordingly, investors can ride the momentum of economic cycles and maximize returns.
Sector rotation strategies are not new, but their relevance in India has grown in recent years due to rapid economic transformation, evolving government policies, and increased participation by institutional and retail investors. Understanding how to implement this strategy effectively can help both short-term traders and long-term investors optimize their portfolios.
What Is Sector Rotation?
Sector rotation refers to the practice of shifting investments from one industry sector to another based on the anticipated performance of sectors during different phases of the economic or market cycle. The core belief behind this strategy is that different sectors perform better at different times depending on economic conditions, interest rates, inflation, and government policy.
For example:
During an economic expansion, sectors like banking, infrastructure, capital goods, and consumer discretionary often outperform.
In a slowdown or recession, defensive sectors such as healthcare, FMCG (fast-moving consumer goods), and utilities tend to provide stability.
The idea is to rotate capital ahead of market trends—buying into sectors expected to outperform and exiting those likely to lag.
Economic Cycle and Sector Performance
To apply sector rotation effectively, one must understand the economic cycle, which typically consists of four stages:
Early Recovery / Expansion Phase:
The economy emerges from a slowdown.
Interest rates are low, liquidity is abundant, and corporate earnings begin to recover.
Sectors that tend to perform well: Banking, Auto, Infrastructure, Capital Goods, Metals.
Mid-Cycle (Growth Phase):
Economic activity strengthens, credit growth improves, and employment rises.
Consumer demand is high, and profits grow across industries.
Leading sectors: Technology, Consumer Discretionary, Financials.
Late-Cycle (Peak Phase):
Inflationary pressures increase, central banks may hike interest rates.
Input costs rise, margins narrow, and economic growth plateaus.
Beneficiaries: Energy, Commodities, Real Estate (short-term), while defensive sectors start gaining interest.
Recession / Slowdown Phase:
Demand slows down, earnings decline, and risk appetite decreases.
Safe-haven sectors outperform: FMCG, Healthcare, Utilities, Telecom.
Understanding these cycles and aligning sector exposure accordingly can significantly enhance portfolio returns.
Sector Rotation in the Indian Context
India’s economy is highly diverse and cyclical, influenced by factors such as monsoons, global demand, fiscal policy, and political stability. This makes it fertile ground for sector rotation strategies.
Over the past decade, India’s markets have demonstrated how different sectors come into prominence at different times:
2014–2017: A strong bull run in banking, infrastructure, and auto sectors, driven by reforms and policy push.
2018–2019: IT and FMCG sectors led due to global uncertainty and domestic consumption stability.
2020 (Pandemic): Pharmaceuticals and IT outperformed amid lockdowns.
2021–2023: A rebound in capital goods, energy, and PSU stocks, aligned with the government’s infrastructure focus.
2024–2025: Defence, renewable energy, and railways emerged as key performers.
Such patterns reflect how rotating between sectors based on macro trends can capture performance waves across cycles.
Key Drivers of Sector Rotation in India
Macroeconomic Indicators:
GDP growth, inflation, interest rates, and fiscal policies shape sector outlooks.
Example: Falling interest rates typically favor banks and real estate, while rising inflation benefits commodities and energy.
Government Policies and Budget Allocations:
The Union Budget can drastically shift sectoral fortunes.
For example, higher capital expenditure boosts infrastructure and cement, while healthcare allocations support pharma stocks.
Global Trends and Commodity Prices:
India’s dependence on global trade means commodity cycles affect sectors like metals, oil & gas, and IT (via currency movements).
Corporate Earnings Cycles:
Investors rotate toward sectors with improving earnings momentum.
Quarterly earnings season often triggers sectoral moves in Indian markets.
Technological Disruption and Innovation:
Rapid digital adoption has pushed investors toward IT, fintech, and e-commerce sectors, reflecting a long-term structural shift.
Approaches to Implement Sector Rotation
There are several ways investors can execute sector rotation strategies in India, depending on their investment horizon, risk appetite, and analytical tools.
1. Top-Down Approach
This involves analyzing the macroeconomic environment first, identifying the economic phase, and then selecting sectors likely to perform well.
Example: If the Reserve Bank of India (RBI) cuts interest rates, sectors like housing finance, auto, and banks are likely to benefit.
Tools: GDP data, inflation reports, RBI monetary policy statements.
2. Quantitative Models
Some investors use quantitative indicators such as:
Relative Strength Index (RSI) to gauge sector momentum.
Moving Averages (MA) for sector trend identification.
Sector Rotation Index (SRI) or ratio charts comparing sector indices (e.g., NIFTY IT vs. NIFTY Bank).
These methods help traders identify which sectors are gaining strength relative to the broader market.
3. Earnings Momentum and Valuation Shifts
Investors track sectors showing strong earnings upgrades and favorable valuation multiples.
For instance, analysts might rotate from overvalued IT stocks to undervalued manufacturing or PSU companies showing improving profits.
4. ETF and Mutual Fund Rotation
Investors can also rotate exposure via sectoral ETFs or mutual funds, such as:
Nippon India Pharma Fund
ICICI Prudential Infrastructure Fund
UTI Transportation and Logistics Fund
These allow diversified exposure within a targeted sector without picking individual stocks.
Practical Example of Sector Rotation in India
Let’s consider a simplified rotation from 2020 to 2025:
2020 (Pandemic Phase):
Pharma, IT, and FMCG surged due to health concerns and work-from-home trends.
2021–2022 (Recovery Phase):
Infrastructure, auto, and banking gained momentum as the economy reopened and credit demand rose.
2023 (Rising Capex and Defence Spending):
Sectors like capital goods, defence, and PSU stocks led the rally.
2024–2025 (Green Transition and Energy Shift):
Renewable energy, EVs, and power sector stocks dominated as the government pushed for sustainability and net-zero goals.
An investor following this sequence could have achieved strong portfolio performance by rotating across these themes.
Advantages of Sector Rotation
Enhanced Returns:
Capturing sectoral upswings often results in outperformance compared to passive investing.
Diversification with Focus:
While rotating sectors, investors maintain diversification but concentrate capital on high-probability opportunities.
Risk Management:
Moving away from underperforming sectors helps mitigate downside risk.
Tactical Flexibility:
Allows investors to adapt quickly to changing economic conditions or policy changes.
Alignment with Economic Reality:
This strategy mirrors real economic developments, making investment decisions more grounded in fundamentals.
Risks and Challenges
Despite its benefits, sector rotation comes with certain risks:
Timing Risk:
Identifying the correct phase of the economic cycle is challenging, and mistimed rotations can lead to underperformance.
Overtrading:
Frequent switching can increase transaction costs and reduce net returns.
False Signals:
Short-term market noise or speculative rallies may mislead investors.
Policy Uncertainty:
Sudden regulatory changes or geopolitical shocks can reverse sector trends.
Limited Data for Emerging Sectors:
Newer industries like electric vehicles or renewable energy may lack long-term performance history, complicating analysis.
Tools and Indicators for Sector Rotation
To successfully apply this strategy in Indian markets, investors often rely on:
NSE Sectoral Indices: (e.g., NIFTY Bank, NIFTY IT, NIFTY FMCG, NIFTY Infra).
Sectoral Ratio Charts: Comparing each sector index against the NIFTY 50 to spot outperformers.
Economic Indicators: RBI policy updates, inflation data, IIP (Index of Industrial Production), and fiscal budgets.
Technical Indicators: MACD crossovers, relative momentum charts, and sector breadth analysis.
Advanced investors may also use AI-based predictive models or factor-based analytics to anticipate rotation opportunities.
Sector Rotation and Institutional Activity
In India, foreign institutional investors (FIIs) and domestic institutional investors (DIIs) play a crucial role in sector rotation. Their capital inflows often dictate sectoral leadership:
When FIIs buy heavily into India, sectors like banks and IT usually lead due to global exposure.
During risk aversion phases, FIIs move to defensives like FMCG and healthcare.
Tracking institutional flow data (available on NSE or AMFI) provides valuable clues for rotation strategies.
Long-Term Structural Rotations in India
Beyond cyclical rotations, India is also witnessing structural sector shifts:
Digital Transformation: Boosting IT services, fintech, and digital platforms.
Manufacturing and Defence: Driven by “Make in India” and self-reliance initiatives.
Renewable Energy & EVs: Supported by green transition policies.
Consumer Upgradation: Growing middle-class demand benefiting retail, luxury goods, and financial services.
Investors combining cyclical and structural perspectives can enjoy both short-term alpha and long-term wealth creation.
Conclusion
Sector rotation strategies in India represent a powerful yet disciplined approach to navigating the complexities of the stock market. By understanding economic cycles, policy dynamics, and sectoral interrelationships, investors can tactically position themselves in outperforming industries while minimizing exposure to laggards.
While this approach demands active monitoring, analytical rigor, and timing precision, it offers immense potential in a fast-evolving economy like India’s. Whether through direct stock selection or via sectoral funds and ETFs, a well-executed sector rotation strategy can enhance portfolio performance, protect capital in downturns, and align investments with the pulse of India’s economic transformation.

Rise of Retail Traders and the New Financial FrontierIntroduction
The global financial markets have undergone a seismic shift over the past two decades. Once dominated by institutional investors, hedge funds, and professional traders, the financial landscape is now witnessing an unprecedented rise of retail traders — individual investors who manage their own capital, trade through digital platforms, and actively participate in shaping market trends. This transformation represents a new financial frontier, driven by technology, information accessibility, and the democratization of investing tools.
The rise of retail traders is more than just a market phenomenon — it symbolizes the empowerment of individuals in a once-elitist financial ecosystem. From commission-free trading apps to social media-fueled investment movements, retail traders are redefining market behavior, liquidity dynamics, and even corporate governance.
The Evolution of Retail Trading
1. The Pre-Digital Era: Limited Access
Before the 2000s, retail participation in financial markets was minimal. Investors relied on brokers, who charged high commissions, offered limited transparency, and acted as gatekeepers to exchanges. Financial data and research were expensive and often reserved for institutional players. The typical individual investor engaged in long-term investing through mutual funds or retirement accounts, not active trading.
2. The Internet Revolution
The late 1990s and early 2000s marked a turning point. The internet began democratizing access to financial information. Online brokers like E*TRADE, Charles Schwab, and Ameritrade introduced electronic trading platforms, reducing commission costs and enabling individuals to buy and sell securities directly. This era laid the foundation for retail trading’s evolution, but participation was still moderate compared to today.
3. The 2010s: The Age of Mobile and Zero-Commission Trading
The true explosion came in the 2010s with the advent of smartphones and mobile trading apps. Platforms like Robinhood, Zerodha, eToro, and Upstox eliminated trading commissions and made investing as easy as sending a text message. These apps, combined with fractional share investing and real-time analytics, opened the markets to millions of young investors globally.
In India, for example, Zerodha’s Kite platform revolutionized retail participation by providing an intuitive interface and near-zero brokerage costs. Similarly, Robinhood’s entry in the U.S. made trading accessible to anyone with a smartphone, catalyzing a cultural shift toward do-it-yourself investing.
Factors Driving the Rise of Retail Traders
1. Technological Advancements
Technology has made market participation frictionless. Mobile apps, algorithmic tools, and cloud computing have provided traders with instant access to global markets. Automation and AI-driven analytics offer retail traders insights once exclusive to professional analysts.
2. Social Media and Information Flow
Social media has emerged as a key driver of retail investing culture. Platforms like Reddit (WallStreetBets), Twitter (X), and YouTube have transformed how traders share insights, strategies, and news. Information that once took days to circulate now spreads in seconds. This has given rise to collective trading movements, where thousands of small investors act in coordination — as seen during the GameStop and AMC short squeezes of 2021.
3. Pandemic and the Work-From-Home Era
The COVID-19 pandemic accelerated the retail trading boom. With more time at home, extra savings, and stimulus checks in many economies, individuals turned to the markets for opportunity. Global brokerage account openings surged dramatically in 2020–2021. This era also marked the convergence of entertainment and investing — trading became not just a financial activity, but a social experience.
4. Financial Education and Online Communities
YouTube channels, podcasts, and online courses have democratized financial education. Retail traders can now learn technical analysis, risk management, and macroeconomics for free. Communities built around transparency and shared learning have fostered a culture of financial independence.
5. Low-Interest-Rate Environment
For nearly a decade following the 2008 financial crisis, interest rates remained historically low. Traditional savings and fixed-income instruments offered negligible returns, pushing individuals toward riskier assets like stocks, options, and cryptocurrencies.
The Tools Empowering Retail Traders
1. Commission-Free Trading Platforms
Platforms like Robinhood, Zerodha, Webull, and Fidelity have eliminated commissions, making frequent trading economically feasible. Fractional share ownership has further reduced entry barriers, allowing investors to own portions of high-value stocks like Tesla or Amazon.
2. Advanced Charting and Analytics
Retail traders today use sophisticated tools such as TradingView, MetaTrader, and Thinkorswim for technical analysis, algorithmic alerts, and backtesting strategies. These tools level the analytical playing field with institutional traders.
3. Artificial Intelligence and Automation
AI-driven bots and robo-advisors assist retail investors in portfolio management, market prediction, and execution speed. Platforms are integrating machine learning to help identify trends and reduce emotional biases in trading.
4. Access to Global Assets
With global brokerage accounts, retail traders can now trade across markets — from U.S. equities and forex to commodities, ETFs, and cryptocurrencies. This interconnected access has globalized retail participation.
The Cultural Shift: Investing as a Movement
1. The “Meme Stock” Phenomenon
The meme stock revolution epitomized the power of collective retail action. In early 2021, retail traders on Reddit’s WallStreetBets coordinated massive buying of heavily shorted stocks like GameStop (GME) and AMC Entertainment, forcing institutional short sellers to cover positions at significant losses. This event exposed the vulnerability of hedge funds and highlighted the democratizing power of social networks in finance.
2. Crypto Trading and the Decentralized Frontier
Cryptocurrencies introduced retail investors to an entirely new asset class. Platforms like Coinbase, Binance, and WazirX made crypto accessible to the masses. Blockchain technology promised decentralization — removing traditional intermediaries and giving individuals direct control over their assets. Retail traders became early adopters and evangelists of this decentralized financial (DeFi) ecosystem.
3. Financial Independence and the “Retail Revolution” Mindset
Retail trading is increasingly viewed as a path to financial independence. Movements like FIRE (Financial Independence, Retire Early) and “side hustle investing” reflect a generational desire for autonomy over income and wealth creation. Millennials and Gen Z investors are less trustful of traditional financial institutions, choosing instead to manage their own portfolios.
Impact on Financial Markets
1. Increased Market Liquidity
Retail trading has significantly improved liquidity in several asset classes. The influx of small trades adds depth to the market, making price discovery more efficient. However, it can also amplify volatility, especially in small-cap or speculative stocks.
2. Volatility and Herd Behavior
Retail investors, influenced by social sentiment, can create sharp price swings. Coordinated buying and selling have led to short squeezes and flash rallies, challenging traditional valuation models. This new dynamic forces institutional traders to adapt to unpredictable retail-driven trends.
3. Institutional Response
Financial institutions are now closely monitoring retail flows using sentiment analytics and social media data. Many funds have begun mimicking retail momentum or creating exchange-traded funds (ETFs) that track retail-favored stocks. Brokerages have also revamped their platforms to appeal to the new generation of traders.
4. Regulatory Scrutiny
The rise of retail trading has prompted regulators to reassess market structures. Issues such as payment for order flow, market manipulation, and gamification of trading have come under scrutiny. Regulators like the U.S. SEC and India’s SEBI are developing new frameworks to ensure transparency and investor protection.
Challenges Faced by Retail Traders
Despite their growing influence, retail traders face several obstacles:
Information Overload: The vast availability of unverified market data and social media speculation can lead to poor decision-making.
Emotional Trading: Without disciplined risk management, retail traders are prone to fear and greed cycles.
Short-Term Focus: Many traders prioritize quick profits over long-term wealth building, exposing themselves to unnecessary risk.
Lack of Institutional Resources: Institutions still possess superior access to data analytics, liquidity networks, and capital efficiency.
Regulatory Barriers: Certain financial instruments, like complex derivatives, remain restricted or difficult for retail investors to access.
The Future: A New Financial Frontier
The next decade promises to further blur the line between retail and institutional finance. Several trends are shaping this new frontier:
1. Tokenization of Assets
Blockchain will enable fractional ownership of real-world assets — from real estate and art to corporate equity. Retail investors will gain access to asset classes that were once exclusive to the ultra-wealthy.
2. Artificial Intelligence in Personal Finance
AI-driven personal trading assistants will help optimize portfolios, manage risk, and even execute trades autonomously. This will reduce human error and improve efficiency for retail participants.
3. Decentralized Finance (DeFi) and Smart Contracts
DeFi platforms are redefining how people lend, borrow, and earn yields without intermediaries. Retail traders will play a central role in this decentralized system, effectively participating in what some call “Finance 3.0.”
4. Hybrid Investor Models
We will see the emergence of hybrid investors — retail participants who use institutional-level tools, quantitative models, and AI integration. The difference between an individual and a hedge fund trader will continue to shrink.
5. Global Retail Connectivity
Cross-border platforms will unify retail investors worldwide, enabling 24/7 access to diversified global assets. A retail trader in India could easily trade U.S. equities, European ETFs, or digital commodities with minimal friction.
Conclusion
The rise of retail traders signifies more than just a market transformation — it’s a societal and technological revolution. It embodies the shift from financial centralization to democratization, from gatekeeping to empowerment. Retail traders are not merely participants; they are market makers of the modern age, reshaping narratives and challenging institutional dominance.
As technology advances and financial literacy expands, this new financial frontier will continue to evolve. The balance of power is no longer confined to Wall Street or Dalal Street — it lies within the smartphones and strategies of millions of global retail traders who dare to redefine the future of finance.
The rise of retail trading thus marks the beginning of an era where finance becomes inclusive, transparent, and participatory — a world where anyone, regardless of background or capital, can influence markets and create wealth in the digital age.

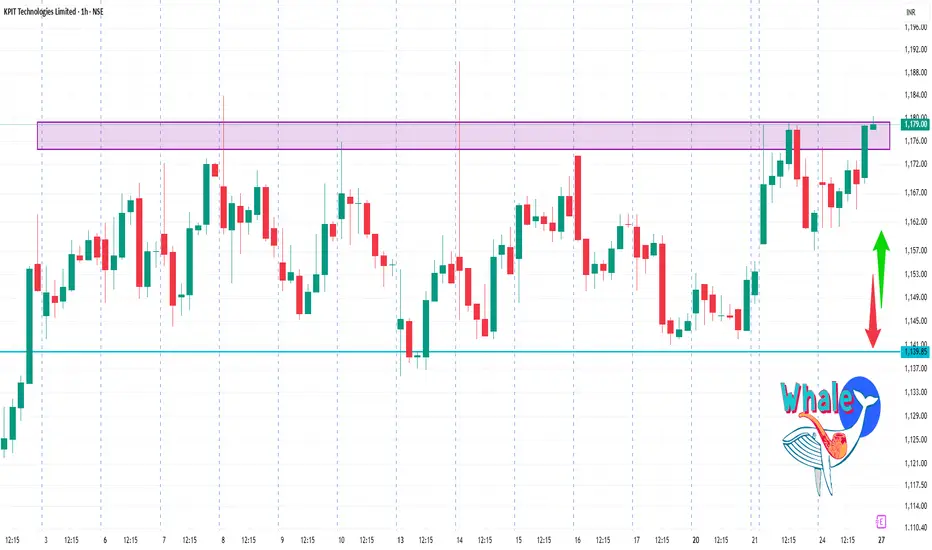
KPITTECH 1 Hour Time Frame 📈 Current Price Overview
Latest Price: ₹1,178.70
Day’s Range: ₹1,161.00 – ₹1,180.40
50-Day Moving Average (DMA): ₹1,206.21
200-Day Moving Average (DMA): Data not specified
Swing Trading and Positional Trading1. Understanding Swing Trading
1.1 Definition
Swing trading is a short-to-medium-term trading strategy where traders aim to capitalize on price swings or fluctuations within a trend. Unlike day trading, which involves buying and selling securities within the same day, swing trading typically involves holding positions for several days to weeks. The main goal is to capture a portion of a market move, whether upward or downward.
1.2 Objectives
The primary objective of swing trading is to identify short-term opportunities in the market and profit from them without getting caught in long-term market fluctuations. Swing traders often rely on technical analysis, chart patterns, and market indicators to make decisions.
1.3 Key Strategies in Swing Trading
Swing trading involves several techniques to identify profitable opportunities:
Trend Trading: Riding the momentum of an existing trend. Traders look for strong upward or downward trends and enter trades in the direction of the trend.
Breakout Trading: Identifying key levels of support or resistance and entering trades when the price breaks through these levels.
Reversal Trading: Spotting potential trend reversals using candlestick patterns, indicators like RSI (Relative Strength Index), or MACD (Moving Average Convergence Divergence).
Momentum Trading: Trading based on momentum indicators and volume spikes that suggest a strong directional move.
1.4 Tools and Indicators
Swing traders often use a combination of technical tools and indicators to identify trade setups:
Moving Averages: To detect trends and potential reversal points.
Fibonacci Retracement Levels: To identify potential support and resistance levels.
RSI and Stochastic Oscillators: To spot overbought or oversold conditions.
Candlestick Patterns: To identify potential price reversals.
Volume Analysis: To confirm the strength of a trend.
1.5 Advantages of Swing Trading
Time Efficiency: Requires less constant monitoring compared to day trading.
Profit Potential: Captures short-term market swings that can be significant.
Flexibility: Can be applied to stocks, forex, commodities, and cryptocurrencies.
1.6 Risks and Challenges
Market Volatility: Unexpected news or events can trigger sharp price movements.
Overnight Risk: Prices can gap up or down between trading sessions.
Requires Discipline: Traders must stick to strategies and avoid emotional decisions.
2. Understanding Positional Trading
2.1 Definition
Positional trading is a long-term trading strategy where traders hold positions for weeks, months, or even years. Unlike swing trading, positional trading focuses on capturing major market trends rather than short-term price movements. Traders typically rely on a mix of fundamental analysis and technical analysis to identify long-term opportunities.
2.2 Objectives
The main goal of positional trading is to capitalize on large price movements over an extended period. Positional traders aim to ride the primary trend of an asset, ignoring minor fluctuations to avoid excessive trading and transaction costs.
2.3 Key Strategies in Positional Trading
Trend Following: Entering positions in alignment with the prevailing long-term trend.
Fundamental Analysis: Evaluating company financials, economic indicators, and macroeconomic trends to select assets with growth potential.
Breakout and Support/Resistance Analysis: Using long-term chart patterns such as triangles, head and shoulders, or channel patterns to make trading decisions.
Moving Average Crossovers: Using long-term moving averages (e.g., 50-day and 200-day) to identify trend direction.
2.4 Tools and Indicators
Positional traders focus on long-term technical and fundamental tools:
Fundamental Reports: Company earnings, economic data, and geopolitical developments.
Long-Term Moving Averages: To detect primary trends.
Trend Lines and Channels: For identifying support and resistance zones.
Technical Patterns: Such as cup-and-handle, double top/bottom for long-term breakout opportunities.
2.5 Advantages of Positional Trading
Less Time-Intensive: Requires minimal day-to-day monitoring.
Lower Transaction Costs: Fewer trades reduce brokerage fees.
Potential for Large Gains: Capturing long-term trends can result in substantial profits.
2.6 Risks and Challenges
Market Corrections: Long-term holdings are susceptible to market corrections.
Capital Commitment: Funds remain tied up for extended periods.
Patience and Discipline Required: Traders must resist the urge to react to short-term volatility.
3. Risk Management in Both Styles
Risk management is vital for both swing and positional trading. Techniques include:
Stop-Loss Orders: Placing stop-loss levels to limit potential losses.
Position Sizing: Determining the appropriate trade size based on risk tolerance.
Diversification: Avoiding concentration in a single asset or sector.
Regular Review: Monitoring positions and adjusting strategies as market conditions change.
4. Practical Examples
4.1 Swing Trading Example
A swing trader identifies a stock in a strong upward trend with support at ₹500 and resistance at ₹550. The trader buys at ₹505 and targets a sell at ₹545, with a stop-loss at ₹495. Over a week, the stock rises to ₹545, yielding a short-term profit.
4.2 Positional Trading Example
A positional trader identifies a technology stock with strong fundamentals and long-term growth prospects. Buying at ₹1,000 with a target of ₹1,500 over the next year, the trader ignores minor fluctuations, focusing on the overall upward trend. Over several months, the stock appreciates steadily, achieving the target.
5. Integrating Both Strategies
Some traders combine swing and positional strategies:
Hybrid Approach: Holding a core long-term position while taking short-term swing trades on other assets.
Hedging: Using swing trades to hedge risks in a long-term portfolio.
This approach allows traders to balance risk and reward while leveraging both short-term and long-term opportunities.
6. Psychological Aspects
Swing Traders: Must handle short-term volatility, avoid overtrading, and maintain discipline.
Positional Traders: Need patience, emotional stability, and a long-term mindset.
Emotional discipline and mental resilience are key to success in both trading styles.
Conclusion
Both swing trading and positional trading offer valuable opportunities in financial markets. Swing trading is ideal for traders seeking short-term profits from market fluctuations, while positional trading suits those aiming to capture long-term trends. Choosing the right strategy depends on individual risk tolerance, time availability, and market knowledge. Mastery of technical analysis, risk management, and psychological discipline is essential for success in either style. Combining insights from both strategies can provide a comprehensive approach to trading, maximizing profits while mitigating risks.

Smart Liquidity Trading Strategies1. Understanding Market Liquidity
Market liquidity refers to the ease with which an asset can be converted to cash at a stable price. High liquidity implies narrow bid-ask spreads, large volumes, and low volatility for a given transaction size, while low liquidity involves wider spreads, lower volume, and higher volatility. Understanding liquidity is crucial for trading strategies because:
Liquidity affects execution costs.
Illiquid markets are prone to sharp price moves.
Market participants’ behavior can create temporary liquidity imbalances, which smart traders exploit.
Liquidity can be categorized into:
Natural liquidity – The existing supply and demand for an asset.
Hidden liquidity – Orders that are not visible in the order book but can influence prices, such as iceberg orders.
Synthetic liquidity – Created by market participants through strategies like high-frequency trading (HFT) or algorithmic trading.
2. Types of Liquidity Trading Strategies
Smart liquidity trading strategies can be broadly classified into several types:
2.1 Order Book Analysis
The order book shows the real-time buy (bid) and sell (ask) orders. Smart traders analyze the order book to detect liquidity clusters:
Support and Resistance Liquidity Zones: Large order clusters act as barriers to price movement. If the buy-side has a significant volume, it can provide support. Conversely, large sell orders can act as resistance.
Order Flow Imbalances: When the number of aggressive buy orders exceeds sell orders, it can indicate potential upward price pressure, and vice versa.
Tools such as depth-of-market (DOM) screens, Level II quotes, and heatmaps allow traders to visualize these liquidity zones.
2.2 Volume-Weighted Strategies
Volume is a direct proxy for liquidity. Smart liquidity traders often use volume-weighted techniques:
Volume Weighted Average Price (VWAP) Trading: VWAP is the average price of a security weighted by its traded volume. Traders aim to buy below or sell above VWAP to minimize market impact.
Liquidity-Seeking Algorithms: Large institutional orders are split and executed in small portions based on current liquidity to avoid slippage. Algorithms like VWAP, TWAP (Time-Weighted Average Price), and POV (Percentage of Volume) are commonly used.
2.3 Price Action and Liquidity Gaps
Liquidity gaps occur when the order book is thin at certain price levels. Smart traders exploit these gaps:
Breakout Trading: Thin liquidity areas often allow prices to accelerate quickly once the barrier is breached.
Stop-Hunting Strategies: Large participants sometimes trigger liquidity pools (stop-loss clusters) to create favorable price movements. Traders who understand liquidity dynamics can anticipate these zones.
2.4 High-Frequency and Algorithmic Liquidity Strategies
High-frequency traders (HFTs) specialize in identifying and exploiting transient liquidity imbalances. Examples include:
Market-Making: Providing liquidity by continuously quoting buy and sell prices and profiting from the spread.
Latency Arbitrage: Exploiting delays in price updates across exchanges or trading venues.
Liquidity Sniping: Targeting hidden orders when they are partially revealed or exposed due to large market moves.
2.5 Cross-Market and Cross-Asset Liquidity Trading
Liquidity is not confined to a single market. Smart traders examine correlations between markets:
Equity and Derivative Pairs: For example, the liquidity in index futures can provide insights into the underlying stocks’ potential moves.
Forex and Commodity Cross-Market Liquidity: Major currency pairs often exhibit predictable liquidity patterns, which can influence commodity prices, like oil or gold.
ETF Arbitrage: When ETF liquidity diverges from its underlying basket, traders can exploit the mispricing efficiently.
3. Smart Tools for Liquidity Analysis
Successful liquidity trading requires advanced tools and data sources:
Order Book and Level II Data: Visualizing real-time buy/sell orders and depth helps identify liquidity clusters and thin zones.
Volume Heatmaps: Identify where significant trading activity is occurring across price levels.
Liquidity Aggregators: Tools that combine order book data across multiple exchanges to provide a consolidated view.
Algorithmic Platforms: Automated execution minimizes slippage and optimizes order placement according to liquidity conditions.
News and Event Scanners: Market liquidity often changes during economic releases, corporate earnings, or geopolitical events. Monitoring these can prevent adverse execution.
4. Liquidity Timing Strategies
Timing is crucial in liquidity trading. Smart traders often consider:
Market Open and Close: Liquidity is often thin at market open, leading to high volatility. Conversely, liquidity peaks near close due to institutional rebalancing.
Intraday Patterns: Volume spikes are common at certain times of the day (e.g., after economic news). Traders can use these predictable patterns.
Event-Based Liquidity: Earnings announcements, central bank decisions, and geopolitical events create temporary liquidity vacuums or surges.
5. Risk Management in Liquidity Trading
While liquidity strategies can be profitable, they carry specific risks:
Execution Risk: Entering or exiting positions in illiquid markets may lead to slippage or partial fills.
Market Impact Risk: Large orders in thin markets can move prices against the trader.
Counterparty Risk: Over-reliance on automated systems or brokers may lead to failure if liquidity vanishes unexpectedly.
Overnight Risk: Illiquid positions held overnight can be vulnerable to gaps in price movement.
Smart liquidity traders manage these risks using:
Order Slicing: Breaking large trades into smaller orders to avoid price impact.
Stop-Loss Placement: Strategic placement in liquid zones to reduce adverse execution.
Diversification: Trading multiple correlated instruments to distribute liquidity risk.
Automated Monitoring: Alert systems to detect liquidity shifts and adjust execution dynamically.
6. Psychological and Behavioral Insights
Liquidity trading is not just technical; market psychology plays a key role:
Traders often herd around visible liquidity pools, creating predictable patterns.
Understanding the behavior of institutional participants, such as how they hide large orders, can give retail traders a strategic advantage.
Market sentiment can create sudden liquidity droughts, which savvy traders can exploit by anticipating crowd behavior.
7. Practical Examples of Smart Liquidity Strategies
Example 1: VWAP Execution
An institutional trader needs to buy 1 million shares without moving the market.
The algorithm executes trades according to intraday volume, ensuring the average price is near VWAP, minimizing slippage.
Example 2: Liquidity Gap Breakout
A stock shows a thin order book at a certain price level due to low participation.
A trader places a breakout order just above the liquidity gap, allowing rapid execution as the price accelerates through the thin zone.
Example 3: Cross-Market Arbitrage
ETF price deviates from its underlying basket due to temporary liquidity shortage.
Trader buys the cheaper asset and sells the overvalued counterpart, profiting as prices converge once liquidity returns.
Example 4: Stop-Loss Liquidity Pool Hunting
Large institutional stops often cluster near round numbers.
Smart traders identify these clusters and position accordingly, entering slightly before the expected cascade to benefit from the resulting liquidity surge.
8. Advanced Considerations
Hidden Liquidity: Iceberg orders and dark pools hide true market depth. Advanced traders use predictive analytics to estimate hidden volumes.
Liquidity Fragmentation: Markets are fragmented across multiple exchanges and dark pools. Consolidated data helps detect where liquidity is concentrated.
Dynamic Liquidity Modeling: Using AI and machine learning to predict how liquidity responds to price moves, news, and market sentiment.
9. Key Principles for Smart Liquidity Trading
Observe, Don’t Chase: Liquidity dynamics often reveal intentions of larger players. Observing patterns is more effective than aggressive chasing.
Minimize Market Impact: Use algorithms and staggered executions to preserve favorable prices.
Adapt to Market Conditions: Liquidity is dynamic; strategies must adjust intraday.
Leverage Technology: Automation, analytics, and high-speed data feeds are essential.
Integrate Risk Management: Smart liquidity trading combines precision entry, execution efficiency, and rigorous risk controls.
10. Conclusion
Smart liquidity trading strategies focus on understanding and leveraging the flow of market liquidity rather than simply predicting price direction. By analyzing order books, volume, cross-market activity, and behavioral patterns, traders can execute efficiently, reduce slippage, and identify profitable opportunities hidden in the market structure. These strategies require a combination of analytical skill, technological tools, and disciplined risk management. As markets evolve and liquidity becomes more fragmented, mastery of liquidity dynamics increasingly distinguishes professional traders from casual participants. The essence of smart liquidity trading lies in respecting the invisible currents of supply and demand, positioning oneself ahead of major flows, and executing with surgical precision.

Primary Market vs. Secondary Market in Indian Trading1. Introduction
Financial markets can broadly be divided into two categories: the primary market and the secondary market. These markets facilitate the trading of financial instruments such as equities, bonds, and derivatives. The primary market is the venue for raising new capital, whereas the secondary market is where existing securities are traded among investors. Both markets collectively ensure liquidity, capital formation, and price discovery in the Indian economy.
2. Primary Market
2.1 Definition
The primary market, also called the new issue market, is where companies raise capital directly from investors for the first time. This market deals with newly issued securities such as initial public offerings (IPOs), follow-on public offers (FPOs), private placements, and rights issues.
In India, the primary market is regulated by the Securities and Exchange Board of India (SEBI) to ensure transparency and protect investors’ interests.
2.2 Instruments in the Primary Market
Initial Public Offerings (IPOs)
Companies issue shares to the public for the first time to raise capital. For instance, Reliance Industries and Paytm used IPOs to generate significant funds.
Follow-on Public Offers (FPOs)
Companies that are already listed may issue additional shares to raise more capital.
Private Placements
Companies may issue securities to select institutional investors rather than the public.
Rights Issues
Existing shareholders are offered the right to purchase additional shares at a discounted price.
Debentures and Bonds
Debt instruments issued by companies or the government to raise funds for infrastructure, expansion, or operational purposes.
2.3 Functions of the Primary Market
Capital Formation
The primary market enables companies to raise funds for growth, expansion, or new projects.
Investment Opportunities
It provides investors with a chance to invest in new and potentially high-growth companies.
Economic Growth
By facilitating capital flow into productive sectors, the primary market contributes to industrial and economic development.
Government Financing
Government bonds issued in the primary market help fund public projects such as roads, hospitals, and infrastructure.
2.4 Process of Primary Market Transactions
Company Decision: The company decides to raise funds.
Appointment of Intermediaries: Merchant bankers, underwriters, and registrars are appointed.
Drafting Prospectus: A document outlining financials, risks, and objectives is prepared.
SEBI Approval: SEBI reviews the prospectus to ensure compliance.
Marketing and Subscription: Investors apply for securities through brokers or online platforms.
Allotment: Securities are allocated, and funds are transferred to the company.
Example: The 2023 IPO of Nykaa, a prominent e-commerce platform in India, followed this exact process to raise funds from retail and institutional investors.
2.5 Advantages of the Primary Market
Direct funding for companies without depending on loans.
Offers investors early-stage opportunities.
Encourages entrepreneurship and innovation.
Helps governments fund public projects efficiently.
2.6 Disadvantages of the Primary Market
Investment risk is higher due to uncertainty about new companies’ performance.
Time-consuming regulatory procedures.
Limited liquidity until shares are listed on a secondary market.
3. Secondary Market
3.1 Definition
The secondary market is where previously issued securities are traded between investors. Companies do not receive funds in this market; instead, it provides liquidity and enables price discovery for existing shares, bonds, or other financial instruments.
In India, secondary markets include stock exchanges like the NSE (National Stock Exchange) and BSE (Bombay Stock Exchange), where millions of investors trade daily.
3.2 Instruments in the Secondary Market
Equities (Shares of listed companies)
Debentures (Corporate and government bonds)
Mutual Funds
Derivatives (Options, futures, swaps)
Exchange-Traded Funds (ETFs)
3.3 Functions of the Secondary Market
Liquidity
Investors can easily buy and sell securities, providing an exit route from investments made in the primary market.
Price Discovery
Market forces of demand and supply determine the price of securities.
Investor Confidence
A transparent and regulated secondary market builds trust, encouraging more investment in the primary market.
Economic Indicator
The performance of stock exchanges reflects the economic health of the country.
3.4 Participants in the Secondary Market
Retail Investors
Individual investors trading through brokers or online platforms.
Institutional Investors
Mutual funds, insurance companies, banks, and foreign institutional investors (FIIs).
Brokers and Dealers
Facilitate trading and provide liquidity to the market.
Market Makers
Ensure constant buying and selling of securities to stabilize markets.
3.5 Advantages of the Secondary Market
Provides liquidity and flexibility to investors.
Encourages wider participation in capital markets.
Helps companies monitor investor sentiment.
Supports fair pricing of securities through continuous trading.
3.6 Disadvantages of the Secondary Market
Market volatility can lead to financial loss.
Prices may be influenced by speculation rather than fundamentals.
Requires active monitoring and knowledge to trade effectively.
4. Interaction Between Primary and Secondary Markets
The two markets are complementary. Funds raised in the primary market are invested in productive assets, while the secondary market ensures liquidity and provides investors with an avenue to exit their investments. A well-functioning secondary market encourages more participation in IPOs and other primary market instruments, creating a virtuous cycle of investment and growth.
Example in India: The IPO of Zomato in 2021 saw significant investor interest because investors knew they could sell shares on the NSE or BSE after listing.
5. Regulatory Framework in India
SEBI (Securities and Exchange Board of India) regulates both markets. Its responsibilities include:
Ensuring transparency and disclosure.
Protecting investors’ interests.
Approving IPOs and monitoring listings.
Regulating trading practices in the secondary market.
The Companies Act 2013 also governs corporate governance and disclosure norms for firms raising capital.
6. Current Trends in Indian Markets
Digital Platforms: Online trading and mobile apps have increased retail participation in both markets.
IPO Frenzy: High-growth startups are increasingly opting for public listings to raise funds.
Institutional Dominance: FIIs and domestic institutional investors drive volumes in secondary markets.
Derivatives Growth: Futures and options trading have become significant in India’s NSE and BSE markets.
Conclusion
The primary and secondary markets are essential pillars of the Indian financial system. The primary market enables companies to raise capital and supports economic growth, while the secondary market provides liquidity, facilitates price discovery, and instills investor confidence. Both markets are interconnected, and their smooth functioning is crucial for the stability and development of India’s capital market.
A robust understanding of these markets helps investors make informed decisions and allows companies to leverage capital efficiently, driving India toward sustained financial and economic growth.

Pair Trading and Statistical ArbitrageIntroduction
In the modern world of financial markets, trading strategies have evolved beyond mere speculation to include sophisticated mathematical and statistical methods. Two such strategies—pair trading and statistical arbitrage—have gained significant traction among institutional traders, hedge funds, and quantitative analysts. Both methods rely on identifying price relationships and exploiting short-term inefficiencies, offering traders the potential to earn profits regardless of market direction. These strategies are categorized under market-neutral trading, meaning they aim to minimize market exposure while profiting from relative price movements.
Pair Trading: Concept and Fundamentals
Pair trading is a market-neutral strategy that involves trading two historically correlated assets, usually stocks, such that when the price of one asset deviates from the other, traders take positions expecting a reversion to the mean. This approach was popularized by Nunzio Tartaglia and the quantitative team at Morgan Stanley in the 1980s and has since become a staple in quantitative trading.
Key Principles of Pair Trading:
Correlation Analysis:
The first step is to identify two assets with historically high correlation. This means that their prices generally move in tandem due to common economic, sectoral, or company-specific factors. For example, Coca-Cola and Pepsi, being major competitors in the beverage sector, often exhibit high correlation.
Price Divergence Detection:
Once a pair is selected, traders monitor for deviations from their historical price ratio. If one asset significantly outperforms the other, a trading opportunity arises.
Market-Neutral Positioning:
In a typical pair trade, traders buy the underperforming asset and short-sell the outperforming asset, expecting the spread to converge back to historical norms.
Mean Reversion Hypothesis:
Pair trading relies on the assumption of mean reversion—that asset prices will revert to their historical relationship over time. This principle differentiates pair trading from trend-following strategies, which assume that asset prices will continue in the same direction.
Example of a Pair Trade:
Selection: Consider stocks A and B, which normally maintain a 1:1 price ratio.
Divergence: Stock A rises by 10% while Stock B remains unchanged.
Trade Setup: Trader shorts Stock A and goes long on Stock B.
Outcome: If the prices converge (Stock A falls or Stock B rises), the trader profits from the spread rather than the absolute price movement.
Advantages of Pair Trading:
Market Neutrality: Profits can be made in bullish, bearish, or sideways markets.
Risk Reduction: Diversification across two correlated assets reduces exposure to overall market risk.
Quantitative Precision: Historical data allows statistical modeling to optimize entry and exit points.
Limitations:
Model Risk: Historical correlations may break due to structural market changes.
Execution Costs: Frequent trades may incur transaction costs and slippage, affecting profitability.
Tail Risk: Extreme market events can disrupt correlations, leading to significant losses.
Statistical Arbitrage: Advanced Quantitative Strategy
Statistical arbitrage (or stat arb) is a broader, more sophisticated trading strategy that extends the principles of pair trading to multiple assets, sectors, or even markets. It uses advanced statistical and mathematical models to exploit short-term mispricings across securities. Unlike pair trading, which focuses on a single pair, statistical arbitrage often involves portfolios of hundreds of assets, dynamically adjusting positions based on predictive models.
Core Components of Statistical Arbitrage:
Quantitative Modeling:
Stat arb relies on rigorous quantitative techniques such as cointegration analysis, principal component analysis (PCA), and machine learning algorithms to identify relationships among assets and forecast price deviations.
High-Frequency and Low-Latency Trading:
Many stat arb strategies operate in high-frequency trading (HFT) environments, capitalizing on price inefficiencies that exist for milliseconds or seconds. Advanced infrastructure is critical to minimize latency and maximize profits.
Mean Reversion and Momentum Models:
While pair trading primarily depends on mean reversion, stat arb strategies can integrate momentum signals, volatility adjustments, and cross-asset relationships, making them more adaptive to changing market conditions.
Portfolio Diversification:
Statistical arbitrage typically constructs a market-neutral portfolio where the combined long and short positions are balanced. This diversification reduces idiosyncratic risk and enhances the stability of returns.
Steps in Statistical Arbitrage:
Data Collection: Gather historical prices, volumes, fundamental data, and macroeconomic indicators.
Signal Generation: Use statistical methods to identify mispricings or anomalies.
Position Sizing: Optimize weights of long and short positions using risk-adjusted metrics like Sharpe ratios or Value at Risk (VaR).
Execution: Employ automated trading systems to enter and exit positions efficiently.
Monitoring and Adjustment: Continuously recalibrate models to adapt to market changes.
Example of Stat Arb:
Universe Selection: 100 tech stocks listed on the NASDAQ.
Signal Identification: PCA reveals that three stocks deviate significantly from their predicted factor loadings.
Trade Execution: Short the overperforming stocks and go long on underperforming ones, with hedging adjustments to maintain market neutrality.
Profit Realization: Gains come from convergence toward predicted statistical relationships rather than the absolute market movement.
Advantages of Statistical Arbitrage:
High Return Potential: Exploiting numerous minor mispricings across assets can compound into substantial profits.
Robust Risk Management: Diversification across multiple positions reduces the impact of single-event risks.
Algorithmic Precision: Automated systems allow for consistent application of complex models without emotional bias.
Limitations:
Model Complexity: Requires sophisticated mathematical knowledge and programming expertise.
Data Dependency: Reliance on historical patterns may fail in new market regimes or during structural breaks.
Competition and Crowding: High adoption among hedge funds can reduce alpha generation and compress profits.
Transaction Costs: Frequent trading can significantly erode net returns if not carefully managed.
Applications in Modern Markets
Equity Markets:
Both strategies are extensively used in stock markets. Pair trading is popular among retail and hedge fund traders, while stat arb dominates quantitative hedge funds like Renaissance Technologies and Two Sigma.
Forex Markets:
Currency pairs offer excellent opportunities for pair trading due to their inherent correlation, especially in major currency crosses like EUR/USD and GBP/USD.
Commodity Markets:
Related commodities such as crude oil and natural gas, or gold and silver, can be traded using mean reversion-based strategies.
Derivatives:
Options and futures can be incorporated in statistical arbitrage models to hedge volatility and leverage complex payoffs.
Cross-Market Arbitrage:
Advanced stat arb strategies may exploit mispricings between equities, bonds, commodities, and currencies, often using global market data for predictive modeling.
Risk Management Considerations
Even market-neutral strategies are not risk-free. Key considerations include:
Correlation Breakdown: Assets that were historically correlated may diverge due to sectoral shocks or macroeconomic events.
Execution Risk: Delays, slippage, and partial fills can reduce expected profits.
Model Risk: Overfitting historical data may generate false signals.
Liquidity Risk: Some stocks or assets may lack sufficient volume to execute large positions without impacting price.
Tail Risk Events: Extreme market events, like the 2008 financial crisis, can overwhelm statistical relationships.
Effective risk management involves:
Position limits
Stop-loss mechanisms
Diversification across multiple pairs or portfolios
Continuous model recalibration
Technological Requirements
Both pair trading and statistical arbitrage benefit from technology:
Data Infrastructure: Access to high-quality historical and real-time data is critical.
Algorithmic Trading Platforms: Automatic order placement reduces latency and improves execution efficiency.
Statistical Software: Tools like Python, R, MATLAB, and machine learning frameworks enable modeling of complex relationships.
Backtesting Capabilities: Simulating strategies on historical data helps identify weaknesses before deploying capital.
Conclusion
Pair trading and statistical arbitrage represent the pinnacle of quantitative, market-neutral trading strategies. Pair trading offers a straightforward approach based on relative price movements between two correlated assets, while statistical arbitrage scales this concept to multiple securities, employing complex models to exploit small inefficiencies. Both approaches underscore the importance of data-driven decision-making, risk management, and technological sophistication in modern financial markets.
While these strategies can generate consistent returns with reduced exposure to market direction, they are not without challenges. Market structural changes, execution costs, and model risk can erode profitability if not carefully managed. Therefore, success in pair trading and statistical arbitrage requires a combination of statistical expertise, trading discipline, and continuous adaptation to evolving market conditions.
Ultimately, these strategies exemplify how modern finance increasingly relies on quantitative methods, automation, and statistical reasoning to navigate complex markets and extract alpha in a competitive, high-speed trading environment.
Thematic Trading vs. Sectoral Rotation: A Comprehensive Analysis1. Introduction to Market Strategies
Investors constantly seek strategies to outperform the market, hedge risks, and align investments with broader economic and societal trends. Two such strategies—thematic trading and sectoral rotation—have gained prominence in recent years due to their potential to deliver above-average returns while allowing investors to align their portfolios with macroeconomic or microeconomic shifts.
Thematic trading involves identifying long-term structural trends or themes that could drive growth across multiple sectors and regions. This strategy is typically future-oriented and is influenced by technological innovation, demographic shifts, environmental changes, and other global trends.
Sectoral rotation, on the other hand, focuses on moving investments between different sectors of the economy depending on the current stage of the economic cycle or market sentiment. It is cyclical and tends to rely on macroeconomic indicators, corporate earnings reports, and sector-specific valuations.
While both strategies aim to enhance returns, their methodologies, timelines, and risk profiles differ significantly.
2. Thematic Trading: Definition and Approach
Thematic trading is the practice of investing based on overarching global or domestic trends that are expected to persist over a long period. These themes are not limited to individual sectors but often span multiple industries, geographies, or asset classes.
2.1 Key Characteristics
Long-term horizon: Thematic trading typically involves a medium- to long-term investment horizon, often spanning several years or even decades.
Trend-driven: Themes are identified based on macro trends like technological innovation (e.g., AI, robotics), environmental sustainability (e.g., renewable energy), or demographic shifts (e.g., aging populations, urbanization).
Cross-sector approach: Investments often span multiple sectors affected by the theme. For example, a “clean energy” theme could include solar manufacturers, battery producers, and electric vehicle companies.
Narrative-based: Thematic investing often relies on compelling narratives supported by research rather than purely quantitative indicators.
2.2 Examples of Popular Themes
Technology Revolution: AI, cloud computing, 5G, and semiconductors.
Green Energy & Sustainability: Solar, wind, electric vehicles, and ESG-focused companies.
Demographic Shifts: Companies targeting aging populations, healthcare innovation, or emerging markets urbanization.
Digital Economy: E-commerce, fintech, online entertainment, and cybersecurity.
2.3 Advantages of Thematic Trading
Alignment with macro trends: Investors can capitalize on long-term structural shifts before they are fully priced into the market.
Diversification across sectors: Even though the investment is theme-based, exposure across multiple industries reduces the risk of sector-specific shocks.
High growth potential: Being early in a theme can lead to substantial capital gains, especially if the trend becomes dominant.
2.4 Challenges of Thematic Trading
Execution risk: Identifying a successful theme and selecting the right companies or instruments requires extensive research.
Volatility: Themes can be highly sensitive to market sentiment, technological breakthroughs, or regulatory changes.
Timing difficulty: While the long-term trend may be solid, short-term corrections can be severe.
3. Sectoral Rotation: Definition and Approach
Sectoral rotation is a strategy where investors periodically shift their investments from one sector to another to capitalize on economic cycles. Unlike thematic trading, which is trend-driven, sectoral rotation is cycle-driven.
3.1 Key Characteristics
Short- to medium-term horizon: Typically ranges from a few months to a few years, depending on the economic cycle.
Cyclicality: Sector performance is tied to the stages of the economic cycle—expansion, peak, contraction, and trough.
Macro-driven: Investors rely heavily on macroeconomic indicators, such as GDP growth, interest rates, inflation, and consumer confidence, to anticipate sector performance.
Active management: Sector rotation requires regular monitoring and adjustments to the portfolio based on evolving economic conditions.
3.2 Economic Cycle and Sector Performance
Different sectors historically perform better at different stages of the economic cycle:
Economic Stage Sectors Likely to Outperform
Expansion Technology, Industrials, Consumer Discretionary
Peak Energy, Materials, Industrials
Contraction Consumer Staples, Utilities, Healthcare
Trough Financials, Real Estate, Technology (selective)
This table demonstrates that sector rotation is closely tied to macroeconomic trends rather than long-term structural shifts.
3.3 Advantages of Sectoral Rotation
Capitalizing on cycles: Investors can enhance returns by moving capital into sectors poised to outperform in the current economic phase.
Risk mitigation: By exiting underperforming sectors, investors can reduce exposure to cyclical downturns.
Data-driven decisions: Decisions are grounded in macroeconomic and sector-specific data, making it systematic.
3.4 Challenges of Sectoral Rotation
Timing risk: Mistiming entry or exit from sectors can erode returns.
Frequent adjustments: Requires active portfolio management, which can increase transaction costs.
Market unpredictability: Economic indicators do not always perfectly predict sector performance; external shocks can disrupt patterns.
4. Practical Implementation
4.1 Implementing Thematic Trading
Research: Identify global megatrends and assess their sustainability.
Stock selection: Pick companies that are leaders or innovators in the theme.
ETFs & mutual funds: Thematic ETFs offer diversified exposure to the theme without concentrated stock risk.
Portfolio allocation: Typically a part of a broader diversified strategy due to high volatility.
4.2 Implementing Sectoral Rotation
Macro analysis: Monitor economic indicators such as interest rates, industrial production, consumer spending, and inflation.
Sector selection: Identify sectors likely to outperform in the current stage of the economic cycle.
Tactical allocation: Adjust portfolio weights periodically to optimize returns.
Use of ETFs: Sector ETFs allow quick rotation without individual stock risk.
5. Synergies and Integration
Interestingly, investors can combine thematic trading and sectoral rotation to balance long-term growth and short-term tactical gains. For example:
Base investment in long-term themes like renewable energy or AI for structural growth.
Tactical adjustments through sectoral rotation based on economic cycles to capture cyclical opportunities in related sectors.
This hybrid approach leverages the strengths of both strategies—long-term upside potential from thematic exposure and short-term performance enhancement from tactical rotation.
6. Risk Considerations
6.1 Thematic Trading Risks
Misjudging the theme’s longevity or relevance.
Concentration in a narrow set of high-growth stocks.
Regulatory or technological disruptions affecting the theme.
6.2 Sectoral Rotation Risks
Poor timing leading to missed gains or losses.
Unexpected macro shocks that disrupt sector performance.
Overtrading, leading to high transaction costs.
Mitigation strategies include diversification, continuous research, use of ETFs, and disciplined rebalancing.
Conclusion
Thematic trading and sectoral rotation are powerful investment strategies, each tailored to different market perspectives and investor goals.
Thematic trading offers exposure to transformative long-term trends and is suitable for investors with a higher risk appetite and long-term horizon. It relies on strategic vision and foresight into future developments.
Sectoral rotation is a tactical, cycle-driven approach that allows investors to capitalize on short- to medium-term opportunities in line with the economic cycle. It demands active monitoring and timing skills.
Understanding the distinction, strengths, and limitations of these strategies enables investors to select the right approach—or a combination—for their portfolio objectives. While thematic trading emphasizes vision and innovation, sectoral rotation emphasizes timing and macro awareness. When used thoughtfully, both can significantly enhance portfolio returns while mitigating risk.

How to Control Trading Risk FactorsIntroduction
Trading, whether in stocks, forex, commodities, or cryptocurrencies, offers immense opportunities for profit—but also significant risk. Every trader, from a beginner to a seasoned professional, must manage uncertainty and potential losses that accompany market volatility. The key to long-term success in trading is not just finding profitable opportunities but controlling risk effectively. Managing risk ensures survival during market downturns and allows traders to stay in the game long enough to benefit from profitable phases.
This comprehensive guide explains the major risk factors in trading and the best strategies to control them through discipline, planning, diversification, and emotional control.
1. Understanding Trading Risk
Trading risk refers to the potential for losses resulting from changes in market prices, volatility, leverage, or unexpected events. It is impossible to eliminate risk completely, but traders can minimize it through strategic planning and risk management tools.
There are several kinds of trading risks:
Market Risk:
The most common type, arising from fluctuations in price due to supply-demand shifts, geopolitical events, or macroeconomic indicators.
Liquidity Risk:
Occurs when an asset cannot be sold quickly without causing a significant price drop.
Leverage Risk:
Using borrowed funds to trade can amplify both gains and losses, leading to faster account depletion.
Operational Risk:
Includes system failures, technical glitches, or execution errors in placing orders.
Psychological Risk:
Emotional decision-making due to greed, fear, or overconfidence, often leading to poor trades.
Political and Economic Risk:
Policy changes, elections, or international conflicts that disrupt market stability.
Understanding these risks is the first step toward developing strategies to control them effectively.
2. Importance of Risk Management in Trading
Risk management is the foundation of professional trading. It focuses on preserving capital rather than chasing profit. The main objective is to ensure that no single trade or event can cause catastrophic losses.
Key benefits of risk management include:
Capital preservation: Protecting your funds ensures longevity in the market.
Consistency: Avoids large losses that disrupt performance.
Emotional stability: Reduces stress and prevents impulsive decisions.
Improved performance: Controlled risk allows traders to follow strategies with discipline.
A trader who loses 50% of their account needs to make a 100% return just to break even. Hence, risk control is not optional—it is essential for survival and growth.
3. Setting a Risk Tolerance Level
Every trader should establish a risk tolerance—the amount they are willing to lose on a trade or series of trades. This depends on:
Trading capital
Experience level
Market volatility
Personal financial goals
A common rule is to risk no more than 1-2% of total capital per trade. For example, if your account is $10,000, your maximum loss per trade should not exceed $100–$200. This ensures that even a streak of losing trades will not wipe out your account.
Additionally, it’s important to determine your maximum drawdown tolerance—the total loss from peak to trough that you can sustain before reconsidering your strategy.
4. Position Sizing and Capital Allocation
Position sizing is the process of determining how much capital to allocate to a particular trade. Proper position sizing prevents overexposure to a single asset.
A simple formula for determining position size is:
Position Size = (Account Size × Risk per Trade) ÷ Stop-Loss Distance
For example, if your account size is $20,000 and you risk 2% ($400) per trade, with a stop-loss 50 points away, your position size should be $8 per point ($400 ÷ 50).
In addition:
Diversify across sectors, currencies, or asset classes.
Avoid correlated trades (e.g., trading both crude oil and energy stocks simultaneously).
Keep a cash reserve for volatility spikes or margin calls.
5. The Role of Stop-Loss Orders
Stop-loss orders are one of the most effective tools for risk control. They automatically close a position when the price hits a predetermined level, preventing further losses.
Types of stop-loss orders include:
Fixed Stop-Loss: Set at a specific price level.
Trailing Stop-Loss: Moves with the price, locking in profit as the market moves favorably.
Volatility-Based Stop: Adjusted based on the market’s volatility using tools like the Average True Range (ATR).
Stop-loss placement should depend on market structure, not emotions. Setting it too close might trigger premature exits, while too far may cause large losses.
A good strategy is to place stops beyond key support/resistance levels, maintaining a favorable risk-to-reward ratio—ideally 1:2 or better (risking $1 to make $2).
6. Using Take-Profit and Trailing Strategies
While stop-losses limit downside, take-profit levels lock in gains. Establishing clear profit targets ensures you don’t let greed turn winning trades into losing ones.
A trailing stop adjusts dynamically as the price moves in your favor, allowing profits to grow while protecting gains. For example, if a stock rises from $100 to $110, a trailing stop set at $2 below the highest price would lock in profits once the price falls to $108.
This method balances the desire for larger profits with the discipline to protect existing ones.
7. Diversification and Correlation Control
Diversification spreads risk across multiple instruments, reducing the impact of a single loss. However, diversification must be intelligent. Holding several highly correlated assets does not reduce risk—it simply multiplies exposure.
For example:
Gold and silver often move in the same direction.
Major currency pairs like EUR/USD and GBP/USD are positively correlated.
Traders can analyze correlation coefficients to ensure portfolio balance. Aim to include assets with low or negative correlations, such as stocks and bonds, or currencies from different regions.
8. Managing Leverage and Margin
Leverage amplifies both profit and loss. While it attracts traders with the promise of higher returns, it can quickly lead to ruin if not controlled.
To manage leverage risk:
Use lower leverage ratios (e.g., 1:5 or 1:10) instead of excessive ones (1:100).
Monitor margin levels carefully to avoid forced liquidations.
Trade only with funds you can afford to lose.
Professional traders use leverage sparingly, often only when they have strong conviction and a clear stop-loss strategy.
9. Risk-Reward Ratio and Probability Management
Successful traders focus on probabilities, not predictions. Every trade should have a positive expected value (EV)—meaning potential profit outweighs potential loss.
The formula for expected value is:
EV = (Winning Probability × Average Win) – (Losing Probability × Average Loss)
For example, if your strategy wins 60% of the time with an average win of $200 and an average loss of $100, then:
EV = (0.6 × 200) – (0.4 × 100) = $80 profit per trade on average.
Maintaining a risk-to-reward ratio of 1:2 or higher ensures profitability even with moderate accuracy.
10. Technical and Fundamental Risk Control Tools
Modern trading offers numerous analytical tools to control risk:
Technical Indicators: Moving Averages, RSI, MACD, and Bollinger Bands help identify trend strength and reversal points.
Volatility Measures: The Average True Range (ATR) and VIX index guide traders on when to reduce position sizes during high volatility.
Fundamental Analysis: Studying interest rates, inflation data, and earnings reports helps anticipate market shifts.
Sentiment Analysis: Tracking market sentiment can reveal overbought or oversold conditions.
Combining these approaches gives a comprehensive understanding of when to enter or exit trades safely.
11. The Psychology of Risk Control
One of the biggest challenges in trading is emotional control. Fear and greed can distort judgment, leading to impulsive trades or hesitation.
To control psychological risk:
Follow a trading plan: Stick to predefined rules for entry, exit, and risk.
Avoid revenge trading: Don’t try to recover losses immediately—it often worsens them.
Accept losses as part of the process: Even the best traders lose frequently.
Use journaling: Track your trades and emotions to identify behavioral patterns.
Emotional discipline is as important as technical skill in maintaining consistent performance.
12. Developing a Risk Management Plan
A well-structured risk management plan should include:
Trading Goals: Define profit targets and acceptable drawdown limits.
Capital Allocation: Decide how much capital to risk per trade.
Position Sizing Formula: Apply consistent rules for trade volume.
Stop-Loss and Take-Profit Rules: Set these before entering any trade.
Diversification Strategy: Limit exposure to correlated assets.
Review Process: Analyze performance weekly or monthly and adjust strategies.
This plan acts as a rulebook, keeping traders objective even during volatile market conditions.
13. Technology and Automation in Risk Control
Automation has revolutionized risk management. Algorithmic trading systems can execute trades with predefined rules, removing emotional bias.
Tools like:
Automated stop-loss execution
Portfolio tracking dashboards
Risk calculators
help traders monitor exposure and respond to changing conditions instantly.
Moreover, AI-driven trading systems can detect unusual market movements, improving real-time decision-making.
14. Continuous Learning and Adaptation
Markets evolve constantly. Economic cycles, regulations, and technology all influence volatility. Hence, traders must continuously adapt their risk management techniques.
Regularly review:
Strategy performance metrics (win rate, profit factor, drawdown).
Market news and central bank policies.
Trading journal entries to refine emotional and strategic weaknesses.
Adaptability separates successful traders from those who fail to adjust to new realities.
Conclusion
Controlling trading risk is not about eliminating it—it’s about managing it intelligently. A trader who understands risk tolerance, uses proper position sizing, applies stop-loss orders, diversifies holdings, and maintains emotional discipline builds a foundation for consistent success.
Risk control transforms trading from gambling into a professional, structured endeavor. By mastering capital management, leverage discipline, and psychological stability, traders ensure longevity in the market. Remember, the best traders are not those who make the most money in one day—but those who never lose too much on any single day.
Trading will always involve uncertainty, but with a robust risk control strategy, you can turn that uncertainty into opportunity—confidently, consistently, and profitably.
Divrgence Secrets The Indian Options Market
In India, NSE (National Stock Exchange) is the major platform for options trading.
Most trading occurs in index options like NIFTY and BANKNIFTY, and in stock options of large companies.
Options are settled in cash, and expiry usually happens weekly (for indices) and monthly (for stocks).

Part 1 Intraday TradingKey Terms in Option Trading
To understand option trading well, you must know these important terms:
Strike Price: The fixed price at which the underlying asset can be bought or sold.
Premium: The price paid to purchase an option.
Expiry Date: The date when the option contract ends.
In the Money (ITM): When exercising the option is profitable.
Out of the Money (OTM): When exercising the option is not profitable.
At the Money (ATM): When the asset’s price is equal to the strike price.

NCC 1 Day Time Frame ✅ Key data & current state
The stock is trading around ~₹ 206-₹ 209 as quoted recently.
On the daily chart:
14-day RSI is ~54 (neutral zone) according to one source.
Moving averages: 5-day MA ~208.19, 50-day ~208.28 (both slightly above current price) → bullish sign short term.
200-day MA ~209.77 is slightly above current price, meaning price is just below a longer-term average.
Technical indicators show mixed signals: some “buy” signals from moving averages, but overall “neutral” from aggregate indicators.
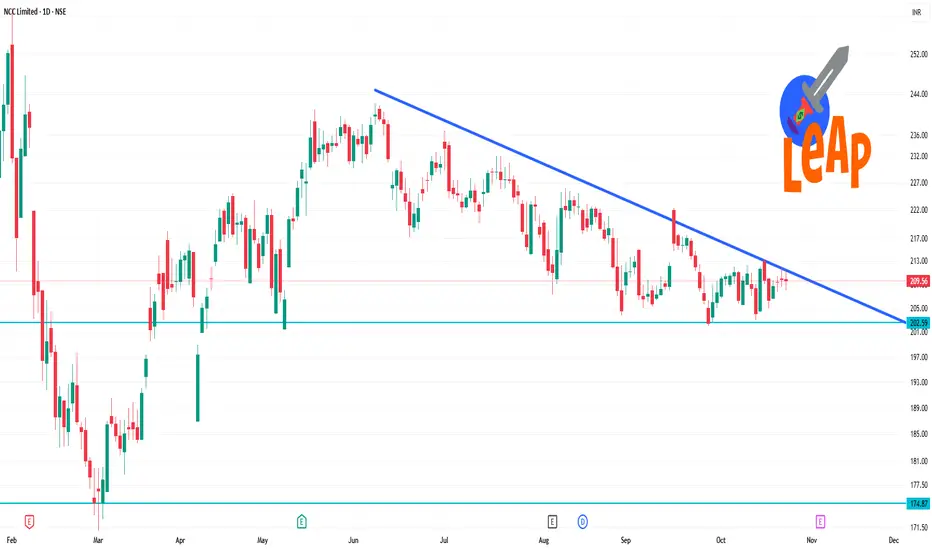
Sensex 1 Day Time frame The current value is around ₹84,211.88, down about -344.52 points (-0.41%) for the day.
The intraday range was roughly ₹83,957.15 (low) to ₹84,707.44 (high).
Over the past 24 hours the swing has been relatively modest (-0.07% according to one source).

PRIMESECU 1 Day Time Frame 📊 Intraday Support & Resistance Levels
Based on recent technical analysis, here are the key intraday levels for PRIMESECU:
Resistance Levels:
R1: ₹288.02
R2: ₹295.63
R3: ₹301.37
Support Levels:
S1: ₹278.85
S2: ₹286.32
These levels are derived from pivot points and recent price action, providing a framework for potential entry and exit points during intraday trading.

CEATLTD 1 Day Time Frame 📊 Key Intraday Levels
Opening Price: ₹4,262.50
Closing Price: ₹4,140.90
Day’s Range: ₹4,111.70 – ₹4,299.00
VWAP (Volume-Weighted Average Price): ₹4,218.63
Upper Circuit Limit: ₹5,163.20
Lower Circuit Limit: ₹3,442.20
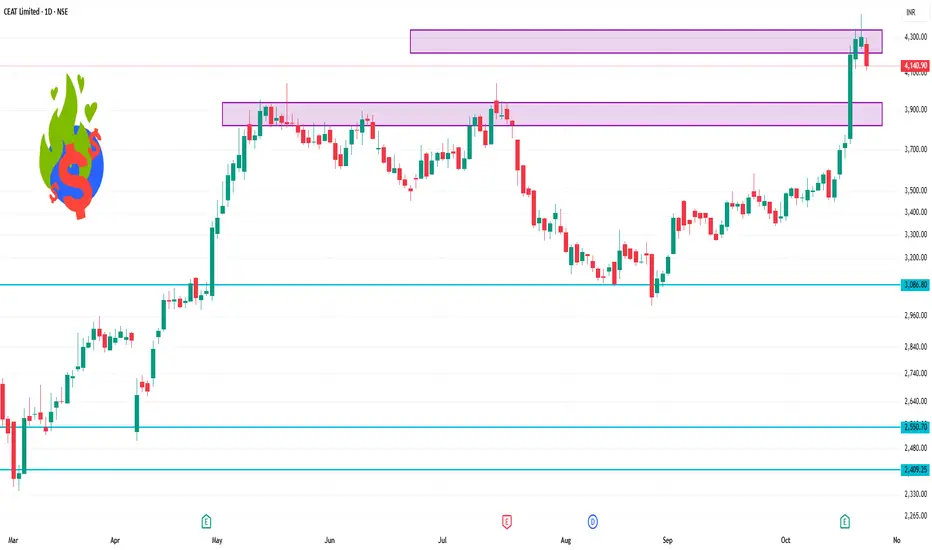
WHIRLPOOL 1 Week Time frame Weekly Performance:
Current Price: ₹1,370.60
Weekly Change: +9.49%
Technical Indicators:
1-Week Trend: Bullish
1-Month Trend: Bearish
Relative Strength Index (RSI): 55.25 (Neutral)
Moving Averages: The stock is above its 50-day and 200-day moving averages, indicating a bullish outlook.
Support and Resistance Levels:
Support: ₹1,269.45
Resistance Targets: ₹1,738.45, ₹1,888.40, ₹2,246.90, ₹2,435.95
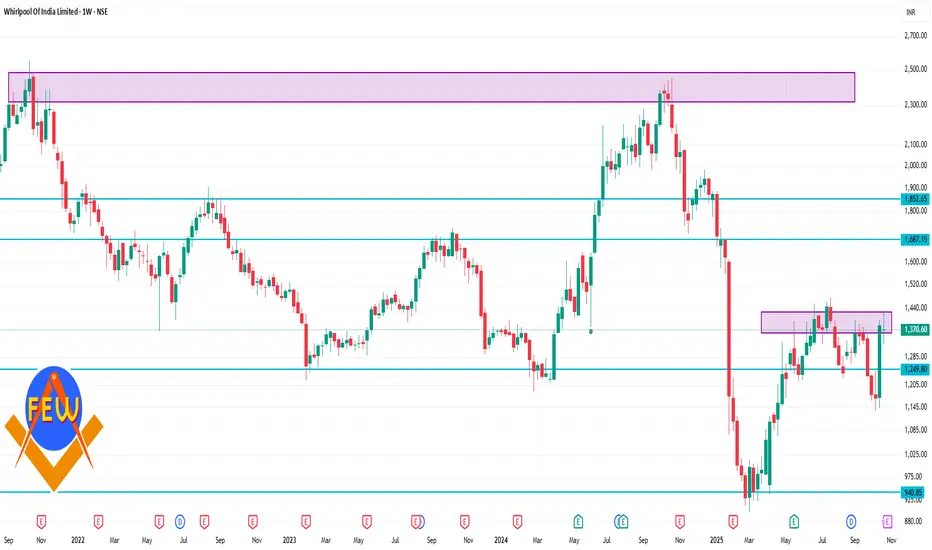
Part 9 Trading Master ClassHow Option Trading Works
Let’s take an example:
You buy a call option for a stock at a strike price of ₹100 for a premium of ₹5.
If the stock price rises to ₹120 before expiry, you can exercise your right to buy at ₹100 and sell at ₹120, earning ₹20 profit per share (minus ₹5 premium = ₹15 net profit).
If the price remains below ₹100, you simply let the option expire and lose only the premium paid (₹5).
This flexibility — limited loss and unlimited profit potential for buyers — is what makes option trading so attractive.

Nifty 50 1 Week Time Frame 📊 Weekly Support & Resistance Levels
Immediate Support: 25,700 – 25,650
A break below this level could lead to further declines towards 25,500 – 25,450.
Immediate Resistance: 25,950 – 26,000
Sustained trading above this range may push the index towards 26,200 – 26,250.
🔍 Technical Indicators
Pivot Points: Weekly pivot is around 25,974.00, with R1 at 26,238.20 and S1 at 25,517.30.
Fibonacci Levels: Retracement levels suggest support near 25,524.90 and resistance around 26,249.29.
RSI: Currently in a bullish zone, indicating sustained upward momentum.
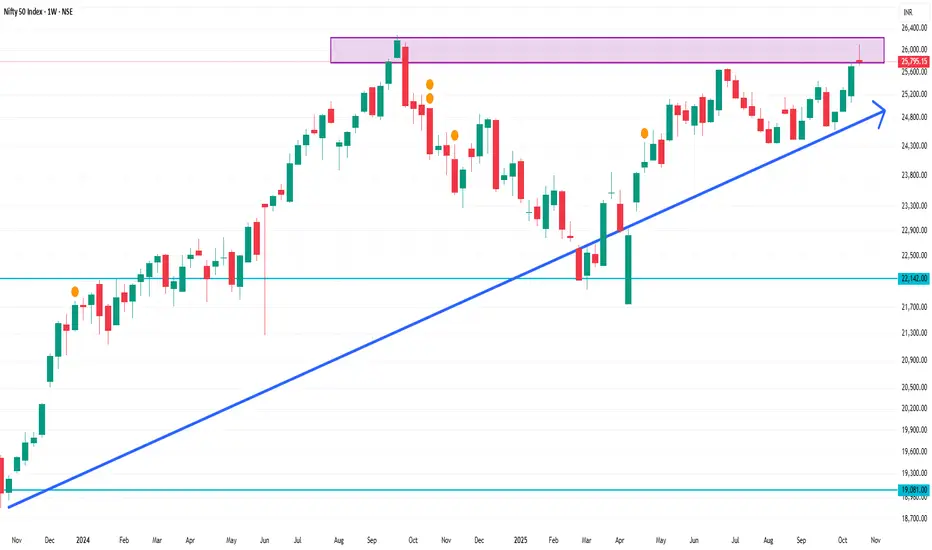
NETWEB 1 Week Time Frame 📉 Weekly Performance
Current Price: ₹3,743.70
1-Week Change: -2.19%
52-Week Range: ₹1,251.55 – ₹4,479.00
📌 Key Support & Resistance Levels
Immediate Support: ₹3,700
Immediate Resistance: ₹3,800
52-Week High: ₹4,479.00
52-Week Low: ₹1,251.55
🧠 Overall Technical Outlook
Trend: Bearish
Indicators: Majority suggest a sell or neutral stance
Market Sentiment: Weak, with potential for further downside if support levels are breached