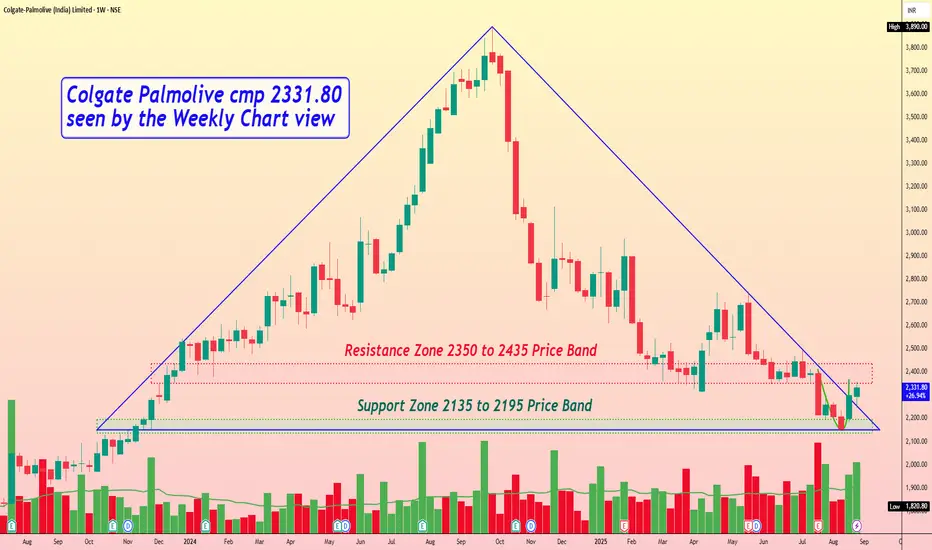
Colgate Palmolive cmp 2331.80 by Weekly Chart viewColgate Palmolive cmp 2331.80 by Weekly Chart view
- Support Zone 2135 to 2195 Price Band
- Resistance Zone 2350 to 2435 Price Band
- Triangle Breakout attempted by current stock chart technical setup
- Support Zone has been under testing retesting phase for the Support Zone
- Bullish Rounding Bottom on Weekly Chart and close Cup & Handle on Daily Chart
- Volumes are seen well in sync with the average quantity traded over the past few weeks
Trendlinebreakoutwithtarget
Diffusion Engineers cmp 357.70 by Daily Chart view since listedDiffusion Engineers cmp 357.70 by Daily Chart view since listed
- Support Zone 325 to 345 Price Band
- Resistance Zone 365 to 385 Price Band
- Volumes are seen spiking above the average traded quantity
- Price trending and respecting the rising Rising Support Trendline
- Dotted Falling Resistance Trendline Breakout seems been attempted
- Multiple Bullish Rounding Bottoms rejected at Resistance Zone neckline
- Price reversed multiple times and backed out by strong Resistance Zone since listed
- Breakout above Falling Resistance Trendline from ATH level seems well sustained for now
- Price Breakout only possible by continued Volumes increase and few days closure above Resistance Zone

ECLERX SKYROCKETS 35%! This Pattern Signals ₹4,200 TargetNSE:ECLERX SKYROCKETS 35%, Made a Beautiful Chart Structure to Qualify for the Chart of the Week
Price Action:
- It experienced a powerful rally from ₹2,200 to ₹3,877 (all-time high) between July and October 2024
- Recent correction formed a descending wedge pattern from October 2024 to early May 2025
- Currently showing an explosive breakout at ₹3,301.80, up ₹852.40 (+34.80%) in this Week.
- Massive single-week gain with a long bullish candle breaking above both resistance levels and the downtrend line
- The weekly chart shows a strong V-shaped recovery from support
Volume Analysis:
- This Week's volume at 2.28M shares vs. average of 420.79K (over 5x normal volume)
- Previous support bounces have also witnessed above-average volume
- Extremely high volume on today's breakout suggests significant institutional participation
- Volume pattern confirms the legitimacy of the price action
Key Support and Resistance:
- Strong support zone at ₹2,200-2,300 (green horizontal box) - tested and held multiple times over the past year
- Previous resistance now likely support at ₹3,200-3,250 (green horizontal line)
- Next resistance at all-time high of ₹3,877 (marked as "High")
- Downtrend line (white diagonal) now broken with conviction
Technical Patterns:
1. Descending Wedge Breakout- Classic bullish reversal pattern completed this week
2. Double Bottom*- Formed at ₹2,300 level in March-May 2025
3. Support Retest- Successfully retested the major support zone before the breakout
4. V-Shaped Recovery - Strong reversal indicating powerful buying interest
Trade Setup:
- Pattern: Descending wedge breakout with volume confirmation
- Confirmation: Explosive price action and volume expansion
- Context: Bullish reversal after testing major support zone
Entry Points:
1. Aggressive Entry: Current price (₹3,301.80) with partial position
2. Pullback Entry: On retest of breakout level ₹2,900-3,000
3. Confirmation Entry: On consolidation and holding above ₹3,200 for 2-3 sessions
Exit Strategy:
- Target 1: ₹3,600 (psychological resistance)
- Target 2: ₹3,877 (previous all-time high)
- Target 3: ₹4,200 (pattern projection based on measured move)
- Trailing Stop: 7% trailing stop after Target 1 is achieved
Stop Loss Placement:
- Aggressive Stop: ₹2,950 (below recent swing low)
- Conservative Stop: ₹2,800 (near the breakout point of the wedge)
- Pattern-Based Stop: ₹2,500 (invalidation level for the pattern)
Risk Management:
- Position sizing: Limit risk to 1-2% of trading capital
- Risk-reward ratio: Minimum 1:1.5 for aggressive entry, 1:2 for pullback entry
- Consider scaling approach:
* Enter 50% position now
* Add 25% on confirmation of trend (holding above ₹3,200)
* Add 25% on pullback (if it occurs)
- Take partial profits: 30% at Target 1, 30% at Target 2, hold remainder with trailing stop
NSE:ECLERX shows a powerful technical setup with its powerful breakout from a descending wedge pattern on record volume. The price action respects key technical levels, with the stock holding major support at ₹2,200-2,300 before staging today's massive rally. The breakout above both the wedge pattern and horizontal resistance, with 5x normal volume, suggests potential for continued upside momentum toward previous highs and beyond.
Keep in the Watchlist.
NO RECO. For Buy/Sell.
📌Thank you for exploring my idea! I hope you found it valuable.
🙏FOLLOW for more
👍BOOST if you found it useful.
✍️COMMENT below with your views.
Meanwhile, check out my other stock ideas on the right side until this trade is activated. I would love your feedback.
Disclaimer: "I am not a SEBI REGISTERED RESEARCH ANALYST AND INVESTMENT ADVISER."
This analysis is intended solely for informational and educational purposes and should not be interpreted as financial advice. It is advisable to consult a qualified financial advisor or conduct thorough research before making investment decisions.

ENVIRO INFRA ENGINEERS (NSE: ENVIRO)View: Strongly Bullish.
Bias: Trend reversal confirmed.
Strategy:
BUY: Initiate around ₹240-₹245 or on retest of ₹230-₹235.
Targets (T):
T1: ₹262
T2: ₹287
T3: ₹312
Stop-Loss (SL): ₹220 (on daily closing basis).
Reasoning:
Decisive breakout from a significant long-term descending trendline.
Strong volume confirming the breakout.
RSI indicating robust bullish momentum.
Potential for significant upside as stock recovers from prior fall.
Note: This is an educational analysis and not financial advice. Do your own due diligence before investing.

JSW Infra Stock is in momentum | Short TermJSW Stock trend line breakout
Price above 50 EMA
Stock is in momentum
Entry @226
SL 315
TG 360
If you are taking entry then should you take entry based on your financial adviser or by doing your own analysis.

SBICARD Stock Weekly Trendline Breakout | Momentum StockWeekly RSI Above 60
MACD Positive Cross Over
Price Above 50 EMA
Entry On Dips @780
SL 740, TG 920
If you take entry then do your own analysis.
