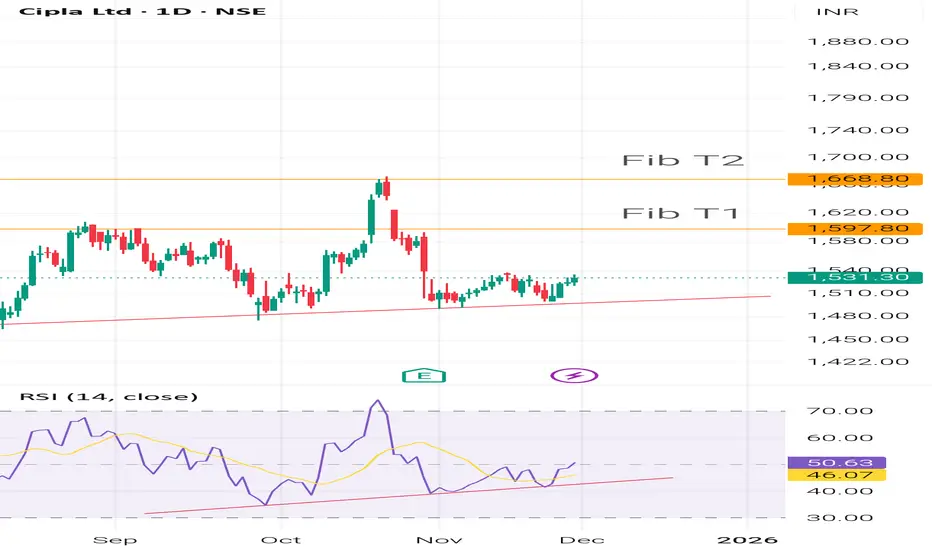
Potential Upside The Stock has potential upside for two reasons:
1. Stock is showing Uptrend with Higher lows and has taken support on trend line.
2. The Rsi of the stock is also supporting Uptrend.
The two targets can be set at the next Fibonacci Levels.
Trendlinesuport
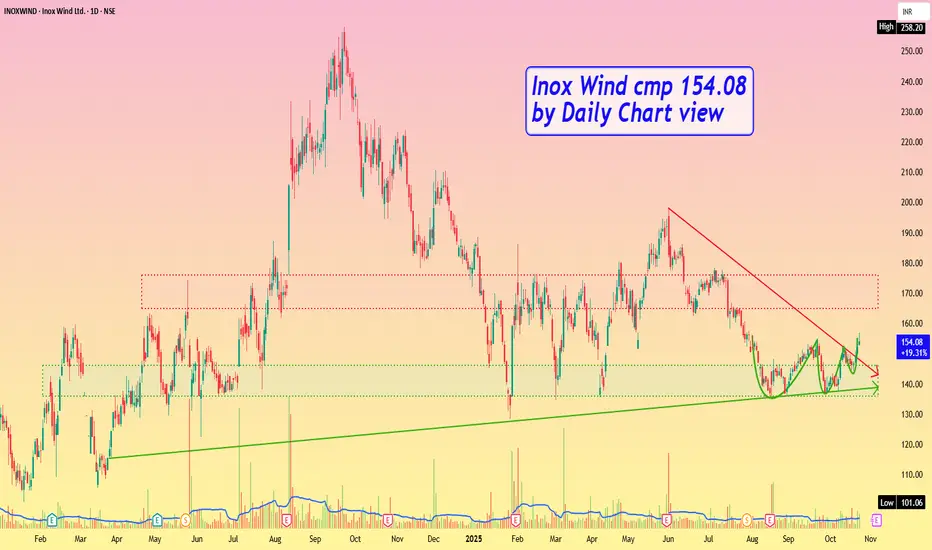
Inox Wind cmp 154.08 by Daily Chart viewInox Wind cmp 154.08 by Daily Chart view
- Support Zone 136 to 146 Price Band
- Resistance Zone 165 to 176 Price Band
- Volumes in good sync with avg traded quantity
- Falling Resistance Trendline Breakout seems sustained
- VCP pattern seems in making process by technical chart setup
Shakti Pumps cmp 856.65 by Daily Chart viewShakti Pumps cmp 856.65 by Daily Chart view
- Support Zone 775 to 805 Price Band
- Resistance Zone 885 to 920 Price Band
- Symmetrical Triangle Breakout attempted
- Intermittent Heavy Volumes surge seen by demand based buying
- Rising Price Trendline and Channel indicating slow and steady upside momentum
- Fresh upside may be foreseen, post Resistance Zone Breakout and sustained closure above it for few days

TTKPRESTIG Long IdeaTTKPRESTIG looks good for reversal. It is near Longterm trendline. RR is also good.
Stoploss and Targets are given. Trend becomes strong once it breaks Daily resistance shown in chart.
NOTE: No idea about Fundamentals. Just a technical take. Trade as per Risk Management Rules.

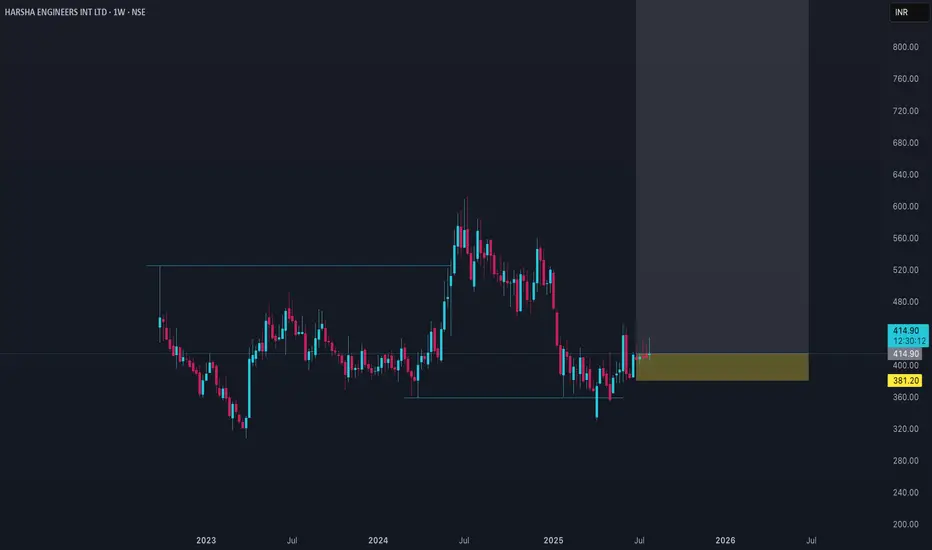
HARSHA Price ActionHarsha Engineers International Ltd is trading around ₹414 as of early August 2025. The stock has seen a modest increase of about 3% over the past six months but a significant decline of roughly 23% over the past year. The 52-week price range is wide, with a low near ₹330 and a high close to ₹584, indicating notable price volatility.
Valuation-wise, the stock trades at a price-to-earnings ratio around 35 and a price-to-book ratio near 0.33 to 3.1 depending on sources, reflecting mixed signals; the low book value multiple might suggest undervaluation relative to its assets, while the P/E suggests reasonable earnings expectations. The company has a market capitalization near ₹3,770 crore.
Financially, Harsha Engineers has delivered poor sales growth of under 10% over the past five years, which may have contributed to the recent price softness. Dividend announcements have been made recently, providing some income to shareholders. The stock’s mid-term outlook appears cautious with moderate price movement and valuation reflecting both risks from muted growth and some stability in fundamentals.
In summary, Harsha Engineers currently trades at a level indicating some undervaluation on a book value basis, but the stock price reflects concerns about slow growth and past volatility. Investors should weigh the company’s solid asset base against subdued sales growth and potential market fluctuations when considering the stock.
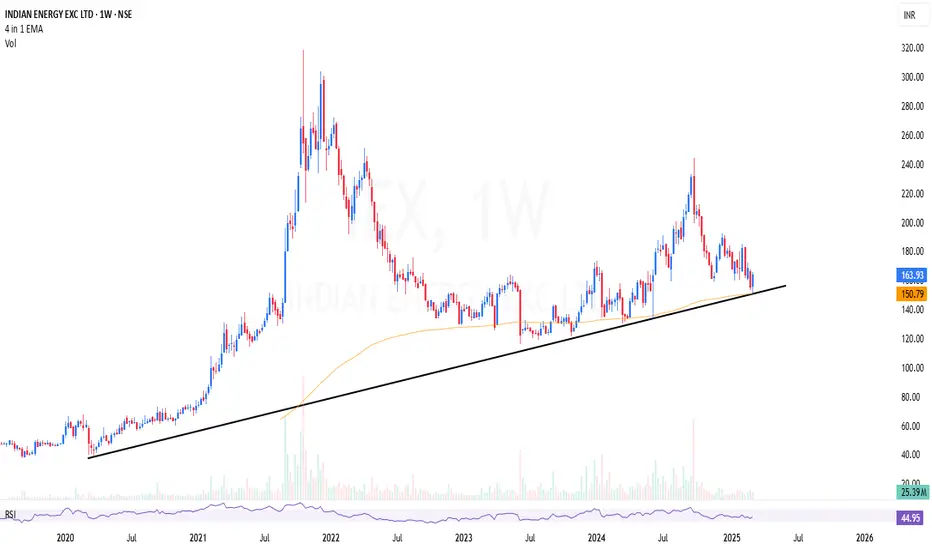
IEX | Looks fully bottomed out and signaling for reversalIEX | Looks fully bottomed out and signaling for reversal
Weekly long time trendline support + 200 EMA support
CMP : 163
RELIANCE ViewRELIANCE Chart Analysis
Monthly Chart shows it price is near trendline(TL) support. Need to watch what happens here.
Either Reverses from TL or falls upto 1000 monthly support.
RELIANCE at reversal Point + HDFCBANK at ATH BO retesting ---> Hope Nifty also moves higher.
Lets watch and see. Can trade in daily after reversal confirmation.
Note: No idea about Reliance fundamentals, anyway it is Bluechip stock.

BEML - Price at support line and Morning star formationPrice respect the black color trendline since May 2023 and it remains in 3700 for quite some time. Also, it forms morning star previous week in Weekly Timeframe. We can have stoploss at 3679 if it closes below that line in weekly timeframe.

IDFCfirst Bank CUP & Handle Breakout RetestHello Everyone,
HDFC First Bank making Retest from Cup & handle Chart pattern Breakout restest with trendline also taking Support of 200ema.
Fibbo 61% retracement completed and rsi oversold with making repeated pattern as earlier.Stock price cmp 66 is 34% down from lifetime high of 100.

VODAFONE IDEAHello & welcome to this analysis
In the monthly time frame its holding onto a rising trendline making a higher low & higher high pattern.
Failure to sustain above 8.50 could lead to further downside towards 7.25 - 5.75.
In the daily time frame its forming a divergence which requires it to sustain above 10.50.
Next big resistance at 12.50 then 14 and 16
Happy trading / investing

KOTAK MAHINDRA BANK - Breakout LongPrice consolidating since 2021 and it breakout the triangle now. Also, price rise from the black colour trendline which respected since 2014. Good Time to enter in this Large Cap.

STOCK FOR 15-20 PERCENT RETURNSStock is currently at the support zone and also on the trendline base.
The targets can be;
1.95
2.100
3.105
4.110
Can hold it for at least a month for the desired target.
DO NOT TRADE IF BREAKS THE TREND LINE
DISCLAIMER - Analyse yourself before investing.
HAPPY TRADING

Support At Trend Line - APTUS📊 Script: APTUS
📊 Sector: Finance
📊 Industry: Finance - Housing
Key highlights: 💡⚡
📈 Script has given breakout and now it is retesting and currently it is trading above trendline which is working as support level.
📈 One can go for Swing Trade.
⏱️ C.M.P 📑💰- 329
🟢 Target 🎯🏆 - 354
⚠️ Stoploss ☠️🚫 - 320
⚠️ Important: Always maintain your Risk & Reward Ratio.
✅Like and follow to never miss a new idea!✅
Disclaimer: I am not SEBI Registered Advisor. My posts are purely for training and educational purposes.
Eat🍜 Sleep😴 TradingView📈 Repeat 🔁
Happy learning with trading. Cheers!🥂

Long Term view on #RTNINDIAThe analysis is for Long term where in it is showing potentials of reaching triple digit in coming years. (5,10,15)
### Price Movements:
1. **Current Price and Trend:**
- The current price is \(84.41\) INR, up by \(11.56\) INR (+15.87%).
- The stock is in a strong upward trend, as evidenced by the ascending price channel.
2. **Price Channel:**
- The price is moving within an upward channel. This channel indicates a long-term bullish trend.
- The top of the channel projects potential future highs, while the bottom of the channel provides support levels.
- The target is taken on the basis of the flag pattern
### Indicators:
1. **Volume:**
- The volume is significant at \(168.569M\), indicating high trading activity.
- An increased volume during upward movements often confirms the strength of the trend.
2. **MACD (Moving Average Convergence Divergence):**
- The MACD line (blue) is above the signal line (orange), indicating bullish momentum.
- The histogram is positive, reinforcing the bullish sentiment.
- The MACD values are \(1.55\) (MACD line) and \(11.39\) (signal line), which suggests strong bullish momentum.
### Key Observations:
1. **Historical Performance:**
- The stock has shown significant growth over the past few years, particularly since early 2020.
- A major price surge can be seen around mid-2021.
2. **Support and Resistance:**
- Immediate support is around the \(50\) INR level, which is a previous consolidation area.
- Resistance levels can be projected using the upper boundary of the ascending channel, around the \(120\) INR mark in the near term.
3. **Price Projection:**
- The chart indicates a projected move to \(938.54\) INR, which is a very optimistic target (+1292.46%). This projection aligns with the upper boundary of the long-term price channel.
### Conclusion:
The technical indicators and the price channel suggest a continued bullish trend for RattanIndia Enterprises Limited. However, given the significant rise, it is essential to monitor for any signs of overbought conditions and potential pullbacks. The strong volume and positive momentum indicators support the potential for further growth, but investors should remain cautious and consider setting stop-loss orders to protect against sudden market reversals.

AYMSYNTEX - Breakout after 475+ days Detailed View about this Breakout:
No.of Resistance: 8
No.of Support: 8
Consolidation days : 475+ days
I Post educational chart for 3 Swing / Potential Stocks Everyday.
Check Related Ideas section for more Swing Stock analysis.

ARIHANTSUP - 400+ days ConsolidationDetailed View about this Breakout:
No.of Resistance: 8
No.of Support: 6
Consolidation Days: 400+ Days
I Post educational chart for 3 Swing / Potential Stocks Everyday.
Check Related Ideas section for more Swing Stock analysis.

SOBHA:TRENDLINE BREAKOUTNSE:SOBHA has given a breakout from trendline. 3 targets for the same are given.

ASALCBR - Breakout after 21 MonthsDetailed View about this Breakout:
No.of Resistance: 3
No.of Support: 3
Consolidation Days: 630+ Days
I Post educational chart for 3 Swing / Potential Stocks Everyday.
Check Related Ideas section for more Swing Stock analysis.

TOKYOPLAST - Breakout after 6 Years I Post educational chart for 3 Swing / Potential Stocks Everyday.
Check Related Ideas section for more Swing Stock analysis.

MPSLTD - Breakout after 625+ daysDetailed View about this Breakout:
No.of Resistance: 6
No.of Support: 6
Consolidation Days: 626+ Days
I Post educational chart for 3 Swing / Potential Stocks Everyday.
Check Related Ideas section for more Swing Stock analysis.

BANKNIFTY Price Action.* B-nifty is taking support of trendline.
* Class -A divergence seen on chart.
* HDFC bank also showing class -A divergence.
* There are good chances of up-move from here up to 45800.

JSW STEEL Price Action.JSW Steel is given breakout from triangle pattern as chart shows. Recently it was tested 773 level and reverted from support which is return move. Now it may test level 860 our previous target and next level 1010 soon.

IGPL - Breakout after 200+ daysDetailed View about this Breakout:
No.of Resistance: 3
No.of Support: 3
Consolidation Days: 200+ Days
I Post educational chart for 3 Swing / Potential Stocks Everyday.
Check Related Ideas section for more Swing Stock analysis.
