#NIFTY Intraday Support and Resistance Levels -05/08/2024Nifty will be gap down opening in today's session. After opening nifty start trading Below 24450 level and then possible downside rally up to 24330 in today's session. in case nifty trades Above 24500 level then the upside target can go up to the 24620 level.
Trendpattern

[INTRADAY] #BANKNIFTY PE & CE Levels(05/08/2024) Today will be gap down opening in BANKNIFTY. After opening if banknifty start trading below 50950 level then possible downside rally of 400-500 points upto 50550 Level & this rally can can extend another 400 points if market gives breakdown 50450 level in todays session.Any Major upside only expected in case banknifty starts trading above 50550 level.

GHCL : Descending Triangle Pattern Breakout with huge volumesGHCL breaking out from a triangle pattern breakout in a weekly timeframe with a decent buying volumes. It can rise upto the initial triangle pattern target 🎯 of 900.
🔰 I've indicated two scenarios of the stock to reach its target 🎯.
🟢 Range : 620-630
🎯 Target : 700 / 800 / 900
🛑 Stop : below 500 (wcb)
⚠️ Disclaimer : it's not a buy/sell advice, it's only a view on the stock for the educational purposes.

GLOBUS SPIRITS!!!!Globus Spirits is currently in an downward trend, but this stock has the potential to rebound fast.
This stock should be bought @750 as it shows an level for support.
If it still falls then stock should be AVG @660 as there is an strong support for the stock.
TARGET 1: 850
TARGET 2: 895
TRAGET 3: 960
.
please comment your views
.
NOTE: ELECTION PERIOD MATTERS!!!

#NIFTY Intraday Support and Resistance Levels -29/07/2024Nifty will be gap up opening in today's session. After opening nifty sustain above 24890 level and then possible upside rally up to 25010 level in today's session. in case nifty trades below 24830 level then the downside target can go up to the 24710 level.

Rising Wedge pattern breakout in METROPOLISMETROPOLIS HEALTHCARE LTD
Key highlights: 💡⚡
✅On 1 Day Time Frame Stock Showing Breakout of Rising Wedge Pattern.
✅Strong Bullish Candlestick Form on this timeframe.
✅It can give movement up to the Breakout target of 2410+.
✅Can Go Long in this Stock by placing a stop loss below 2034-.

#NIFTY Intraday Support and Resistance Levels -24/07/2024Nifty will be gap down opening in today's session. After opening nifty start trading Below 24450 level and then possible downside rally up to 24330 in today's session. in case nifty trades Above 24500 level then the upside target can go up to the 24620 level.

Descending Triangle pattern breakout in BALKRISINDBALKRISHNA INDUSTRIES LTD
Key highlights: 💡⚡
✅On 1 Hour Time Frame Stock Showing Breakout of Descending Triangle Pattern.
✅Strong Bullish Candlestick Form on this timeframe.
✅It can give movement up to the Breakout target of 3305+.
✅Can Go Long in this Stock by placing a stop loss below 3134-.

BUY TATA POWER!!!Tata power should be bought @415RS, as the stock is on the support.
for the TGT of @460RS.

[INTRADAY] #BANKNIFTY PE & CE Levels(22/07/2024) Today will be gap down opening in BANKNIFTY. After opening if banknifty start trading below 52450 level then possible downside rally of 400-500 points upto 52050 Level & this rally can can extend another 400 points if market gives breakdown 51950 level in todays session.Any Major upside only expected in case banknifty starts trading above 52550 level.

[INTRADAY] #BANKNIFTY PE & CE Levels(19/07/2024) Today will be gap up opening in BANKNIFTY. After opening if banknifty sustain above 52550 level then possible upside rally of 400-500 points upto 52950 level & this rally can extend another 400 points if market gives breakout 53050 level in todays session. Any Major downside only expected in case banknifty starts trading below 52450 level.

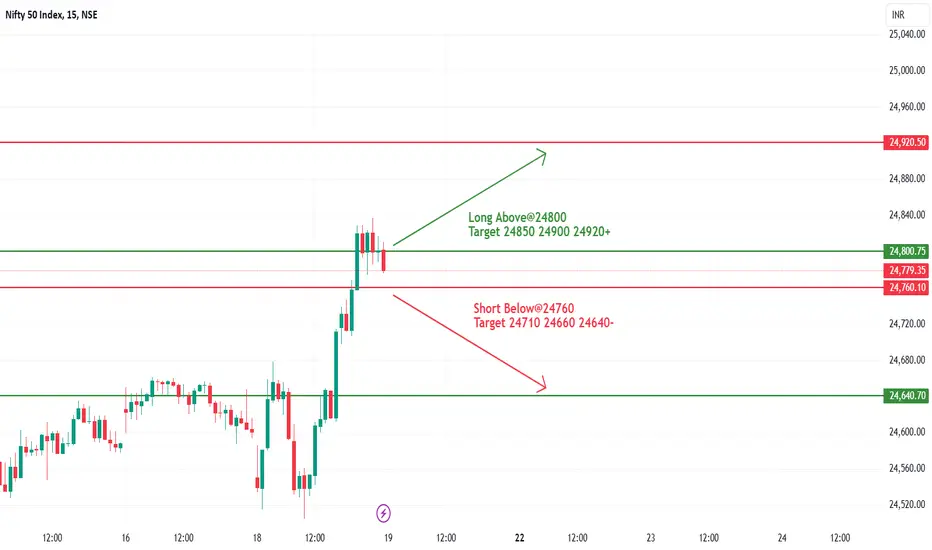
#NIFTY Intraday Support and Resistance Levels -19/07/2024Nifty will be gap up opening in today's session. After opening nifty sustain above 24800 level and then possible upside rally up to 24920 level in today's session. in case nifty trades below 24760 level then the downside target can go up to the 24640 level.
BTC looks BullishBitcoin is back in the uptrend crossing multiple Fib resistance. Latest $63,200 is a support now. RSI shows price cooling off, hence, there is ahuge chance we going to cross the FWB:65K in the next attempt in the nect 24-48 hours. Not just the 20 Moving Average but the trend line is also a support now. However MACD is showing a bit of bear movement but that is also fading off. With a little bit of jump MACD will come to support the price rise.

Symmetrical Triangle Pattern breakdown in RELIANCERELIANCE INDUSTRIES LTD
Key highlights: 💡⚡
✅On 1 Hour Time Frame Stock Showing Breakdown of Symmetrical Triangle Pattern .
✅Strong bearish Candlestick Form on this timeframe.
✅It can give movement up to the Breakdown target of 3064-.
✅Can Go short in this stock by placing a stop loss above 3196+.

Ascending Triangle pattern breakout in NAVINFLUORNAVIN FLUORIN INTERNATIONAL LTD
Key highlights: 💡⚡
✅On 1 Hour Time Frame Stock Showing Breakout of Ascending Triangle Pattern.
✅Strong Bullish Candlestick Form on this timeframe.
✅It can give movement up to the Breakout target of 3885+.
✅Can Go Long in this Stock by placing a stop loss below 3673-.

#NIFTY Intraday Support and Resistance Levels -16/07/2024Nifty will be gap up opening in today's session. After opening nifty sustain above 24600 level and then possible upside rally up to 24720 level in today's session. in case nifty trades below 24570 level then the downside target can go up to the 24450 level.

[INTRADAY] #BANKNIFTY PE & CE Levels(16/07/2024) Today will be gap up opening in BANKNIFTY. After opening if banknifty sustain above 52550 level then possible upside rally of 400-500 points upto 52950 level in todays session. Any Major downside only expected in case banknifty starts trading below 52450 level.

Symmetrical Triangle pattern breakout in MUFTICREDO BRANDS MARKETING PVT LTD
Key highlights: 💡⚡
✅On 1 Day Time Frame Stock Showing Breakout of Symmetrical Triangle Pattern.
✅Strong Bullish Candlestick Form on this timeframe.
✅It can give movement up to the Breakout target of 200+.
✅Can Go Long in this Stock by placing a stop loss below 165-.

Rising Wedge Pattern breakdown in HDFCAMCHDFC ASSET MANAGEMENT COMPANY LTD
Key highlights: 💡⚡
✅On 2 Hour Time Frame Stock Showing Breakdown of Rising Wedge Pattern .
✅Strong bearish Candlestick Form on this timeframe.
✅It can give movement up to the Breakdown target of 3654-.
✅Can Go short in this stock by placing a stop loss above 4317+.

CDLS SupportVolume seems decreasing after a heavy up volume. Current price is at the short term support level. If this level broken then price may go down further.
As volume is going down, there are chances then bulls must concur this stock soon.
Happy trading. ;)

Falling Wedge pattern breakout in BALKRISINDBALKRISHNA INDUSTRIES LTD
Key highlights: 💡⚡
✅On 1 Hour Time Frame Stock Showing Breakout of Falling Wedge Pattern.
✅Strong Bullish Candlestick Form on this timeframe.
✅It can give movement up to the Breakout target of 3360+.
✅Can Go Long in this Stock by placing a stop loss below 3147-.

Head & Shoulder pattern breakout in PARKHOTELPARK HOTELS LTD
Key highlights: 💡⚡
✅On 1 Day Time Frame Stock Showing Breakout of Head & Shoulder Pattern.
✅Strong Bullish Candlestick Form on this timeframe.
✅It can give movement up to the Breakout target of 240+.
✅Can Go Long in this Stock by placing a stop loss below 179-.

Reversal Downtrend Broadening Wedge pattern in M_MFINMAHINDRA & MAHINDRA FINANCE
Key highlights: 💡⚡
📈 On 1 Hour Time Frame Stock Showing Reversal of Downtrend Broadening Wedge Pattern.
📈 It can give movement upto the Reversal Final target of Above 306+.
📈 There have chances of breakout of Resistance level too.
📈 Can Go Long in this stock by placing a stop loss Below 295-.
