IPCA Labs – Trend Reversal After Long ConsolidationNSE:IPCALAB has successfully transitioned from a downtrend into a bullish structure after months of sideways consolidation. The breakout above the falling trendline followed by a controlled pullback suggests accumulation.
As long as price holds above ₹1450, the trend remains positive and a fresh breakout above ₹1500 can open the door for further upside.
Trendreversal

Kitex (W): Aggressive Bullish, Political Catalyst + Tech Rev(Timeframe: Weekly | Scale: Logarithmic)
The stock has staged a V-Shape Reversal from a fresh 52-week low, forming a textbook Bullish Hammer on the weekly chart. This technical move is powered by a major political development (joining NDA), which removes significant "Political Risk" from the stock valuation.
🚀 1. The Fundamental Catalyst (The "Why")
The technical bounce is driven by a sentiment shift:
> Political Alignment (NDA Entry): The market expects that joining the ruling alliance will fast-track the company’s massive expansion plans in Telangana and reduce friction in its home state of Kerala.
> Valuation Comfort: At ₹138 (the low), the stock was trading at attractive valuations, prompting value buying in the textile sector which is seeing a revival.
📈 2. The Chart Structure (The Bear Trap)
> The Support: ₹147 the support.
- Refinement: The price momentarily broke this support to hit ₹138.20 (on Jan 21), triggering stop-losses, before skyrocketing back up. This indicates a "Bear Trap" or "Spring" formation, where smart money buys the panic selling.
> The Pattern: The Weekly Hammer has a very long lower shadow, indicating that sellers pushed price down, but buyers overwhelmed them to close the week near the high.
📊 3. Volume & Indicators
> Volume Spike: The 12.43 Million volume is an "Ignition Bar." It is significantly higher than the 10-week average.
> RSI: RSI reversing from the "Oversold" zone (below 30 on daily, rising on weekly) is a classic momentum divergence signal.
🎯 4. Future Scenarios & Key Levels
The stock has cleared the "Panic Bottom."
🐂 Bullish Targets (The Recovery):
- Target 1: ₹200. .
- Target 2: ₹295 - ₹298.
- Blue Sky: If the political tailwinds persist, a breakout above ₹324 (ATH) is possible in the long term.
🛡️ Support (The "Line in the Sand"):
- Immediate Support: ₹147 – ₹150. The previous support level is now reclaimed.
- Stop Loss: A close below ₹135 (below the Hammer's wick) would invalidate the reversal.
Conclusion
This is a High-Conviction Turnaround.
> Refinement: The "Hammer" is valid, but the Fundamental News (NDA) is what makes this a sustainable trend rather than a dead-cat bounce.
> Strategy: The reversal is confirmed. Use dips to accumulate.

Inox Wind | Potential Reversal from 200 EMA Support (Study)Inox Wind is currently trading near its 200 EMA, which is acting as a strong long-term support zone on the weekly chart.
Key observations:
Price is respecting 200 EMA support
Formation of a falling trendline — breakout above it can change structure
Selling pressure looks exhausted near support
Risk–reward looks favorable at current levels
If price holds above the 200 EMA and shows confirmation, this could lead to a trend reversal with opportunities for short-term to long-term upside.
Levels to Watch
📍 Support: 200 EMA zone
📈 Immediate Resistance: Trendline breakout area
🎯 Upside Targets (if breakout sustains):
₹158
₹199
₹257 (long-term view)
Note / Disclaimer
⚠️ This is only a technical study, not a buy or sell recommendation.
Please do your own research and manage risk properly.

Crompton Greaves Falling?Technical (upgrade)
Crompton Greaves Consumer Electricals has been sliding inside a falling wedge, but price is trying to base around ₹248-252 (teal support on your chart). A daily close above ~₹260–262 (wedge top/near-term trendline) would confirm a breakout and set up a move toward ₹275 first and ₹300 next If price fails and closes back below ₹248, treat it as a false start and expect the downtrend to resume keep risk tight in that zone.
Fundamentals (quick, clean)
Latest print showed mixed trends—Q2 FY26 consolidated revenue ~₹1,915.6 cr, PAT ~₹75.4 cr, with margin pressure; the quarter also carried an exceptional ₹20.36 cr charge for the Vadodara plant restructuring. Butterfly (kitchen appliances) grew double‑digits YoY and lighting rose ~3% YoY, partly offsetting weakness in electric consumer durables. The company fully repaid its ₹300 cr NCDs in Jul‑2025 and said it is net‑cash/zero‑debt, which is a positive for flexibility. Valuation and efficiency are mid‑pack for consumer durables (P/E ~34–35; P/B ~4.3–4.9; ROE ~13–15%; ROCE ~15–19%). Net‑net: fundamentals are stable but margins need rebuilding—if your chart gets the ₹260–₹262 breakout, technicals can align with a gradual recovery story.
Like, comment your thoughts, and share this post
Explore more stock ideas on the right hand side your feedback means a lot to me!
Disclaimer: This post is for educational purposes only and should not be considered a buy/sell recommendation.

Kaynes tech (W): Bullish - V-Shape Recovery from Panic BottomTimeframe: Weekly | Scale: Logarithmic
The stock is staging a classic reversal from the bottom of its 6-month consolidation range. The recent panic drop was absorbed by "smart money," as evidenced by the massive volume Hammer candle.
📉 1. The Context (The Panic & Absorption)
> The Trigger: The sharp drop to ₹3,745 in early December was triggered by a brokerage note raising concerns about disclosures.
> The Absorption (The Hammer):
- Price Action: The stock plunged to a low of ₹3,712 but rallied sharply to close near ₹4,265 . This created the long lower wick (Hammer).
- Volume (61 Million): This massive volume confirms that while retail investors panic-sold, institutional buyers stepped in to buy the dip at the valuation floor. This is Climax Volume.
🕯️ 2. Current Price Action (The Pause)
> This Week's Candle: The "Neutral Bearish" candle (Spinning Top/Doji) with lower volume ( 15.06 Million ).
- Interpretation: After the violent volatility of the previous week, this "quiet" week is positive. It shows that the selling pressure has evaporated (volume dropped from 61M to 15M), and the price is stabilizing above ₹4,100 .
📊 3. Technical Indicators
> RSI Divergence: RSI rising from oversold territory confirms the momentum shift.
> Range Play: The stock is strictly following the ₹3,745 (Support) – ₹7,800 (Resistance) box. Trading at the bottom of the box offers the highest Risk:Reward ratio.
🎯 4. Future Scenarios & Trade Setup
The strategy is a classic "Range Trade."
> 🐂 Bullish Case (The Journey to Top):
- Trigger: A breakout above this week's high ( ~₹4,390 ).
- Target 1: ₹5,500 (Mid-range resistance).
- Target 2: ₹7,822 (The ATH). A move from support to resistance represents a ~100%+ potential gain .
>🛡️ Support (The Stop Loss):
- Critical Stop: ₹3,700 . The low of the Hammer candle is the "Line in the Sand." If the price breaks this, the "absorption" thesis fails.
Conclusion
This is a High-Conviction Setup . The Hammer on Climax Volume at major support is one of the most reliable signals in technical analysis.
> Refined View: The "Panic" is over. The "Accumulation" is done. The stock is now likely to drift upwards as the governance fears fade and the focus shifts back to its Semiconductor expansion plans.

Praj Ind (D): Aggressive Bullish Rev, Value Buy at Major SupportTimeframe: Daily | Scale: Linear
After a brutal 11-month downtrend, the stock has staged a violent "V-shaped" recovery from a 4-year historical support zone. This move is backed by the highest volume in months, signaling a potential trend change or a significant relief rally.
🚀 1. The "Why" (Catalyst for the 13%+ Surge)
The massive volume surge is likely driven by Value Buying and Short Covering :
- Historical Support: The stock hit ₹292 , a level not seen since mid-2022. Smart money often accumulates fundamentally sound companies at such multi-year structural supports.
- Oversold Conditions: After falling ~66%, the stock was deeply oversold. The removal of ethanol production caps for the 2025-26 supply year (fundamental tailwind) is finally being priced in.
📈 2. The Technical Structure
> The Floor (292-300): This is the "Line in the Sand." The stock tested this zone on Dec 9 and formed a base.
> The Ignition: The surge since yesterday (Dec 15) acts as an "Ignition Bar."
- Volume: 41.48 Million . This is not retail participation; this is institutional accumulation.
- Momentum: Rising ~14% in a short span confirms that the "bears are trapped."
📊 3. Indicators
- EMAs: The short-term EMAs (like 20-day) are yet to confirm a Positive Crossover because the move is so sharp. However, the price has decisively reclaimed the 20-day EMA , which is the first step.
- RSI: The rising RSI from oversold territory confirms momentum is shifting from bearish to bullish.
🎯 4. Future Scenarios & Key Levels
The primary challenge now is to sustain this vertical move.
> 🐂 Bullish Case (Continuation):
- Immediate Resistance: ₹369 . This is the previous breakdown level.
- Target: ₹427 . If ₹369 is cleared, the stock has an open path to ₹427 (which aligns with the 200-day EMA or major Fibonacci level).
> 🛡️ Support (The "Higher Low"):
- Immediate Support: ₹315 – ₹320 . In a healthy uptrend, the stock should not fall back to ₹292. Any pullback should ideally hold above ₹315 to form a "Higher Low" structure.
Conclusion
This is a classic "Dead Cat Bounce" turning into a Reversal . The volume confirms validity. The trade is now to buy on dips near ₹320 , targeting ₹369 and ₹427 . Avoid chasing the vertical rally; wait for a small cooling off.

Asian Paints #Screener — Trend Reversal Before The Crowd Asian Paints Ltd (NSE: ASIANPAINT) has given a strong breakout from a long-term descending trendline with a sharp momentum candle.
This move signals a trend reversal after months of consolidation and price compression — supported by solid weekly volume.
Chart Structure #Screener
📌 Breakout from descending trendline
📌 Volume surge confirming buyer interest
📌 Price holding above 50 EMA on weekly
📌 Formation of higher lows since early 2025
📌 Strong bullish candle closing above key supply zone
Key Levels
Resistance Zone: ₹2880 – ₹3130
Support Zone: ₹2640 – ₹2720
Major Support: ₹2490 (structure base)
As long as price stays above ₹2640, trend bias remains bullish ✅
View
This setup represents a trend shift, not just a breakout — aligning with strength returning in large-cap sectors.
A healthy retest or consolidation above ₹2700 zone could provide follow-through opportunities.
Technical Snapshot
✅ Trendline breakout confirmation
✅ Volume expansion + wide-range candle
✅ Higher-low formation
✅ Momentum shift to buyers
✅ Mid-to-large cap stock showing leadership recovery
📒 Educational analysis only — not investment advice.

Adani Green (D): Surges 10.79% But Fails at Key ResistanceAfter being in a downtrend since June 2024, Adani Green is showing clear signs of a potential trend reversal. Since March 2025, the stock has been building a bullish base by forming a constructive pattern of Higher Lows . However, this new uptrend is now facing its most significant test.
Today's Battle at Resistance
The stock's upward progress has been blocked by a major horizontal resistance trendline . Today's session (Wednesday, October 29, 2025) saw a powerful attempt to break this level:
- The stock surged by an impressive +10.79% .
- This move was backed by a very strong volume of 36.23 million shares .
Critically, despite the significant buying pressure, the stock was unable to close above this key resistance level , indicating that sellers are still actively defending this zone.
A Mixed Technical Picture
The technical indicators paint a picture of a new uptrend that is still fighting to confirm itself:
- Bullish Signals:
- The RSI (Relative Strength Index) is in a rising trend across the Monthly, Weekly, and Daily timeframes.
- A long-term SMA Golden Crossover has been in effect for the past month.
- Lagging/Cautionary Signals:
- The short-term EMAs have not yet formed a bullish Positive Crossover (PCO) state on the Daily and Monthly charts. This suggests the new uptrend is still in its early and unconfirmed stages.
Outlook and Key Levels to Watch
The stock is at a classic "prove it" moment. The battle at this horizontal resistance is the key.
- Bullish Scenario: A decisive, high-volume close above the resistance trendline is required to confirm the breakout and validate the new uptrend. If this occurs, the path could open for a move toward the *₹1,445 level.
- Bearish Scenario: If today's move was a "bull trap" and momentum fades, a rejection from this level could send the stock back to test its recent support, with a potential downside to ₹995 .
Given that the stock is attempting to reverse a significant downtrend, this resistance is a major hurdle. Caution is warranted until a successful breakout is confirmed with a strong daily close above the line.

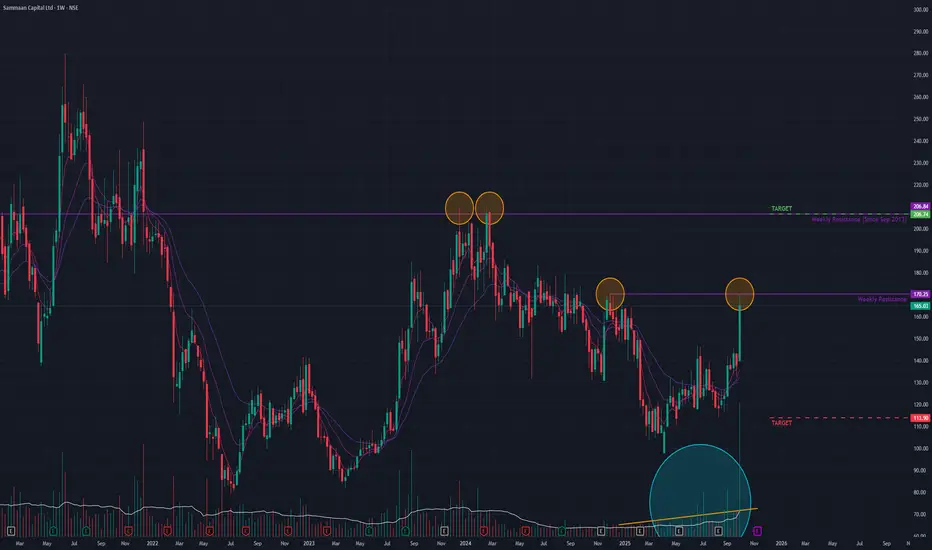
Sammaan Cap (W) - Poised for a Potential BreakoutAfter a prolonged downtrend that began in August 2018, Sammaan Capital transitioned into a sideways consolidation phase starting in March 2020.
Recently, the stock has shown significant bullish intent. Last week, it surged by +19.74% , accompanied by an exceptionally high volume spike of 462.74 million shares . This powerful move brought the price to the brink of breaking out from a key short-term resistance trendline.
Several technical indicators support a bullish outlook:
- Moving Averages: The short-term Exponential Moving Averages (EMAs) are in a state of positive crossover on both the monthly and weekly timeframes.
- Momentum: The Relative Strength Index (RSI) has also registered a positive crossover on both timeframes, signaling strong upward momentum.
- Volume: A steady increase in average volume suggests growing buyer interest.
Future Outlook:
The stock's direction hinges on its ability to overcome the immediate resistance.
- Bullish Scenario: If the current momentum is sustained and the stock achieves a decisive breakout with strong volume, the next potential target is the 205 level.
- Bearish Scenario: Conversely, a failure to breach this resistance could lead to a loss of momentum, potentially pulling the price back towards the 112 support level.
The price action in the coming week will be crucial in confirming the stock's next directional move.
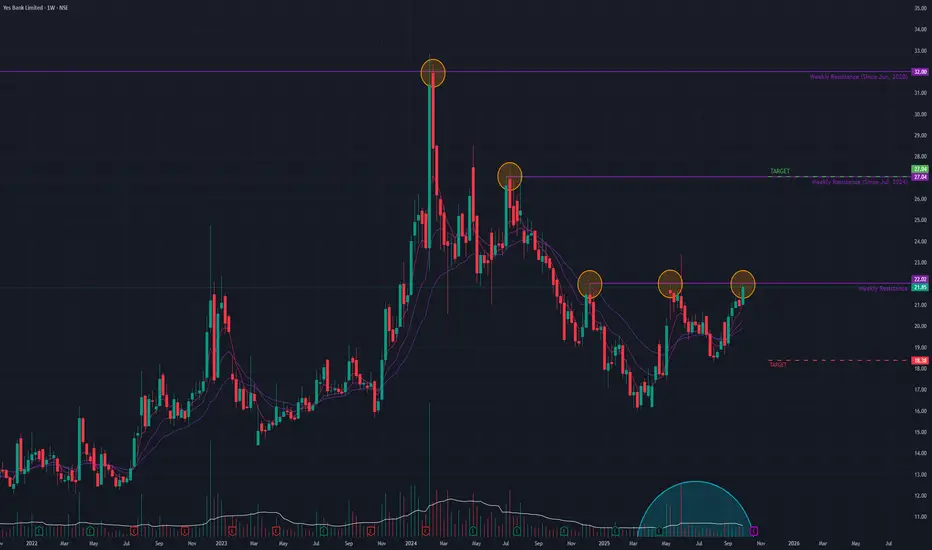
Yes Bank (W) - Challenges Key Resistance in Potential Trend RevYes Bank is showing signs of a potential trend reversal after being locked in a multi-year sideways consolidation since June 2020. Last week, the stock gained +4.2% on the back of a massive volume surge , indicating a significant increase in buyer interest.
The stock is now positioned directly below a critical horizontal resistance trendline . A decisive breakout above this level is required to confirm a shift from its long-term consolidation phase into a new uptrend.
Strong Long-Term Bullish Signals 👍
The potential for a reversal is supported by positive signals on higher timeframes:
- Monthly & Weekly Momentum: Short-term Exponential Moving Averages (EMAs) are in a bullish crossover state on both the monthly and weekly charts.
- Confirmed Strength: The Relative Strength Index (RSI) is also rising on both the monthly and weekly timeframes, confirming strong underlying momentum.
Outlook: A Breakout Awaits
The stock is at a crucial make-or-break point. While the long-term indicators are bullish, overcoming the overhead resistance is essential.
- Bullish Case 📈: If the current momentum is sustained and the stock achieves a decisive breakout, the next potential target is the ₹27 level.
- Bearish Case 📉: If the resistance holds and the momentum fades, the stock could pull back to find support near the ₹18 level.
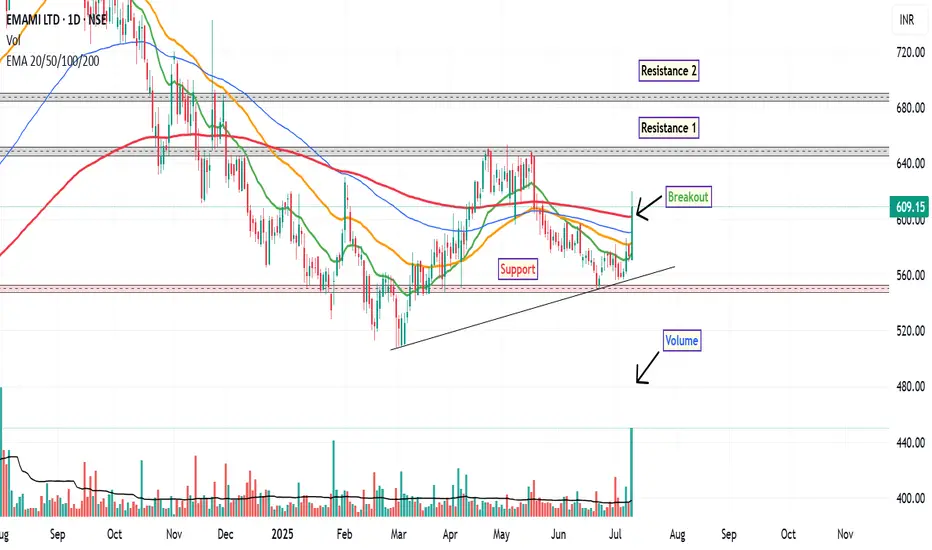
EMAMI: Technical Outlook UpdateFollowing a prolonged downtrend that began in September 2024, EMAMI Ltd. has recently exhibited signs of a potential short-term trend reversal on the daily chart. The stock has demonstrated a notable uptick in momentum, marked by several key technical developments.
The stock has decisively moved above its 200-day EMA, a level often regarded as a long-term trend indicator. This breakout was accompanied by a significant increase in trading volume—approximately 5 times the average volume of the 50-day moving average, suggesting heightened market participation. The RSI has crossed above the 60 level, indicating strengthening bullish momentum, though it is approaching the overbought zone.
A bullish crossover in the MACD was observed, further supporting the case for near-term strength.
Around ₹600, where the stock is currently consolidating post-breakout. First resistance near ₹650, Second resistance around ₹690. A technical stop-loss could be considered below ₹548, aligning with recent swing lows and support levels.
Disclaimer: This analysis is intended solely for educational and informational purposes. It does not constitute investment advice or a recommendation to buy or sell any financial instrument. Market participants are encouraged to conduct their own research or consult with a qualified financial advisor before making any trading decisions.
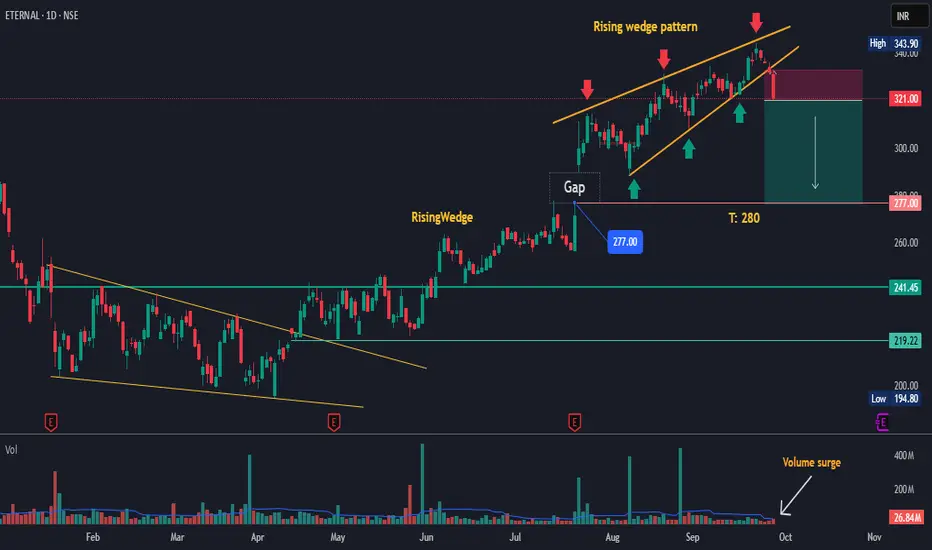
ETERNAL – Rising Wedge Breakdown Setup | Target: 280The stock has formed a Rising Wedge pattern after a strong rally, with multiple rejections from the upper trendline (marked by red arrows). previous price action shows weakness near the resistance zone, indicating a potential breakdown.
🔹 Key Highlights:
Rising Wedge Pattern visible on the daily chart – a bearish reversal setup.
Volume surge in recent sessions signals distribution at higher levels.
Gap Support at 277 – likely to be tested once breakdown confirms.
Immediate Target: 280, aligning with horizontal support.
Risk-to-Reward favored on the short side as price rejects resistance.
🔻 Breakdown Confirmation:
277 (Gap level)
241.45
219.22
This setup offers a clean technical short opportunity if downside momentum continues. Suitable for traders looking to capitalize on wedge breakdowns with volume confirmation.
Disclaimer : Risk management is crucial in this volatile market, so keep position sizing appropriate. This analysis is intended for educational purposes and not financial advice.
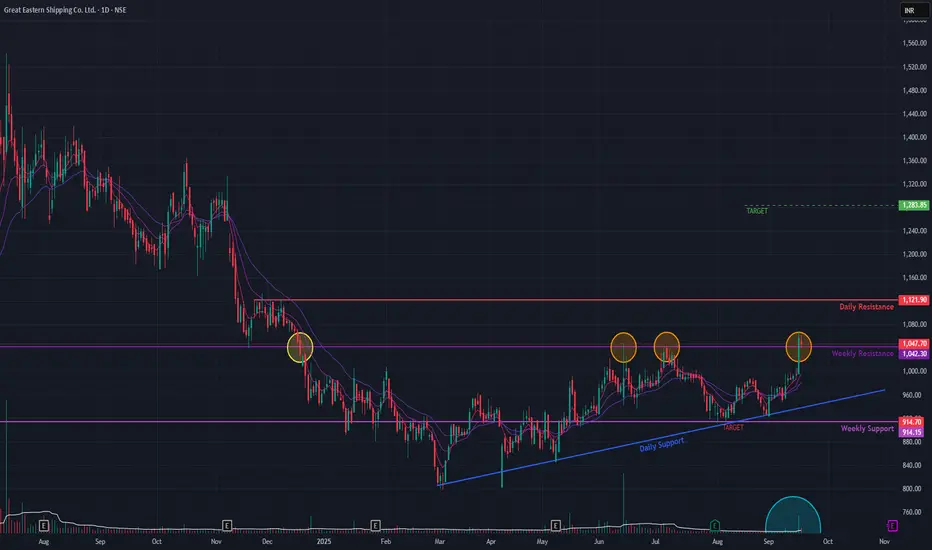
GE Shipping (Daily Timeframe) - Potential Breakout ??GE Shipping has broken out from a critical, long-term resistance level originating from December 2023. The stock is showing strong bullish momentum, confirmed by multiple technical signals.
Key Observations:
Pattern: A double-bottom in April 2025 ended the prior downtrend, leading to a period of consolidation.
Breakout: On Sep 16, 2025, the stock decisively broke above the resistance on high volume.
Confirmation: The breakout was confirmed on Sep 17, as the old resistance successfully held as new support.
Indicators: Bullish EMA crossovers and sustained above-average volume support the move.
Price Outlook :
Upside Target: ₹1283 if the price remains above the breakout level.
Downside Risk: A failure to hold this new support could lead to a decline towards the ₹914 level.
How to read market TOPS like a pro : Double & Triple TopsIn this video I will breakdown about the concepts of Double and triple tops, they aren’t just reversal signals — they’re blueprints of future price action. Here’s how to read market tops like a pro and anticipate what comes next.

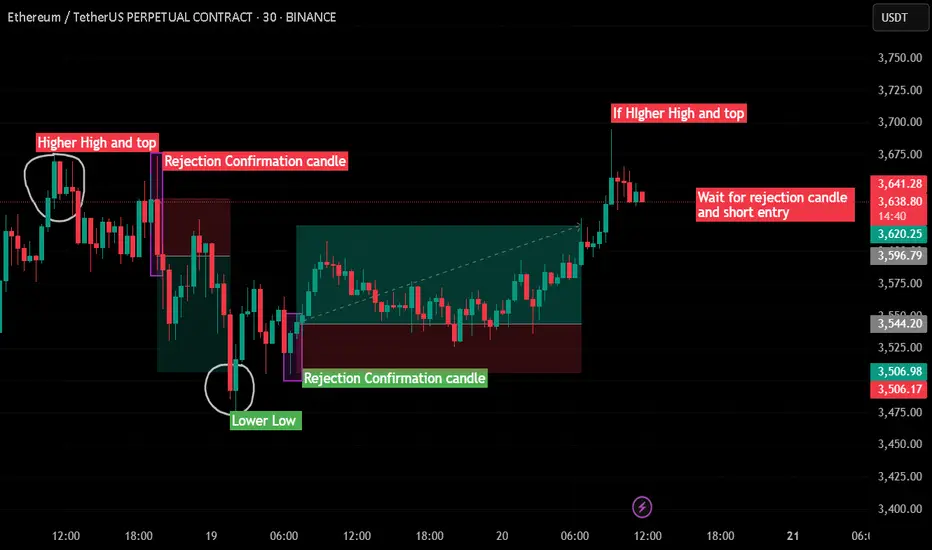
Trend Reversal Rejection Strategy | Higher High + Candle Confirm🔍 Idea Summary:
This strategy focuses on identifying trend reversal zones using classic Higher High (HH) and Lower Low (LL) structures followed by rejection confirmation candles.
🔻 Short Setup:
Price forms a Higher High.
Wait for a rejection candle (long wick, body closes inside previous range).
Confirm structure break and take short entry on confirmation.
✅ Example: On the left side of the chart, price printed a HH, followed by a strong rejection candle. That led to a clean move downward.
🔺 Long Setup:
Price forms a Lower Low.
Watch for a rejection candle near key support.
Enter long trade after confirmation.
✅ Example: Mid-chart shows price breaking to LL, then instantly rejecting with a strong bullish candle. Followed by a sustained move up.
🔴 Current Price Action:
Price is testing a potential new Higher High.
📌 Strategy suggests: Wait for a bearish rejection candle before shorting!
📈 Strategy Benefits:
Avoids impulsive entries
Combines structure with candle logic
Great for reversal traders and range scalpers
🔥 Like & follow for more real-time trading ideas!
💬 Drop your thoughts or questions below – let’s grow together, traders! 💪
#ETHUSDT #PriceAction #RejectionCandle #TrendReversal #SupportResistance #Scalping #TradingStrategy #Crypto #ChartPatterns #TechnicalAnalysis
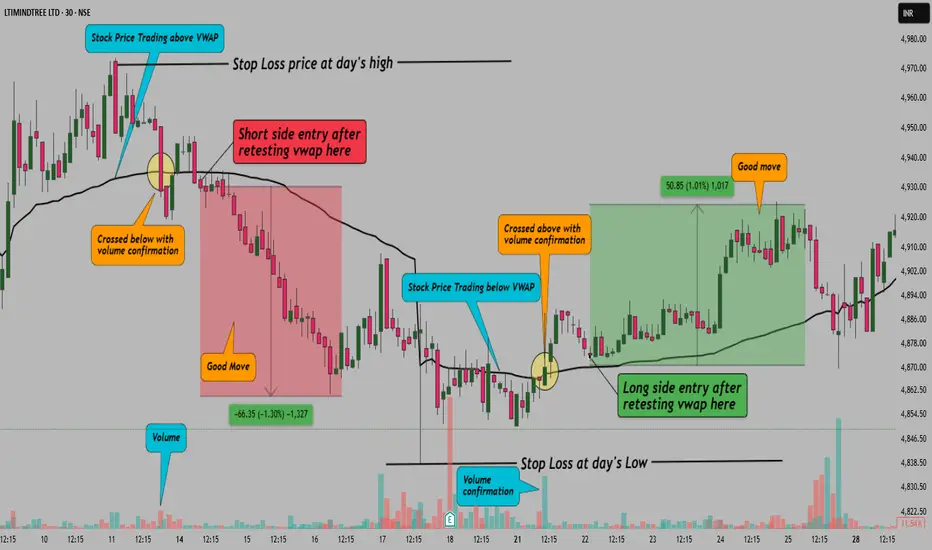
VWAP Flip Strategy–Most Accurate Setup for Intraday Trend Shift!Hello Traders!
One of the cleanest signs of intraday trend shift happens right at the VWAP — the volume-weighted average price. Most traders use VWAP as a trend guide, but they miss one powerful signal called the VWAP Flip .
When price flips from staying below VWAP to breaking above and holding — or vice versa — it often marks the start of a fresh trend. And if volume supports the move, the accuracy becomes even stronger.
What is the VWAP Flip?
It’s when price has been consistently staying on one side of VWAP, and then crosses over with conviction and starts respecting the other side.
For example, if price was trading below VWAP all morning and then breaks above with a solid candle, retests, and holds — that’s a bullish VWAP flip.
Why This Strategy Works
VWAP reflects average trader sentiment: When price flips above, it shows buyers are gaining strength
It filters false breakouts: Flip + retest helps avoid fake moves during sideways markets
Volume confirms conviction: A flip with increasing volume shows strong intent behind the shift
How to Trade the VWAP Flip
Step 1: Identify whether price is respecting VWAP from one side
Step 2: Wait for price to flip — clean break and candle close on opposite side
Step 3: Look for a retest of VWAP. Entry should be near VWAP with small stop loss
Step 4: Exit at previous day’s high/low or next support/resistance zone
Entry + SL + Target (Example Setup):
Entry: On candle close and retest above VWAP
Stop Loss: Below retest candle low
Targets: 1:2 RR minimum or trail till trend continues
Note:
This setup has been identified using the 5-minute timeframe, as it offers better intraday structure for the VWAP Flip strategy. However, since TradingView does not allow drawings below 15-minute timeframe for sharing or publishing, I initially marked the levels and structure on the 5-minute chart, took a screenshot, and then placed it over the 30-minute chart for visual representation.
Rahul Tip:
Use VWAP Flip only in trending environments. Avoid it in flat days. Combine it with 5 EMA or volume spikes for extra confirmation. Also, mark high-impact news times to avoid random flips.
Conclusion:
VWAP Flip is one of the cleanest, low-risk, high-reward intraday setups when used with proper structure and confirmation. Practice spotting it in real time — and it might become your new favorite setup.
Have you used VWAP Flip before? Let me know your win rate or drop a chart example in comments.
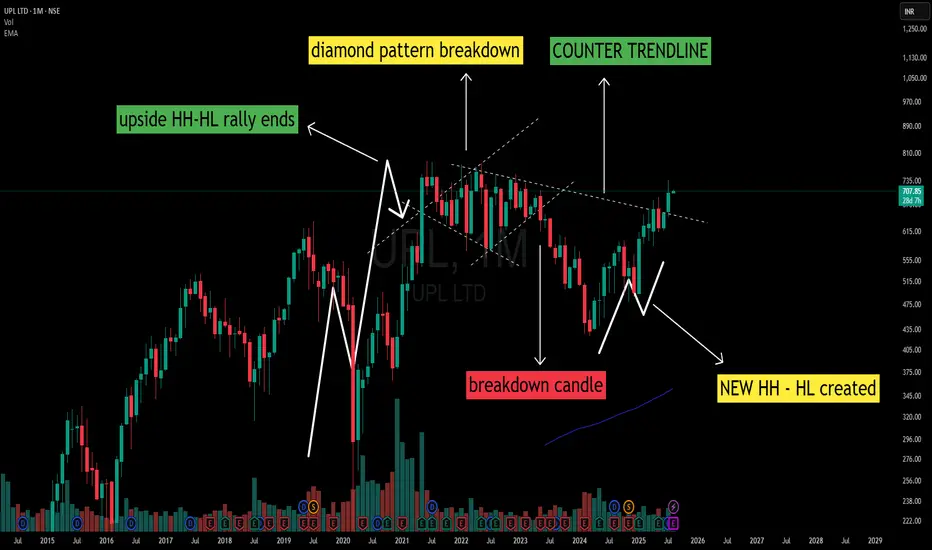
UPL – Diamond Pattern Breakdown to W-Bottom Reversal The monthly chart of UPL reflects a complete structural cycle:
1️⃣ Uptrend Phase:
A clear sequence of Higher Highs – Higher Lows (HH-HL) marked the early rally.
2️⃣ Diamond Pattern at Peak:
A diamond-shaped consolidation developed at the top of the rally, a common occurrence near trend maturity.
3️⃣ Breakdown & Downtrend:
A breakdown candle from the diamond pattern initiated a period of Lower Highs – Lower Lows (LH-LL), establishing a sustained downtrend.
4️⃣ W-Bottom Formation:
At the lower structure, a W-bottom emerged with Higher Low formation followed by a Higher High, indicating a structural shift.
5️⃣ Counter Trendline Interaction:
The earlier diamond pattern boundary has evolved into a counter trendline, now serving as an important structural reference zone.
📌 Observation:
The counter trendline remains a key structural reference on higher timeframes. This is a technical observation and not a directional view.
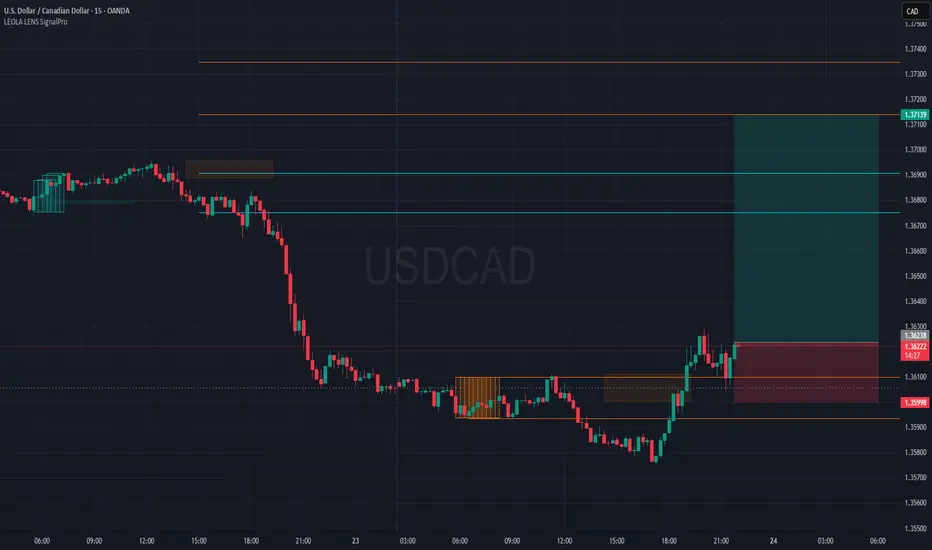
USDCAD Bullish Setup-Shift from Accumulation to ExpansionPrice has broken above recent accumulation range marked by Liquidity Control Boxes.
SignalPro long setup activated with:
🔶 Smart accumulation zone breakout
🔁 Minor retest at 1.361 area holding
🎯 Targeting upper liquidity levels around 1.37139
Price structure shows a bullish microtrend reversal with risk capped below last demand block.
Key Elements on Chart:
📦 Leola Lens SignalPro's control zones provided context for consolidation and breakout
📈 Breakout aims toward untested supply zones above
⏳ Timeframe: 15-min
🧠 Educational Use Only – No financial advice.
Tool used: Leola Lens SignalPro
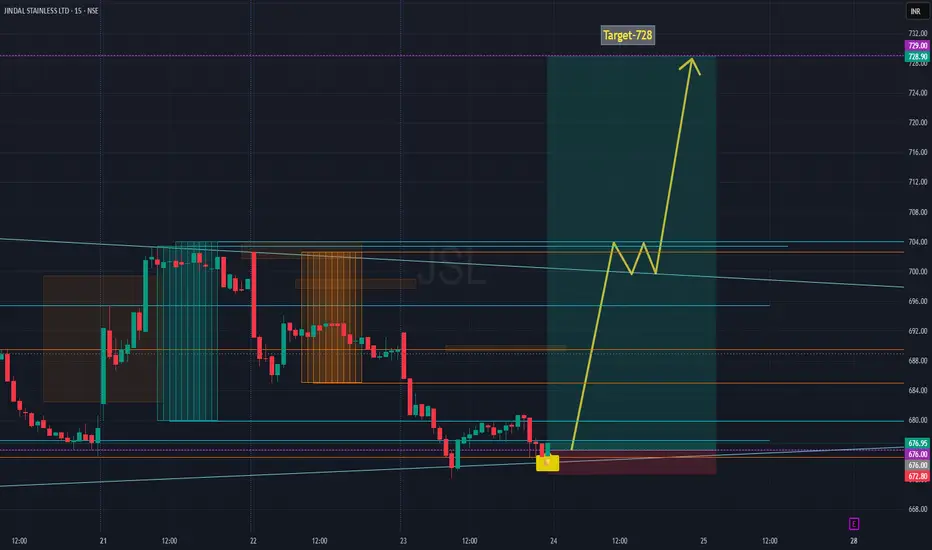
JSL Reversal Zone Identified -Path to 728 [Post Q1 Result]Structure-Based Intraday Outlook | Jindal Stainless (JSL)
Price reacted near a confluence support zone, overlapping key trendlines and historical liquidity area.
The yellow caution label appeared, marking a potential high-probability trend shift based on Leola Lens SignalPro.
Rejection from this zone suggests early signs of accumulation.
If price sustains above this base, the pathway builds towards ₹728.
Watch for intermediate resistance zones around ₹702–₹706, which may offer short-term reactions before continuation.
⚠️ Educational Outlook Only — No Buy/Sell advice.
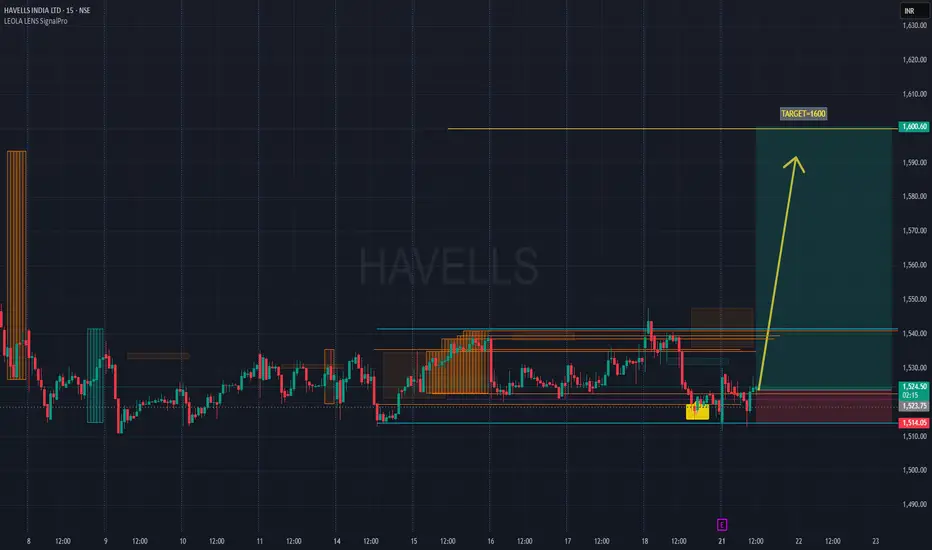
HAVELLS Pre-Result Reversal Watch I Holds for Potential 1600Chart Type: 15-minute | Tool Used: Leola Lens SignalPro
Price action has rebounded from a key liquidity zone (highlighted yellow) with visible accumulation below ₹1,520.
Key Observations:
Price retested prior demand zone (marked by SignalPro with structure and volume signals).
Potential bottom formation visible intraday with higher low attempt post 12 PM.
Rejection of downside wick near ₹1,514, aligning with earlier liquidity pockets.
Idea View:
If price sustains above ₹1,525–₹1,530, possible momentum expansion toward resistance zone at ₹1,600.60.
Clean structure break above previous order blocks may attract trend traders.
Result-based volatility expected — manage risk, especially with expected earnings post-market today.
Risk Reference Zone:
Invalid below ₹1,510 (red shaded zone)
This is not financial advice. Chart is for educational and structural reference only.
#HAVELLS #PriceAction #ChartAnalysis #MarketStructure #SignalPro #LiquidityZones #TechnicalAnalysis #TrendReversal #NSEStocks #EarningsSetup
Supply to Demand Flip Explained! | Spot High-Probability Zones Ever wondered how smart traders catch the perfect entries? 🤔
In this video, I break down the Supply-Demand Conversion Zones—where Supply turns into Demand and vice versa. With real chart examples .

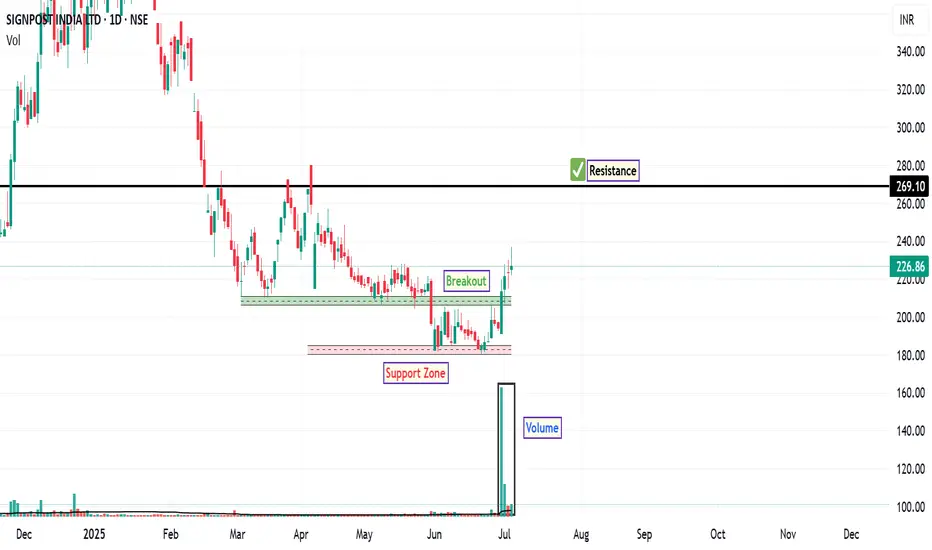
SIGNPOST: Potential Trend ReversalFollowing a significant corrective phase initiated in January 2025, SIGNPOST is now exhibiting a confluence of technical signals that suggest a potential reversal in trend. A noteworthy catalyst appears to be the recent institutional activity, substantiated by a bullish shift in price action, key moving average reclamations, and strengthening momentum indicators.
The most compelling recent development has been the report of bulk deals on Monday and Tuesday of this week. Such large-volume transactions often indicate institutional interest and can act as a catalyst for a shift in market sentiment. This event appears to have marked a local price floor, leading to a sharp upward thrust and suggesting a potential absorption of selling pressure. This influx of significant volume provides a strong foundation for the bullish hypothesis.
The price has now achieved consecutive closes above both its 20-day and 50-day EMAs. These moving averages are critical medium-term trend indicators. By moving above these levels, which previously acted as dynamic resistance during the downtrend, the price action indicates a material change in character. These EMAs may now be observed to act as the first line of dynamic support during any potential pullbacks or periods of consolidation.
Momentum oscillators are also corroborating the bullish price action, indicating a potential underlying shift in market control. The RSI has advanced sharply to a reading of 67. It is important to note that this level indicates strong bullish momentum and is approaching overbought territory, not oversold. A sustained reading above 60 typically signifies a robust and healthy trend is in place.
The MACD has registered a bullish crossover, with the MACD line moving above the Signal line. This is further supported by a positive and expanding histogram, which visually confirms that bullish momentum is accelerating.
The technical developments suggest the current price level is of significant interest. The recent price action indicates a potential shift in sentiment, making the present zone a noteworthy point for observation. The ₹269 price level appears to be the next significant technical hurdle. This area may correspond with prior price structure and could act as a potential zone for profit-taking or consolidation. The ₹181 level serves as a key area of underlying support. A decisive break below this level would potentially undermine the current bullish structure and suggest that the reversal attempt has failed.
Disclaimer: The information provided in this stock analysis is for informational and educational purposes only and should not be construed as financial advice. Always seek the advice of a qualified financial advisor or do own research before making any investment decisions.
"All-electric Future. From India. For the world."Ola Electric Mobility Ltd
About
Founded in 2017, Ola Electric Mobility Limited is an electric vehicle company that primarily manufactures electric vehicles and core components for electric vehicles. These components include battery packs, motors, and vehicle frames, all produced at the Ola Futurefactory.
Key Points
Market Leadership Co. is the largest E-Scooter Manufacturing company in India, with 31% market share in the E2W sector, selling 329,618 scooters in FY24.
Product Portfolio
1. Ola S1 Pro: A premium scooter with a 195 km range, 120 kph top speed, and a 7-inch touchscreen.
2. Ola S1 Air: Offers a 151 km range, 6 kW motor power, and a 7-inch touchscreen.
3. Ola S1 X+: A budget-friendly model with a 151 km range, keyless unlock, and a 5-inch display.
4. Ola S1 X: Mass-market scooters with up to 190 km range, available in 2 kWh, 3 kWh, and 4 kWh battery options, with a 3.5-inch display.
⚡ Ola Electric – Early Signs of Revival?
CMP: ₹41.73 | View: High-Risk Accumulation | Timeframe: Daily Chart | Sector: EV
🛵 Technical View:
Ola Electric has been in a steady downtrend since its listing but now showing signs of base formation near ₹40.
MACD on multiple settings is flattening and attempting crossover.
RSI has bounced from oversold zones and moving upward.
ADX/DMI showing reduction in negative strength – trend reversal possible.
Ichimoku cloud flattening – early signal for sideways to positive shift.
🔹 Key Price Levels:
🔸Support: ₹38.5 – ₹40
🔸Breakout Zone: ₹44.5 – ₹47
🔸Resistance: ₹51.5 / ₹60
📊 Volume:
Gradual rise in volumes with sideways consolidation. First green daily candle after long lower highs.
🔍 Fundamentals & Progress:
From Screener:
Not yet profitable, but business is capital-intensive and scaling.
Valuations currently not attractive, but price is near listing lows, making risk-reward favorable for high-risk investors.
🚀 Company Developments:
✅ Ola is rapidly expanding its EV scooter sales & showroom network
✅ Ola official site: Announced upcoming electric motorcycles and focus on battery innovation
✅ Government push for EV adoption will benefit Ola long-term
✅ Founder Bhavish Aggarwal aims to build an EV ecosystem (batteries + charging infra + vehicles)
🧠 Why Watch This Stock?
Sentiment may shift as markets look for beaten-down growth stories
Ola has brand recall, scale, and distribution
Any positive update (sales, production ramp-up, JV) can trigger a move
⚠️ Disclaimer:
This is a high-risk idea, suitable only for long-term investors or speculators with risk appetite. Not a recommendation. Do your own research.
📝 Note: Please do your own due diligence. This is not a recommendation, just a view based on charts and fundamentals.
🧠 Disclaimer: For educational and research purposes only. No buy/sell advice.
📝 Chart Purpose & Disclaimer:
This chart is shared purely for educational and personal tracking purposes. I use this space to record my views and improve decision-making over time.
Investment Style:
All stocks posted are for long-term investment or minimum positional trades only. No intraday or speculative trades are intended.
⚠️ Disclaimer:
I am not a SEBI registered advisor. These are not buy/sell recommendations. Please consult a qualified financial advisor before taking any investment decision. I do not take responsibility for any profit or loss incurred based on this content.
