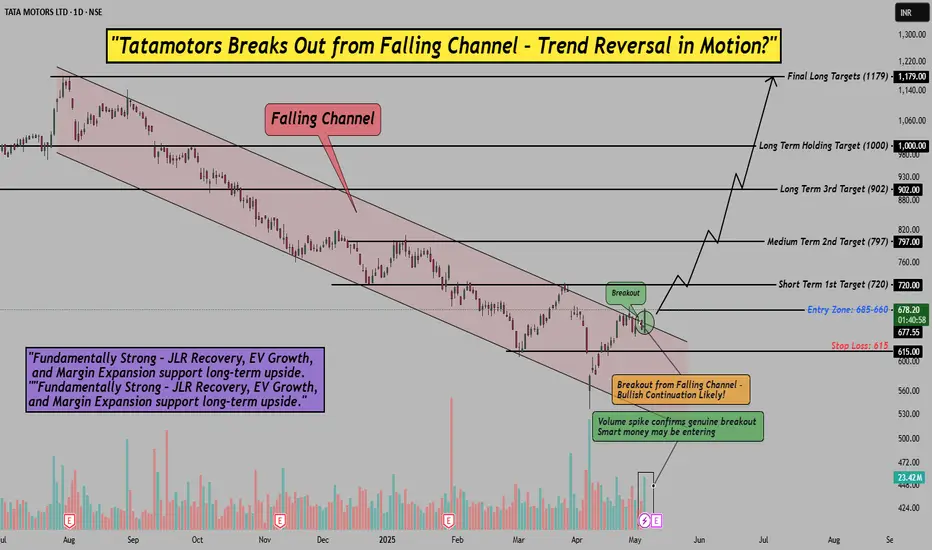
Tata Motors Breakout from Falling Channel – Trend Reversal SetupHello everyone i hope you all will be doing good in your life and your trading as well. Today i have brought a stock name Tata Motors which has broken out of a falling channel after a long consolidation period, and it looks like a potential trend reversal is in motion. The volume surge confirms a genuine breakout, indicating that smart money may be entering at this level. This is an exciting opportunity for both short and long-term traders.
The stock’s fundamentals remain strong , with JLR recovery , EV growth , and margin expansion supporting the long-term upside potential. I’m eyeing an entry range of 685-660 , with a stop loss at 615.00 . Let’s monitor this breakout closely and watch for further confirmation.
Disclaimer: This analysis is for educational purposes only. Please consult a financial advisor before making investment decisions.
If you found this helpful? Don’t forget to like, share, and drop your thoughts in the comments below.
Trendreversal
TAJGVK – Bullish Reversal in Play | Swing Targets Ahead
Stock: TAJ GVK HOTELS & RESORTS (NSE: TAJGVK)
Date: May 13, 2025
CMP: ₹407.90 (+12.66%)
🔍 Technical Overview
TAJGVK has shown a strong bullish reversal from a major weekly support zone, indicating a potential end to the corrective structure (A)-(B)-(C) and opening room for a strong upside swing.
📊 Key Levels & Structure
🟧 Weekly Support Zone (₹330.60 – ₹340.00)
Major historical demand zone.
Price reversed sharply from this level, confirming bottom (C).
🔴 Stop Loss (₹369 – Daily Close Basis)
Any daily close below ₹369 invalidates the bullish outlook.
Crucial for risk management.
🎯 First Target: ₹500
Previous resistance zone and psychological level.
Likely to see initial profit booking or consolidation here.
🔄 Interim Pullback Zone: ₹460–₹470
Minor retracement zone before continuation toward second target.
Healthy correction expected before breakout.
✅ Second Swing Target: ₹549 – ₹576
Extension level based on Fibonacci projections.
Strong upside potential if ₹500 is breached with volume.
💡 Trade Plan
Entry Zone: ₹385 – ₹395 (on dips)
Stop Loss: ₹369 (daily close basis)
Targets:
📌 Target 1: ₹500
📌 Target 2: ₹549 – ₹576
Risk-Reward: ✔️ Attractive R:R setup with defined structure.
📌 Conclusion
TAJGVK is presenting a well-structured bullish reversal pattern with clear levels and a favorable entry zone. Strong bounce from weekly support suggests bulls are back in control. This setup is ideal for swing traders looking for a high probability move.
💬 Share your thoughts or similar setups you're watching!
👍 Like & Follow for more technical breakdowns and swing trade ideas!
#TAJGVK #SwingTrading #NSE #TechnicalAnalysis #PriceAction #TrendReversal #StocksToWatch

Short Covering Trap Strategy – How to Catch Massive Moves!Hello Traders!
Today, we are diving into one of the most powerful and explosive setups in trading — the Short Covering Trap Strategy . When shorts get trapped and are forced to exit their positions, it can trigger massive upward moves in a very short time. If you can spot these traps early, you can ride some of the fastest rallies in the market!
What is a Short Covering Trap?
Short sellers bet on the market falling by selling first, planning to buy later at a lower price.
When the market suddenly reverses up against their position, they are forced to buy quickly to cover losses — creating a short covering rally .
This forced buying can lead to big green candles, breakout moves, and strong trend continuation .
How to Spot a Short Covering Trap
Identify Weakness or Breakdown Attempt
→ Price tries to break a support level but immediately reverses with high volume.
Sharp Reversal Candle
→ Look for strong bullish engulfing, hammer, or big green marubozu candle after false breakdown.
Volume Spike Confirmation
→ Check for sudden volume surge along with price reversal.
More volume = more trapped shorts.
Breakout Above Resistance
→ If price breaks above immediate resistance after trapping shorts, momentum can explode.
Real Example (OI Study please check chart above)
On 25th April 2025, Nifty faced rejection from the Resistance Zone around 24,100 levels.
OI data at 2 PM showed rising call writing pressure — indicating strong bearish sentiment initially.
By 3:30 PM, signs of weakening call writers emerged as put writers started adding positions, hinting at potential reversal.
On 28th April 2025, after Monday market opening, early morning OI data (9:15 AM and 10:15 AM) showed massive unwinding of call writers and heavy addition of put writing.
This sudden OI shift triggered a Short Covering Trap , leading to a quick rally of around 284 points in a short time.
Entry, Stop Loss, and Target Plan
Entry:
After confirmation candle closes above immediate resistance.
Stop Loss:
Below the reversal candle or recent swing low.
Target:
First target = Previous day's high or next major resistance.
Second target = Risk-Reward 1:2 or more.
When to Avoid This Setup
Low Volume Moves:
If the reversal happens without volume, it’s risky — avoid trading it.
Trending Down Days:
If broader market sentiment is heavily bearish, short covering may not sustain.
Rahul’s Tip
“Short covering rallies are like a firecracker — fast and furious. Ride it with strict risk control and exit smartly at targets.”
Conclusion
The Short Covering Trap Strategy offers some of the best risk-reward trades, especially in volatile markets. Recognize the signs early, manage your risk, and you can catch powerful explosive moves before the crowd!
Have you ever caught a massive short covering rally? Share your best trades and experiences in the comments below!
If you found this post valuable, don't forget to LIKE and FOLLOW !
I regularly share real-world trading setups, actionable strategies, and learning-focused content — all from real trading experience, not theory. Stay connected if you're serious about growing as a trader!

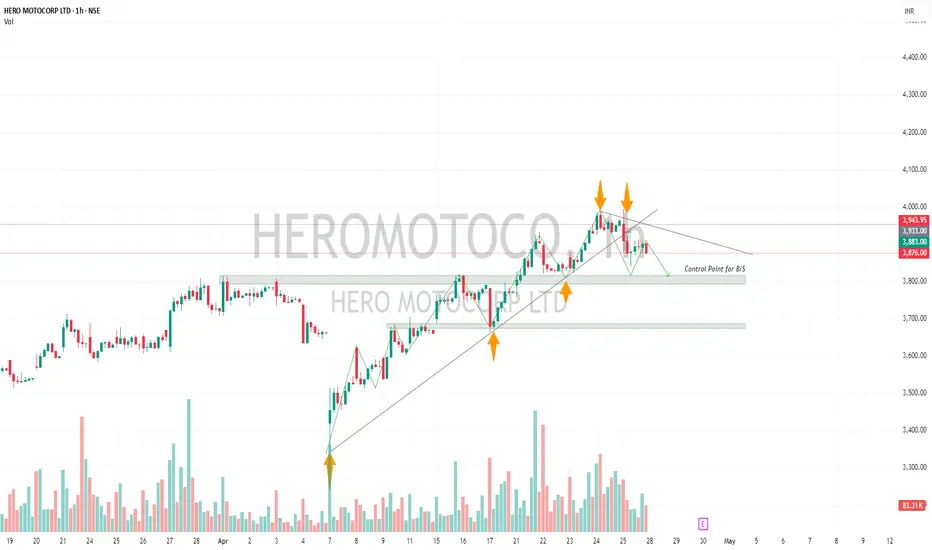
HEROMOTOCO-Positional Short Trade Stock upside taking support from trendline. Friday's session 25'th April The stock has shown weakness potential trend reversal.
There are two possibilities:
1)Head and Shoulder Pattern
2)Descending Tringle Pattern
For both the possibilities it the neckline/Support zone 3800 needs to break. If that happens it may test 3680.
If opens gap up Above 3960 Avoid!
Please don't forget click on follow button so you won't miss any upcoming ideas.
Any confusion, feel free to drop msg. Happy to help :)
This is only for educational purpose, please manage your risk accordingly.
Bank nifty Futures 23.04.25I am expecting a gap down opening an initial movement downwards. However, my strategy for today will be to buy on dips. Will be watching MP and OF for any developments. I will consider Important support areas and after additional confirmations take trades on buy on dips.

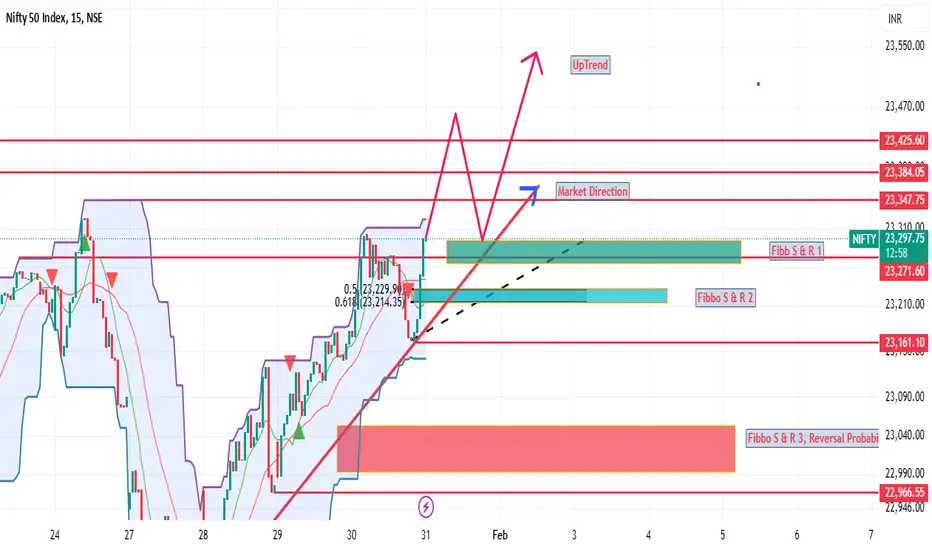
Nifty Bottom Forming? “Be Greedy When Others Are Fearful”Hello Everyone, i hope you all will be doing good in your life and your trading as well. Let's discuss about nifty and analysis some next move.
Guy's after a sharp correction in Nifty, signs of a potential bottom are finally emerging. Yesterday’s price action, supported by strong volume and the appearance of an Abandoned Baby candlestick pattern , indicates that we might have witnessed a key reversal day. The price held firm near a crucial support zone, and with most stocks near 52-week lows, we could be staring at a solid bounce opportunity.
This is exactly when smart money starts accumulating — when fear is high and hope is low. A price rally towards the upper channel resistance looks probable, provided Nifty sustains above the breakout zone.
echnical Highlights:
Reversal Signal: Formation of Abandoned Baby pattern near support
Volume Spike: Indicates possible institutional buying near bottom
Support Zone: Price reversed from key area, aligning with earlier channel lows
Resistance Target: 23,200-23,300 – upper boundary of the falling channel
Market Outlook:
With the broader market showing deep corrections across sectors (some 30–35% down from highs), this zone could be a powerful accumulation range. From Banking, Pharma, Chemicals, to IT and FMCG , many sectors are offering long-term value. As global sentiment improves and short-term panic fades, we may see Nifty lead a recovery move supported by sector rotation.
Rahul’s Tip
Bottoms aren’t confirmed by green candles alone, but by conviction + price behavior near support. Stay calm, follow structure, and let the chart do the talking.
Disclaimer: This analysis is for educational purposes only. Please consult a financial advisor before making investment decisions.
If you Found this helpful? Don’t forget to like, share. And Do you think this was the bottom for Nifty? Drop your thoughts and let’s discuss below!

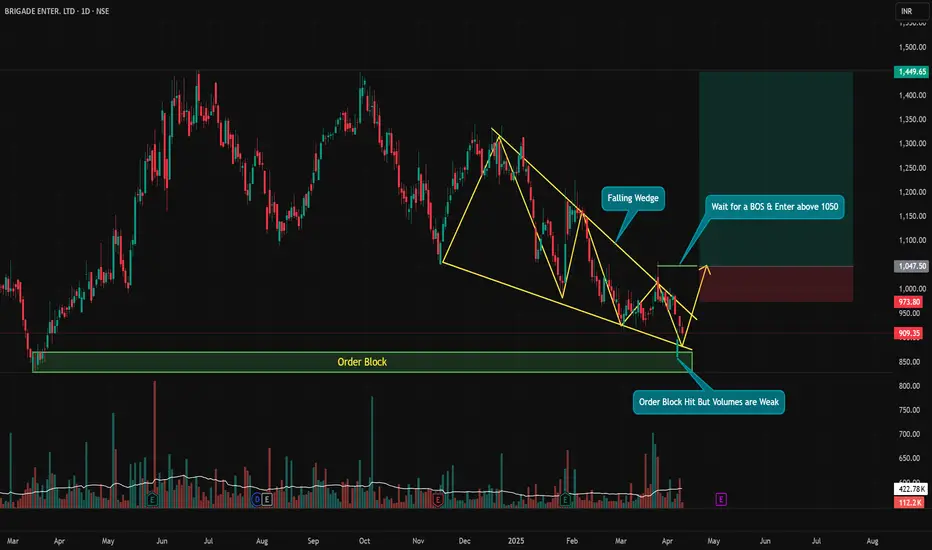
BRIGADE – Falling Wedge at Demand Zone, Waiting for BOSSetup Type: Reversal + Breakout Play | Conviction: Medium-High (Needs Confirmation)
Chart Framework: Smart Money + Classic TA
BRIGADE is showing signs of a potential trend reversal, but we’re not jumping in yet. Here's what the chart tells us:
🟡 Falling Wedge Formation – A bullish reversal pattern that typically resolves to the upside.
🟢 Tapped into a Strong Order Block – Smart money territory where previous accumulation took place.
🧲 Liquidity Grab Below Prior Lows, but... Volume on Bounce is Weak – Sign of caution.
📢 Analyst Rating: STRONG BUY – Adds institutional bias to the bullish setup.
🔐 No Confirmed Break of Structure Yet – Enter only after a clean breakout above ₹1050.
📈 Trade Plan:
Wait for a strong BOS (Break of Structure) and price closing above ₹1050 with volume.
Target zone near ₹1440+ aligns with measured move of wedge and previous supply.
⚠️ This is a setup with potential, but it’s not “ready” yet. Don't front-run smart money — let price confirm before jumping in. Risk management is a must.
Coal India Ltd - Breakout & Retest with Bullish MomentumCoal India Ltd has successfully broken a key resistance level and is currently retesting it, indicating potential bullish continuation. Entry zones are well-defined with a stop-loss to manage risk. Targets align with previous resistance levels, confirming strong risk-reward potential.
⚡ Key Technical Points:
- Resistance Breakout & Retest: Price has broken resistance and is retesting, a bullish confirmation signal.
- Resistance Breakout & Re-test 🔵
- Entry 1 - 401 🟢
- Entry 2 - 354 🟢 (Support Zone)
- Stop-Loss below 346 🔴 (Risk Management)
- Target 1 - 440.80 📈
- Target 2 - 502.75 📈
Why This is a Technically Strong Setup:
- ✅ Resistance Breakout & Retest: Price has broken a key resistance and is retesting it, a classic bullish continuation signal.
- ✅ Strong Support Levels: The 354 zone has acted as a solid support multiple times, making it a high-probability entry.
- ✅ Moving Averages Alignment: Price is reclaiming key moving averages, signaling trend reversal.
- ✅ Volume Confirmation: The breakout was backed by increasing volume, adding strength to the move.
- ✅ Favorable Risk-Reward Ratio: Defined stop-loss below 346 minimizes downside risk while upside targets offer a strong reward.
- ✅ Higher Highs & Higher Lows: Market structure suggests a shift to an uptrend.
🚨 No financial advice. Do your own research.

Death Crossover Strategy Explained with 50-EMA & 200-EMA line.Hello Traders! In today's post, we’ll explore the Death Crossover Strategy , a highly effective technique used by traders to identify potential trend reversals. This strategy involves the 50-EMA (Exponential Moving Average) crossing below the 200-EMA , which is considered a bearish signal.
In this chart of IndusInd Bank Ltd., we can clearly see the Death Crossover in action. The 50-EMA (green line) has crossed below the 200-EMA (red line), signaling a potential downtrend.
Key Insights:
Death Crossover : Occurs when the short-term moving average ( 50-EMA ) crosses below the long-term moving average ( 200-EMA ), suggesting the beginning of a downtrend.
Volume Confirmation : A sudden increase in volume after the crossover confirms the strength of the signal. In this case, the volume spike at the crossover indicates a strong bearish momentum.
Target Areas : After a Death Crossover , look for potential support levels to target as the price moves lower. In the chart, we can see how the price retraced and then continued its downward journey.
Price Action Post-Crossover:
In this example, the stock dropped by approximately -38.12% after the Death Crossover , highlighting how powerful this signal can be in catching major trend reversals.
Risk Management :
Stop Loss : To protect your capital, always use a stop-loss order just above the 50-EMA (green line) when entering a short trade after the crossover.
Position Sizing : Keep your position sizes small in trending markets to manage risk and ensure a favorable risk-to-reward ratio.
Note: We have used this chart just for teaching the strategy and its potential impact.
This is a great strategy to catch long-term downtrends, but as always, remember to use it alongside other technical indicators and fundamental analysis to increase your chances of success.
Happy Trading!

Signs of Trend Reversal in TanlaNSE:TANLA today showed signs of Early Trend Reversal with a Huge Volume Candle. If it Crosses R1 or 200 DSMA it Will Confirm it, Unless 10 DEMA and S1 are broken, the Target can be set near R2 Levels.
NSE:TANLA is a cloud communications provider enabling businesses to communicate with their customers and intended recipients. It is headquartered in Hyderabad, India. It is a global A2P(application to person) messaging platform provider.
📌Thank you for exploring my idea! I hope you found it valuable.
🙏FLLOW for more
👍BOOST if useful
✍️COMMENT Below your views.
Meanwhile, check out my other stock ideas below until this trade is activated. I would love your feedback.
Disclaimer: This analysis is intended solely for informational and educational purposes and should not be interpreted as financial advice. It is advisable to consult a qualified financial advisor or conduct thorough research before making investment decisions.

Abandoned Baby Pattern: A Powerful Reversal Tool for TradersHello Traders!
Today, let’s dive into the Abandoned Baby Pattern , an exciting and reliable candlestick pattern that can provide powerful reversal signals. Known for its ability to mark trend reversals, this pattern is a must-know for traders looking to enter at the right moment after a trend shift.
What is the Abandoned Baby Pattern?
The Abandoned Baby is a three-candle pattern that signifies a potential trend reversal. It occurs after a strong price move, usually at the end of an uptrend or downtrend. The pattern consists of the following candles:
A strong price movement in the trend direction (either bullish or bearish).
A gap down (for bullish reversal) or gap up (for bearish reversal) candle that opens and closes outside the previous candle’s range, signaling indecision.
A gap in the opposite direction , completing the pattern, and signaling a trend reversal.
Key Characteristics of the Abandoned Baby Pattern
Gap Down or Gap Up: The second candle gaps away from the first one, showing indecision and setting the stage for a reversal.
Trend Reversal: The Abandoned Baby pattern typically indicates that the trend is about to reverse.
Confirmation Candle: The third candle is the confirmation of the reversal, showing the direction of the new trend.
Volume Surge: Look for a spike in volume on the third candle to confirm the reversal.
How to Trade the Abandoned Baby Pattern?
Entry Point: Enter a position once the third candle closes, confirming the reversal direction.
Stop Loss: Place your stop loss just below (for a bullish reversal) or above (for a bearish reversal) the third candle to manage risk.
Profit Targets: Use a risk-to-reward ratio to set your profit targets, or measure the distance from the base to the top of the pattern for a more precise target.
Real-World Application: Nifty 50 Case Study
Looking at the Nifty 50 chart, we can clearly see the Abandoned Baby Pattern signaling a strong trend reversal. After the gap down and the formation of the three candles, the price broke out in the new direction, with clearly marked targets for potential trades.
Risk Management Considerations
Position Sizing: Always adjust your position size according to your risk tolerance and the volatility of the pattern.
Stop Loss Placement: Properly place the stop loss to avoid getting caught in false breakouts.
Patience & Confirmation: Wait for the third candle to close before entering the trade for confirmation of the reversal.
What This Means for Traders
The Abandoned Baby pattern is a great tool for spotting trend reversals. Combining it with other technical analysis tools like volume and support/resistance levels will make it even more effective.
Look for the pattern at the end of a strong trend to increase the probability of a successful reversal.
Confirm with volume for added reliability.
Use stop losses to minimize potential losses while targeting favorable risk-to-reward ratios.
Conclusion
The Abandoned Baby Pattern is a powerful tool for traders, signaling a strong trend reversal. By understanding its structure and how to trade it effectively, you can spot high-probability setups for profitable trades.
Have you traded using the Abandoned Baby pattern?
Share your experiences in the comments below! Let’s learn and grow together as traders.

Three Black Crows: How to Spot and Profit from Bearish ReversalsHello Traders!
I hope you’re all doing great! Today, we’ll discuss the Three Black Crows candlestick pattern, one of the most reliable bearish reversal patterns you can find in technical analysis. If you're serious about identifying potential trend reversals, understanding this pattern is essential.
The Three Black Crows is a powerful bearish signal that typically marks the end of an uptrend. It consists of three consecutive long red (or black) candles that close progressively lower, showing strong selling pressure and a shift in momentum. This pattern is particularly effective when it forms at a key resistance level, and it can lead to significant price declines.
What is the Three Black Crows Pattern?
The Three Black Crows candlestick pattern signals the reversal of an uptrend. The pattern forms when:
The first candle is a large red candle, closing near the low of the day.
The second candle opens below the first one and closes lower.
The third candle opens lower than the second one and closes near its low.
Each candle in the sequence is characterized by strong bearish price action, and their alignment suggests that bears are gaining control.
Key Characteristics of the Three Black Crows Pattern
Bearish Trend Reversal: Three long red candles following an uptrend suggest a shift in momentum from buyers to sellers.
Strong Resistance Zone: The pattern is more reliable when it forms near a strong resistance level, where the price has struggled to move past in the past.
Closing at the Low: Each of the three candles closes near their respective lows, showing increasing selling pressure.
Volume Confirmation: Volume should ideally increase with each successive candle, confirming that bears are taking control.
How to Trade the Three Black Crows Pattern
Entry Point: After the formation of the third candle, consider entering a short position once the price breaks the low of the third candle. This confirms the bearish trend.
Stop Loss: Place your stop loss just above the high of the third candle to minimize risk in case of a false breakout.
Profit Target: Measure the distance from the high of the pattern to the low of the third candle. Project this distance downward from the breakout point to estimate your profit target.
Real-World Application: Tata Consultancy Services Case Study
In the chart of Tata Consultancy Services (above), we can see a classic example of the Three Black Crows pattern. The price formed a resistance zone and then saw the three consecutive bearish candles break the support, confirming the bearish trend reversal. The huge fall after the pattern’s confirmation indicates the power of this candlestick formation.
Risk Management Considerations
Position Sizing: Adjust your position size based on your risk tolerance and make sure it fits within your overall portfolio strategy.
Stop Loss Placement: Place your stop loss above the third candle to avoid potential losses from a false breakout.
Confirmation with Volume: Always wait for volume confirmation before entering the trade. Volume should increase as the pattern forms.
What This Means for Traders
The Three Black Crows is an excellent pattern to spot potential trend reversals, especially after an uptrend. This pattern works best when combined with other technical indicators like trendlines, support and resistance, and moving averages to confirm the trend reversal.
Look for the pattern at resistance levels to identify high-probability bearish reversals.
Confirm with volume to increase the reliability of the pattern.
Use proper stop loss placement to manage your risk and ensure a favorable risk-to-reward ratio.
Conclusion
The Three Black Crows candlestick pattern is a reliable bearish reversal signal that can help traders capitalize on price declines. By identifying the pattern correctly, waiting for confirmation, and applying solid risk management strategies, you can improve your trading success.
Have you traded using the Three Black Crows pattern?
Share your experiences in the comments below! Let’s keep learning and growing together!

Mastering the Head & Shoulders Pattern: A Powerful Chart PatternHello Traders!
Today, we’ll be diving into one of the most powerful chart patterns — the Head & Shoulder Pattern . It’s widely used by traders to spot trend reversals, particularly from bullish to bearish trends. If you’re looking to refine your technical analysis, understanding this pattern will significantly boost your trading edge.
Understanding the Head & Shoulder Pattern
The Head & Shoulders pattern consists of three peaks: the Left Shoulder , the Head (the highest peak), and the Right Shoulder . It indicates a trend reversal , usually occurring after a strong uptrend.
Left Shoulder : The price rises to a peak, then declines.
Head : The price rises higher, forming the highest peak, before pulling back again.
Right Shoulder : The price rises again but fails to reach the height of the Head , followed by a decline.
Key Elements for Confirmation:
Neckline : A key support level formed by connecting the lows of the left shoulder and right shoulder.
Breakout : Once the price breaks below the Neckline , the pattern is considered complete, signaling a potential sell-off.
Trade Setup Based on Head & Shoulders:
Entry Point : Enter a trade when the price breaks below the Neckline , confirming the pattern’s completion.
Stop Loss : Place your stop loss just above the Right Shoulder to limit risk.
Targets : Measure the distance from the Head to the Neckline and project it downward from the point of breakout for the target levels.
Example: Nifty 50 Head & Shoulder Pattern
In the chart, we can see the Nifty 50 forming a Head & Shoulders pattern . After the breakdown below the Neckline , the target levels are identified on chart please follow same if you see this chart pattern anywhere, indicating a potential move downward.
Why is This Pattern Effective?
The Head & Shoulders is highly regarded because of its clear structure and reliability in predicting bearish reversals. It helps traders identify when the market is likely to turn, giving you the opportunity to enter trades at the right time.
Conclusion:
The Head & Shoulders pattern is a powerful tool for identifying trend reversals. When used with additional tools like volume analysis and support/resistance levels , it can enhance your trading decisions. Always remember to use a stop loss to protect your capital and consider multiple timeframes for confirmation.
Happy Trading! 😎📉

Mastering the Double Bottom Pattern for Trend Reversal Trading!Understanding the Double Bottom Pattern: A Key to Trend Reversal
Hello Traders! Today, let’s dive into the Double Bottom Chart Pattern , a classic technical pattern that signals a potential reversal in a downtrend. The double bottom is considered one of the most reliable patterns for identifying trend reversals, especially in the context of bullish market movements .
This pattern is typically found when the price forms two consecutive lows , each close to the same level, with a peak (or “neckline”) in between. Once the price breaks above the neckline, it indicates a potential long entry point.
Identifying the Double Bottom Pattern
Formation: Recognized by two consecutive lows, the Double Bottom forms when the price hits a support level, bounces up, and then returns to retest the same low before reversing higher.
Neckline Breakout: The pattern is confirmed when the price breaks above the “neckline” (the resistance level formed between the two bottoms). This breakout is typically followed by a sharp upward movement.
Volume Confirmation: Volume typically increases during the breakout, confirming the pattern and signaling strong momentum.
Support Zone: The area between the two bottoms, where the price repeatedly tests support, is a key area for setting stop losses and defining your risk management.
Trading Strategy: Double Bottom Pattern
Entry Point: Consider entering a long position once the price breaks above the neckline, confirming a trend reversal.
Stop Loss: Place your stop loss just below the second bottom to minimize risk if the price retraces.
Profit Targets: Measure the distance from the bottom to the neckline and project that distance upwards from the breakout point to determine your potential target.
Real-World Application: Lumax Industries Case Study
Looking at the chart of Lumax Industries , we can see a perfect example of the Double Bottom Pattern from 2008-2010. After the price tested the support zone twice, it broke above the neckline, confirming the reversal and setting the stage for strong upward momentum. This would have been an excellent entry point for traders who understood the power of this chart pattern.
Risk Management Considerations
Position Sizing: Adjust your position size according to the risk involved in trading this pattern.
Stop Loss Placement: The stop loss should be placed below the second bottom to protect against potential false breakouts.
Patience & Confirmation: Wait for confirmation of the breakout, and ensure volume is increasing as the price breaks through the neckline.
What This Means for Traders
By mastering the Double Bottom Pattern , traders can confidently enter trend reversals and capitalize on the subsequent price movement.
Look for the pattern in downtrending markets to identify potential opportunities for reversal.
Use volume as confirmation to validate the breakout and avoid false signals.
Be disciplined with stop losses to manage risk while allowing for maximum reward.
Outcome:
The Double Bottom Pattern is a powerful tool for identifying trend reversals, and when used correctly, it can provide high-probability trade setups with excellent risk-to-reward ratios. By understanding its formation and applying proper risk management, traders can enhance their trading strategies and improve their overall performance.
What’s your experience with the Double Bottom pattern?
Have you used this pattern in your trading? How did it work for you? Share your thoughts in the comments below!

Midcap ETF forming Dual Rounding PatternThe ICICI Prudential Midcap ETF is currently exhibiting a technically significant dual rounding pattern on its chart, with one smaller rounding top pattern nested within a larger, longer-term rounding formation. The 21 level has emerged as a strong support zone. A breach of this level would likely activate the smaller rounding top pattern, potentially leading to a further decline toward the 19 level.
The ETF initially displayed a bullish structure characterized by higher highs and higher lows, but has now shifted to forming lower highs and lower lows, a common early indicator of a trend reversal from bullish to bearish. This suggests that while the market is in the early stages of this reversal, it's too soon to definitively call the transition.
Volume analysis plays a crucial role in confirming price action, as volume tends to be a more reliable indicator. In the recent chart movement, a clear volume divergence was observed during the last upward move, indicating weakening buying interest. Conversely, there has been volume agreement during the recent price decline, further supporting the possibility of a bearish shift. Close monitoring of volume trends will be essential in confirming this potential reversal and avoiding any price manipulation signals.
****Nifty Midcap forming same pattern but we analyze this because we will do Price Volume Analysis***

Market Potential Upside, Uptrend, Check Fibbo Levels for Price AMarket current trend is uptrend. For price action kindly check Fibbo levels. Possibility of market rangebound. Overall market trend is bullish.
OLA Perfect Reversal fibonacciNow this is thepower of the fibonacci Level in the market, How this is perfectly work

MEDPLUSMedplus has given trend-line breakout with increased market participation. Seems promising for midterm trading. Trend reversal is quite possible after almost a year's consolidation.

HLE Glascoat - Under performer may show trend reversalHello, Everyone I hope you all will be doing well in your life and investing. Here I have brought a stock that is mostly at the bottom. HLE Glascoat Ltd is the name of the stock. CMP is 402.80. 350 looks like strong support. 430 is 200 DMA. Trend reversal Only if it close above that. It may turn positive for the long term.
If it close above 520 we may see long term target as per fibbo 620, 790, 920, 1050 to 1250. Not strong conviction but chances of bottom out.
HLE Glascoat Ltd
Source: screener.in
About
HLE Glascoat Ltd is in the business of manufacturing and sales of glass lined equipment and filters and dryers equipment for various industries in the country.
Key Points
Business Segments Q3FY24
Filtration and Drying Division (~39%)
The company manufactures filtration and drying equipment for various industries. It is a market leader with greater than 50% market share.
Glass Lined Equipment Division (~49%)
The company is the 2nd largest domestic player, with a 25% market share in glass-lined equipment manufacturing and sales.
Heat Exchange Equipment (12%)
The Company completed the acquisition of 35.56% of the partnership share in Kinam Engineering Industries on 26th September 2023. Kinam specializes in the manufacturing of shell and tube and corrugated heat exchangers of up to 4,000m2.
Industry-Wise Revenue Breakup Q2FY24
Specialty Chemicals- 42%
API & Pharma- 39%
Agrochemicals- 9%
Others- 10%.
Manufacturing Facilities
The company owns 7 manufacturing facilities globally. and possesses the capacity of producing ~600+ filters & 2,000+ GL Equipment p.a.
Capex
Completed Greenfield Plant at Silvassa, and began commercial manufacturing in Q1FY23.
In FY23, the Co. acquired a land area spanning ~1.30 Lakh square meters near Anand, Gujarat to establish a manufacturing plant dedicated to glass-lined equipment.
Key Clientele
Clients include Bayer, UPL, Sun Pharma, Atul, Gsk, BASF, Pi Industries, SRF, Zydus, Dr. Reddys, Sanofi, and others. Top 10 customers of the company account for ~35% of the total revenue in the glass-lined equipment segment and around 44% of the total revenue in the filtration and drying equipment segment in FY23.
Order Book Position
The company has an order book position of Rs 550 Cr as of Q3FY24 which provides visibility of 5 months for the India business and 12 months for the Thaletec business.
Discontinuation of Chemical Business
In May 2020, the company announced wind-down of its chemical manufacturing situated in Maroli due to its presence near upcoming residential establishments. The division accounted for ~20% of revenues in FY20.
Amalgamation
The company in Aug 23 proposed the acquisition of a 70% stake in Kinam Engineering Industries engaged in the manufacturing of heat exchangers. In Q2 FY24 it acquired a 35.56% stake in Kinam Engineering for ~Rs. 80 Cr and acquired a 0.50% equity shareholding in Kinam Enterprise.
The Board in Feb 24 has approved the Scheme of Amalgamation of Kinam Enterprise Private Limited with HLE Glascoat. Consequent to the Scheme the Company will acquire the control over the balance of 34.44% shares (to make it a 70% controlling stake) in Kinam Engineering Industries Private Limited.
Focus
Its focus will be on growing its market share in the Filtration, Drying, and Glass-Lined Equipment segments in India and abroad.
This is just to boost my confidence. No Suggestions for buying.
Disclosure: I am not SEBI registered. The information provided here is for educational purposes only. I will not be responsible for any of your profit/loss with these suggestions. Consult your financial advisor before making any decisions.

Bullish Trend in Reliance(Hindi)NSE:RELIANCE It shows good support at 1330-1350 and the next target could be 1500 & 1600 respectively.
The entire thought process has been defined in the video in Hindi

ASIANPAINTASIANPAINT has given pullback and renounced from 200 DMA. Chances are there that it may change its trend. Long term investor can consider this pullback.

Devyani International (W Bullish Pattern)Date : 10th April 2024
Time :12.00 PM
Devayani International is showing reversal from its usual support with other bullish indications.
As we can see ,
first of all W pattern is visible from strong support. also there is a bullish Divergence too.
Wave Count on Devyani is also looks like its time for ABC wave till depth of correction price level, which is 198 Rs.
Order Blocks on multiple time frame is also visible after last bullish movement.
With A Stop Loss of 150 Rs. [ i] We can Long Devyani Int.
Entry Zone will be 162 to 155 Rs with Target of 198 Rs
and RR is Minimum 1:3

Vodafone in 4H & 2H Demand Zones: Potential Reversal Ahead?Vodafone is currently consolidating in both the 4-hour and 2-hour demand zones , coupled with daily trendline support , indicating a strong potential for a bullish reversal. This price consolidation suggests potential accumulation and could lead to a bullish reversal in the near future. Also convergence of support levels across multiple time frames adds confidence to a possible bounce in price action. There should be a lookout for a potential bullish breakout, especially considering the strong confluence of support levels.
Key Levels:
Daily Trendline Support:
4H Demand Zone:
2H Demand Zone:
Breakout Possibility
The price is consolidating within the demand zones in both the 4H and 2H time frames, while maintaining contact with a daily trendline support. This consolidation could signal an accumulation phase, where the market is indecisive before a breakout. Once the price has broken out of the range (i.e resistance @ 13.77), The target could be the next supply zone around 15. There is also a small gap filling opportunity as well
