Bullish Reversal Ahead: Market Prepares for Sharp RecoveryThe market has been under consistent selling pressure, with a clear sequence of bearish breaks in structure confirming downside control. Price has now entered a zone where momentum shows signs of slowing, suggesting potential exhaustion in the recent decline. The sharp extension lower indicates that sellers may be reaching a short-term limit, creating conditions for a corrective rebound.
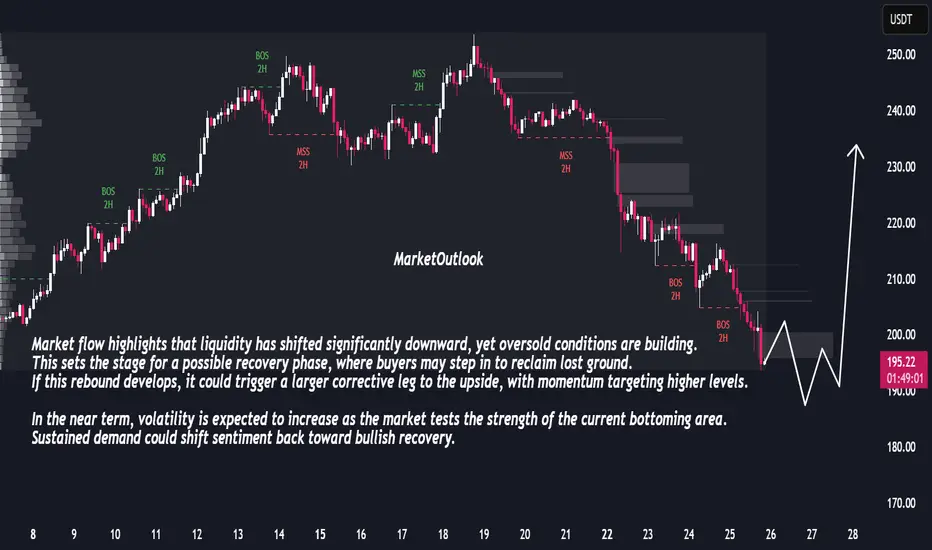
Market flow highlights that liquidity has shifted significantly downward, yet oversold conditions are building. This sets the stage for a possible recovery phase, where buyers may step in to reclaim lost ground. If this rebound develops, it could trigger a larger corrective leg to the upside, with momentum targeting higher levels.
In the near term, volatility is expected to increase as the market tests the strength of the current bottoming area. Sustained demand could shift sentiment back toward bullish recovery.
Trendshift
Bitcoin / USD – 15m Short Sell In this setup, I’m tracking BTC price action using the Fear Index (21) and Trend Shift Histogram (14) as confluence indicators for potential entries.
🔻 Key Observations:
The Fear Index showed a strong spike before the sharp sell-off, indicating growing selling pressure.
The Trend Shift Histogram gave multiple bearish signals (highlighted with arrows), aligning with the price rejection and downward continuation.
After the heavy drop, BTC attempted a recovery but faced resistance within the marked zone, forming a bearish retest.
📌 Trade Setup:
Short entry taken on confirmation of bearish trend shift.
Stop loss placed above the rejection zone.
Target aligned with the momentum continuation shown by the histogram and fear index.
⚡️ Conclusion:
This setup highlights how combining sentiment-based indicators (Fear Index) with momentum confirmation (Trend Shift Histogram) can help anticipate strong market moves. Always manage risk carefully, as volatility in lower timeframes can be sharp.
