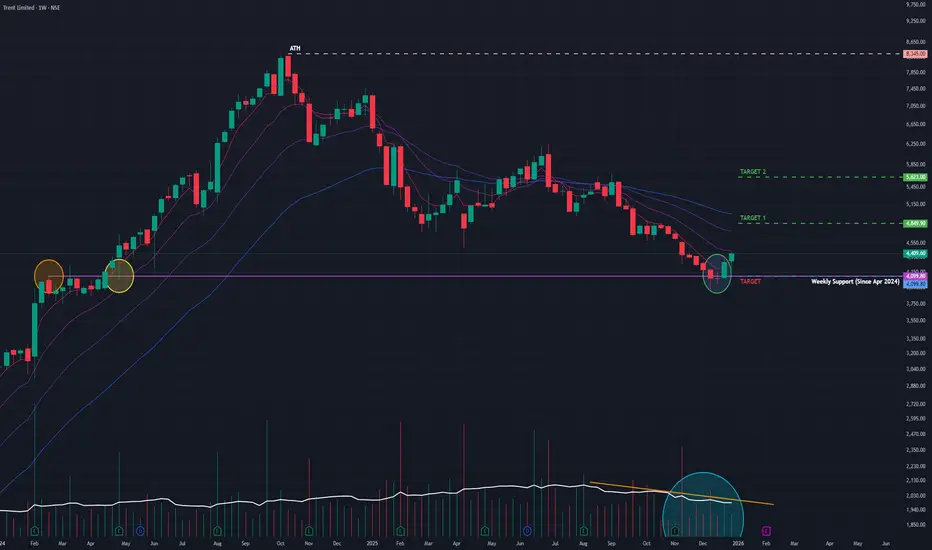
Trent (W): Bullish Reversal, Trend Reversal at Major SupportTimeframe: Weekly | Scale: Logarithmic
The stock is staging a classic reversal after a brutal 2-month correction. The "Morning Star" and "Hammer" combination at the 200-day EMA equivalent support signals that the "Panic Selling" is over and "Smart Money" accumulation has begun.
🚀 1. The Fundamental Catalyst (The "Why")
The reversal is driven by a shift in market perception:
> Valuation Comfort: After correcting ~50% from the top, the stock's valuation has cooled off significantly, attracting long-term institutional buyers who missed the earlier rally.
> Q3 Expectations: Investors are positioning for strong Q3 FY26 numbers, driven by the heavy wedding season demand in December, which directly benefits Westside and Zudio sales.
📈 2. The Chart Structure (The Complex Bottom)
> The Floor: ₹3,865 – ₹4,100 zone was a resistance in early 2024 and has now flipped to become a rock-solid support (Polarity Principle).
> The Pattern:
- Week 1 (Dec 8): Formed a long-legged Doji/Hammer at support (Stopping Volume).
- Week 2 & 3: Followed by a Morning Star formation (a bullish reversal pattern).
- Current Action: The confirmed Hammer this week shows that every dip is being bought aggressively.
📊 3. Volume & Indicators
> Volume: Volume was low during the drop (weak selling). The recent uptick in volume on bullish candles confirms Accumulation .
> RSI: The Weekly RSI turning up from the "Oversold" zone (near 30-40) is a high-probability buy signal in strong uptrends.
🎯 4. Future Scenarios & Key Levels
The stock is primed for a relief rally that could turn into a new trend.
> 🐂 Bullish Targets (The Recovery):
- Target 1: ₹4,850.
- Target 2: ₹5,625
- Blue Sky: If it clears ₹5,625, the structure shifts back to a full bull run targeting ATHs.
> 🛡️ Support (The "Must Hold"):
- Immediate Support: ₹4,100 . The "Shoulder" of the reversal pattern.
- Stop Loss: A close below ₹3,850 would invalidate the Morning Star and suggest a deeper fall to ₹3,400.
Conclusion
This is a Grade A Reversal Setup.
> Refinement: The structure is "Oversold Bounce" turning into "Trend Reversal."
> Strategy: This is an ideal entry point. Accumulate near ₹4,200–4,300 with a stop at ₹3,850 for the ride back to ₹4,850+ .
Trent
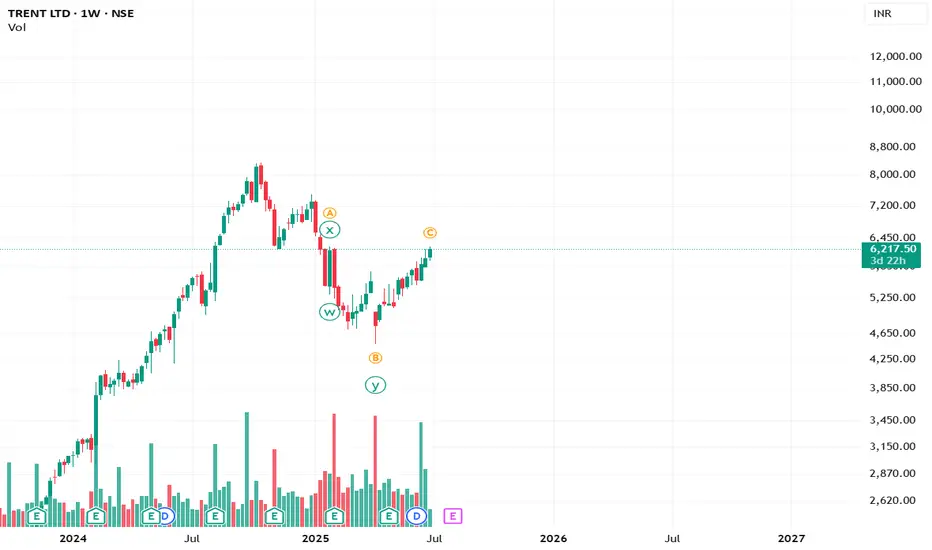
TRENT : Right Time to Catch Wave?
### 🧠 Chart Context & Wave Overview
The chart of TRENT LTD (Daily Timeframe) displays a strong Elliott Wave corrective setup , where price action seems to have completed an extended retracement (113%–127%) of the previous swing low .
This zone often marks the final leg of a correction and can lead to the start of a fresh impulsive rally — possibly Primary Wave 5 .
📊 Key Observations:
* Price is consolidating inside the Extended Retracement Zone (₹4,249–₹4,357) .
* Intermediate Wave (a-b-c) structure looks complete.
* Breakout above the long-term trendline (Wave 2–4) will confirm bullish reversal.
---
### 📚 Educational Insights
💡 Extended Retracement Zone (113%–127%):
When corrections go beyond the usual 61.8%–78.6% retracement, it often represents an “overshoot flush” — a zone where weak hands exit and institutional buyers enter.
📘 Elliott Wave Psychology Recap:
Wave 4 corrections tend to be complex and deep , but they provide the last strong entry opportunity before the final impulsive move (Wave 5).
🔁 Character Change in Price Action (ChoCH):
A ChoCH above recent highs indicates the first structural shift — confirming that sellers are losing control and accumulation may be underway.
---
### 🎯 Projection & Price Prediction
* 🟢 Primary Support / Entry Zone: ₹4,249 – ₹4,357
* ⚙️ Extended Retracement Base: ₹4,012 – ₹4,261
* 🔴 Stop-Loss (Closing Basis): Below ₹3,929
* 🎯 First Upside Target: ₹5,850 – ₹6,059
* 🚀 Second Target: ₹7,471
Once the structure confirms reversal above ₹4,600–₹4,750, the probability for a Wave 5 impulse toward ₹7,400+ increases substantially.
---
### 💡 Trading Strategy (Educational Purpose Only)
📈 Entry Plan:
Watch for bullish reversal signals (Hammer / Bullish Engulfing / Double Bottom) in ₹4,250–₹4,350 zone.
Aggressive traders can accumulate early with SL below ₹3,929.
Conservative traders can wait for confirmation above ₹4,700.
🎯 Targets:
• Target 1 → ₹5,850 – ₹6,059
• Target 2 → ₹7,471 (Extended Wave projection)
⚖️ Risk Management:
• Risk only 1–2% per trade 💰
• Avoid aggressive averaging during corrections
• Wait for structure + volume confirmation before scaling
---
### 🧩 Educational Takeaways
✅ Extended retracement zones often represent strong demand and accumulation phases.
✅ A ChoCH or structure breakout gives early reversal confirmation.
✅ Wave 5 rallies are often sharp and impulsive — rewarding patient traders.
✅ Combining Elliott Wave + Fibonacci + Price Action improves accuracy and timing.
---
### 📊 Summary & Outlook
TRENT LTD is holding firm within its extended retracement base (₹4,250–₹4,350) , signaling exhaustion of sellers.
A breakout above the trendline resistance could trigger a strong Wave 5 impulse toward ₹5,850 initially and ₹7,400+ eventually.
Patience and confirmation remain key to capturing this move effectively. ⚡
---
### ⚠️ Disclaimer
I am not a SEBI-registered analyst .
This analysis is purely for educational and informational purposes and should not be considered financial advice.
Please consult your financial advisor before taking any trading positions.

TRENT : When price corrects, smart money observes — not panics.NSE:TRENT
Technical View (Monthly)
Long-term trend bullish, currently in a healthy correction
0.618 Fibonacci support: ₹3,900–4,100 → key demand zone
Resistance: ₹4,900–5,000 (must cross for fresh uptrend)
Trend damage only if: Monthly close below ₹3,800
Expect sideways consolidation before the next big move
Fundamental View
Strong retail brands, aggressive store expansion
Earnings growth is strong, but the valuation was stretched
Current correction = valuation & time adjustment, not business issue
Future Growth Outlook
Positive long-term drivers: consumption growth + scale benefits
Near-term returns may stay muted; 3–5 year story intact
Actionable Summary
Investors: Accumulate near ₹4,000 with patience
Traders: Bullish only above ₹5,000
Risk: Breakdown below ₹3,800
Verdict: High-quality stock in correction phase, not a trend reversal.
==============
⚠️ Disclaimer:
==============
This content is shared strictly for educational and informational purposes.
We are not SEBI-registered investment advisors or analysts.
The views expressed are personal opinions, based on publicly available data and market observations.
Please consult a SEBI-registered investment advisor before taking any investment or trading decisions.
Any actions taken based on this content are entirely at your own risk and responsibility.
========================
Trade Secrets By Pratik
========================

Trent Limited: Price Action Signals Weakness Ahead📉 Trent Limited: Price Action Signals Weakness Ahead
Trent Limited, currently trading at ₹4336.00, is exhibiting signs of technical weakness based on its weekly chart structure. A few key observations highlight the bearish undertone:
🔻 Lower Low Formation
The current weekly candle has breached the previous low, forming a lower low.
This pattern suggests a continuation of the downward trend, indicating sellers are gaining control.
📊 RSI Below 50: Momentum Shift
The Relative Strength Index (RSI) has sustained below the 50 mark.
This level often acts as a momentum threshold; staying below it reflects weakening buying interest and growing bearish sentiment.
📉 Below Key Moving Averages
The stock is trading below its 50-day and 100-day Simple Moving Averages (SMA) on the weekly chart.
This positioning reinforces the downward bias, as it shows the price is underperforming its medium- and long-term averages.
🧭 What It Means
The combination of a lower low, weak momentum, and positioning below key moving averages suggests that further downside may be likely in the coming sessions.
Traders and investors may consider exercising caution and monitoring for signs of reversal or support before re-entering.

A Possible alternate count for TRENT?Whether TRENT has completed its complex correction or is still unfolding an expanded flat. Only time will tell.
TRENT LTD – INTRADAY ZONE ANALYSIS________________________________________________________________________________
📈 TRENT LTD – INTRADAY ZONE ANALYSIS
📆 Date: July 1, 2025 | ⏱ Timeframe: 15-Minute Chart
🔍 Educational Analysis for Learning Purposes Only
________________________________________________________________________________
📊 Zone Breakdown:
• 🔴 Top Range Resistance – 6,261
Marked in Red: This is a key supply zone where the price has previously stalled. Traders should watch for bearish reversal candlestick patterns like a bearish engulfing, evening star, or long upper wick rejection. A lack of follow-through volume here may indicate exhaustion.
• 🟠 Neutral Zone – Avoid Trade Area (6,155 – 6,210)
Marked in Orange: Price tends to be indecisive here. This is a “no trade zone” unless supported by a strong trend direction and setup. Historically, it has shown sideways movement and choppy behaviour.
• 🟢 Demand Zone – 6,105 to 6,066.50 | SL: 6,058.10
Marked in Green: Price reacted sharply from this zone with rising volume. A bullish engulfing candle confirmed demand here. Ideal for watching pullback opportunities on re-tests, supported by bullish confirmation candles.
• 🟩 Bottom Support – 5,968
A strong base level. A breakdown below this zone may signal a shift in short-term structure. Look for volume spike and wide-bodied red candle for bearish confirmation.
________________________________________________________________________________
🔍 Candlestick Observation:
At the Top Resistance Zone (6261), recent candles show upper wicks and indecision, but no strong bearish reversal yet. Volume is elevated, signaling activity, but candles show hesitation.
🧠 Interpretation: This could be an early sign of supply pressure. A follow-up bearish engulfing or strong rejection candle may validate a reversal. Until then, price may consolidate within the zone.
________________________________________________________________________________
⚙️ Educational Trade Ideas (Study Purpose Only)
▶️ Reversal Setup – Bearish Bias
• Entry: Below ₹6,190 on confirmation candle from resistance zone
• Stop Loss: Above ₹6,265
• Risk-Reward: 1:1 | 1:2 +
• 🧠 Ideal for learning how price reacts to supply after a sharp rally
________________________________________________________________________________
▶️ Pullback Setup – Bullish Bias
• Entry: Near ₹6,100–₹6,110 on bullish confirmation from demand zone
• Stop Loss: ₹6,058
• Risk-Reward: 1:1 | 1:2 +
• 🧠 A classic “Breakout–Retest–Continuation” setup with proper risk management
________________________________________________________________________________
⚠️ Disclaimer (SEBI-Compliant):
This content is shared strictly for educational and informational purposes only. It does not constitute investment advice or a trading recommendation. Always consult a SEBI-registered financial advisor before making investment decisions.
STWP | Learn. Trade. Grow.
________________________________________________________________________________
💬 What do you think about this TRENT setup?
Did you observe any volume divergence or trendline reaction?
👇 Drop your insights in the comments — let’s grow together!
________________________________________________________________________________
Bonus:

Trent Price Action Decoded – Simplicity Wins!No calls, no forecasting — just pure price action. In this post, I’m simply sharing how I see Trent’s chart. Clean structure, organic movement, and a simple approach to reading the price. For those who enjoy observing the market without noise or bias.

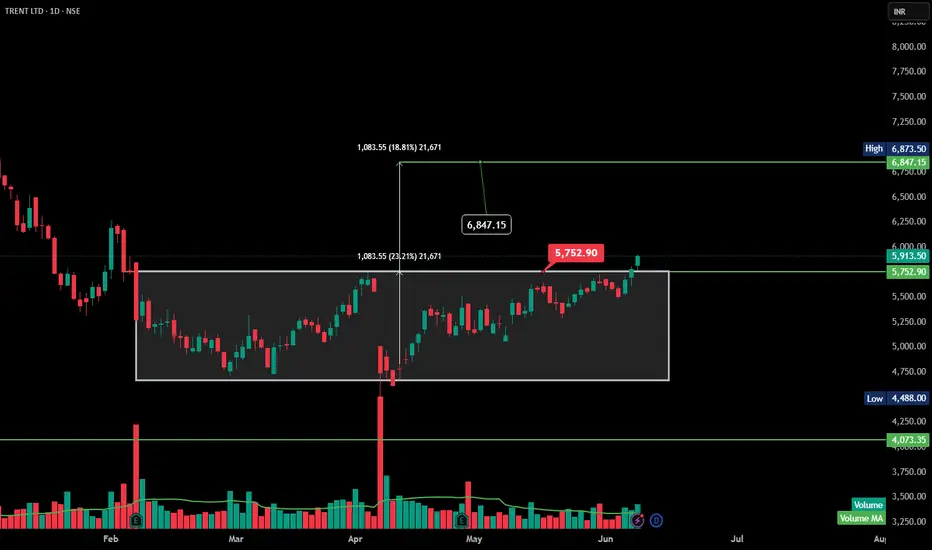
TRENT | rectangle range breakout |DailyHere’s a **technical analysis summary** for TRENT Ltd (NSE: TRENT) based on the chart you provided:
---
🔍 **Pattern Observed:**
The chart highlights a **rectangle range breakout** or a **horizontal consolidation breakout**. Price was consolidating between \~₹4,670 and ₹5,750 levels for several weeks and has now broken out above ₹5,750, confirming the breakout.
---
🔹 **Key Levels:**
* **Breakout zone:** ₹5,750
* **Current price:** \~₹5,913.50
* **Next resistance/target:** Measured move target around ₹6,847–₹6,900 based on the height of the rectangle (₹1,083.55 added to the breakout point).
* **Support:** ₹5,750–₹5,600 zone.
---
🔹 **Volume is missing during breakout.
Strong bullish breakout🚀 TRENT LTD Trade Setup - STWP Indicator Insights 🚀
💹 Strong bullish breakout in TRENT LTD! Here’s the setup:
🔹 Entry: ₹5614.95
🔹 Stop Loss: ₹5280 (Risk: ₹334 per share)
🔹 Target 1: ₹5949 (+₹337 per share)
🔹 Target 2: ₹6284 (+₹670 per share)
📊 Why this trade looks promising?
✅ RSI & Bollinger Band Breakout 📈
✅ Bullish SuperTrend & VWAP support ✅
✅ BB Squeeze-Off Breakout - Potential strong move ahead!
Trading Strategy:
🔸 Safe Approach: Wait for a pullback near ₹5400-₹5500 for entry.
🔸 Aggressive Approach: Hold with SL ₹5280, aim for ₹5949-₹6284!
📉 Risk is limited, rewards are high! Are you taking this trade? Drop your thoughts below! 🔥💬
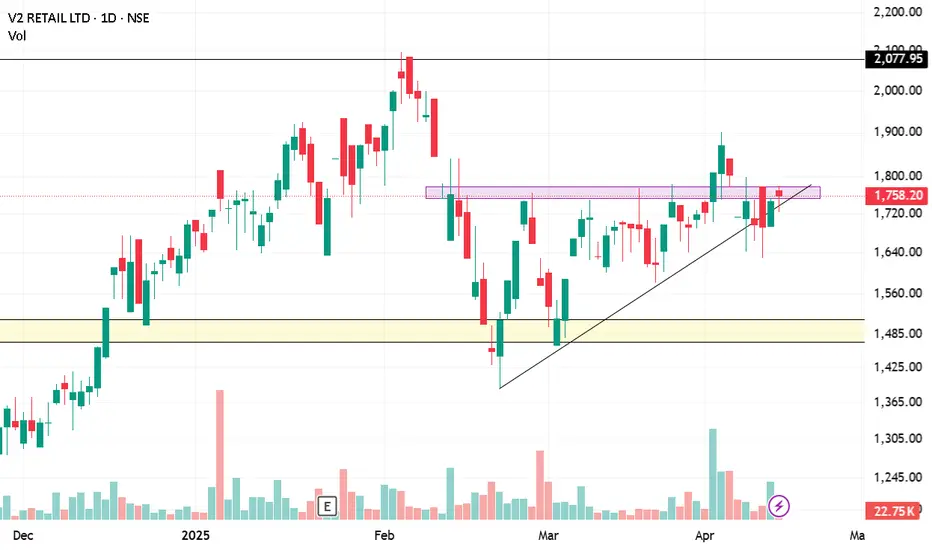
V2 Retail Breakout on the way after strong 69% growth in retail fasion segment. V2 is now leading the race. baazar style also good but winner is our V2 .
heavy consolidation for last 2 months, no major correction in this heavy selloff and volatility. Must be a breakout worthy candidate.
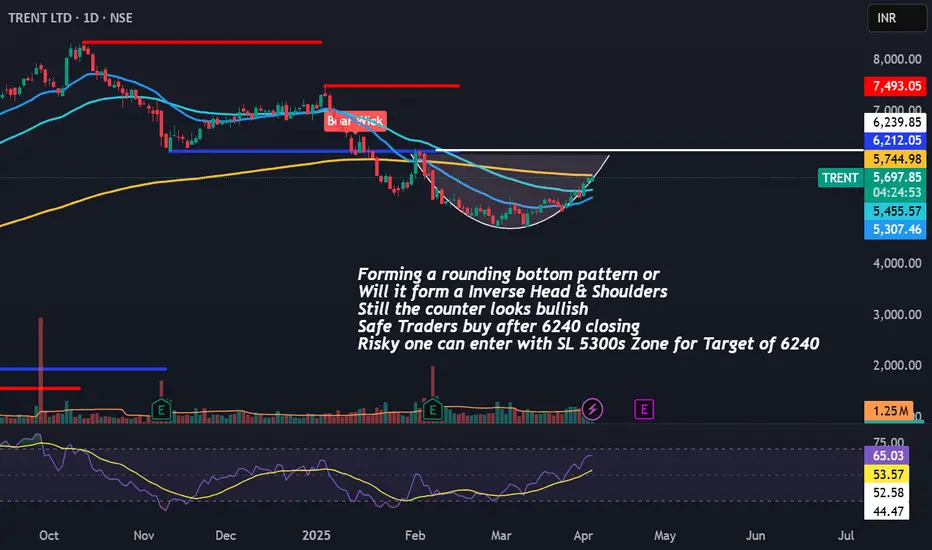
Trent Bullish Bias Target of 6240/-Forming a rounding bottom pattern or
Will it form a Inverse Head & Shoulders
Still the counter looks bullish
Safe Traders buy after 6240 closing
Risky one can enter with SL 5300s Zone for Target of 6240
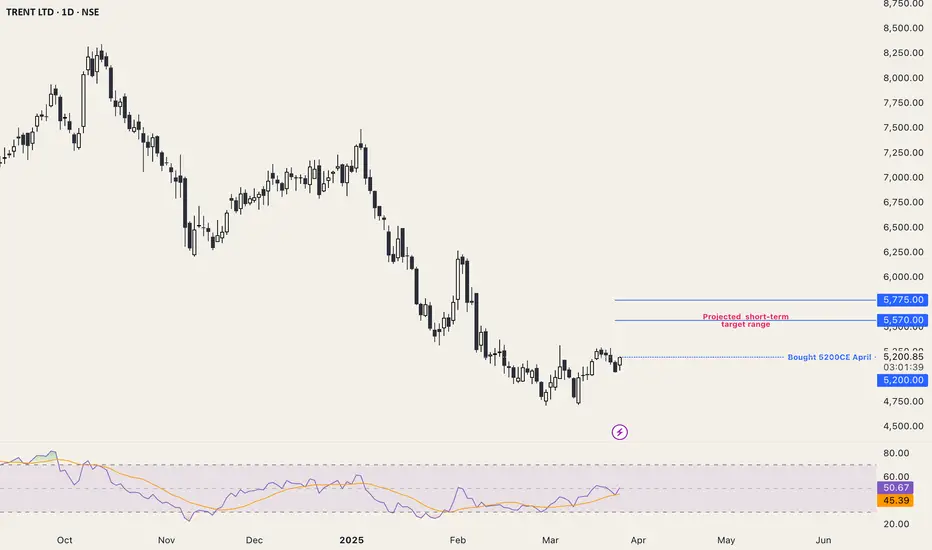
Trent Bullish projectionFor the longer term, TRENT is a good stock to pick. For the time being, the projected short-term target is mentioned in the chart.
Bought 5200CE April expiry and the recent low of 25th Mar is the stop out.
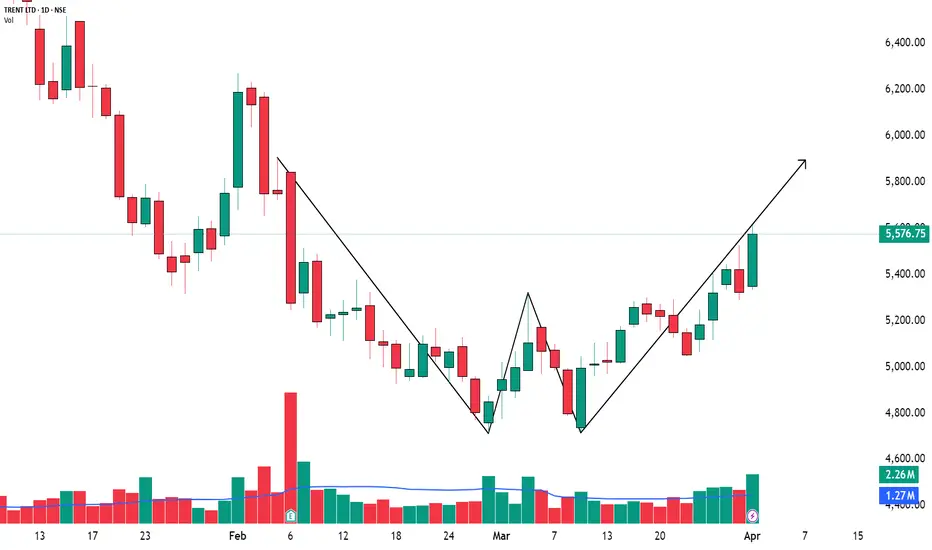
Trent ..... bottoming signs seenChart is self explanatory. Trent after a correction may seems to end correction....
Risk i feel i less here than reward...
So my view from bearish turns to neutral
Now mild bullish rather......

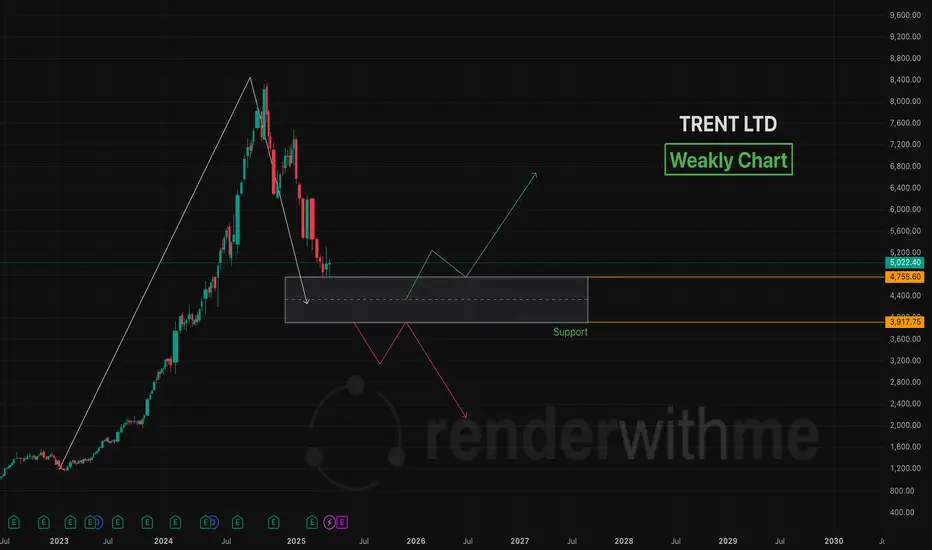
Trent Technical Analysis - Weakly Chart🇮🇳TrentLtd. is an Indian retail company under the Tata Group , operating brands like Westside, Zudio, and Star. Its stock (NSE: TRENT) has been a strong performer in recent years, driven by robust retail expansion and financial growth.
📈📉Chart For your reference

Trent - Too many opportunitiesStock reaching a strong resistance area of 6585 - 6620
Bears may try to take control again of the stock
Can be sold if get an confirmation in LTF (Hourly) with Sl of 6630
If all goes fine, we may see 6200 area back soon
If it closes above 6630 then stock may go sideways to slow bullish for quite some time (Excellent Straddle Opportunity)
Also area of 7300 -7320 is the highest probability sell area
Caution : Always take confirmation in LTF

TRENTTrent given head and shoulder breakdown and target has been completed @ bottom trendline
recently it create butterfly harmonic pattern @ trendline
rsi divergence @ completion of butterfly harmonic pattern
Buy TRENT above 1223 add more 1182 closing sl below 1131
Target=1300=1362.55-1496.8-1569.55
(Revised stoploss @1183 crossing above 1248)

Trent Long | 19 Dec | IntradayTrade setup of either of case happens
1. Price closes above 7140 15min then we enter with 7080 SL and target 7200+ with RR of 1:1
2. Price goes to down first and take support or show rejection at lower levels around 7020-40
We enter with wither day low SL or 6980-6940 as per Risk apetite for 7000-7200 RR > 2

TRENT Stock: Key Levels, Trends, and Trading StrategiesTrend Analysis
Primary Uptrend:
The stock has been following a strong upward channel, as shown by the blue trendlines.
Over the past months, the price has consistently respected these trendlines, indicating strong investor confidence and sustained buying pressure.
Current Channel Movement:
The price is trading within a secondary ascending channel, showing shorter-term consolidation within the broader trend.
This setup suggests that while the uptrend remains intact, the stock is in a phase of measured growth.
Key Levels
Support Levels:
₹6,688.75: A critical near-term support level, highlighted in red. This level aligns with the lower boundary of the short-term channel.
₹6,353.25: The major support level that the price must hold to sustain the broader uptrend.
Resistance Levels:
₹7,081.15: A key resistance zone, which the stock has been testing recently.
₹7,234.70 and ₹7,445.10: Further resistances that could come into play if the stock breaks out above ₹7,081.15.
₹7,644.10: The ultimate resistance in the current setup, beyond which the stock could experience strong bullish momentum.
Volume Analysis:
A noticeable volume spike occurred during the last leg of the uptrend, signaling strong accumulation by investors.
Current volume trends are more subdued, suggesting a period of consolidation, which often precedes a breakout.
Key Observations
Bullish Flag Formation:
The stock is forming a bullish flag, a continuation pattern that often leads to further upside. A breakout above ₹7,081.15 could confirm this pattern.
Potential Scenarios
Bullish Case:
If the stock breaks ₹7,081.15 with strong volume, it could rally toward ₹7,234.70 and eventually ₹7,644.10.
Bearish Case:
If the stock breaches ₹6,688.75, the next support at ₹6,353.25 will be crucial to watch.
TRENT stock exhibits strong upward momentum, making it an attractive option for traders. A breakout above ₹7,081.15 could signal further gains, while buying near ₹6,688.75 support levels offers a favorable risk-reward setup. As always, implementing strict stop-loss levels and sound risk management is crucial to handle potential market volatility effectively.

Trent - Best Intraday stocks for tomorrow 14 Oct 2024 Trent has outperformed Nifty in past days and there is high probability of continuation of its performance.
So for tomorrow in my opinion it will be best for intraday trading but when to trade?
Condition 1- If price falls or opens gapdown then it will best to buy after support creation.
Condition 2- if opens flat or Little gapdown and moves upside towards previous trading sessions resistance then, price should take a halt at resistance levels then it will be good opportunity to buy at resistance break.
Condition 3- if price opens Gapup and creates a selling swing and test previous trading sessions resistance (which may act as a support) then after creating support or W PATTERN price will bounce

Breakout - TrentTrent has broken out strongly on good volumes. It bounced back from the support and is now moving in a bullish trend.

Trent on bull run.Can se trent to go up at higher levels cause of recent sales growth and its technical the CAGR is appx 56% YOY must give time can see higher levels soon.

BO in Trent. Expected upside of 32% The results of Trent Ltd was positive. The BO of channel pattern is on the charts with increased volume.
Do your own study before investing.
