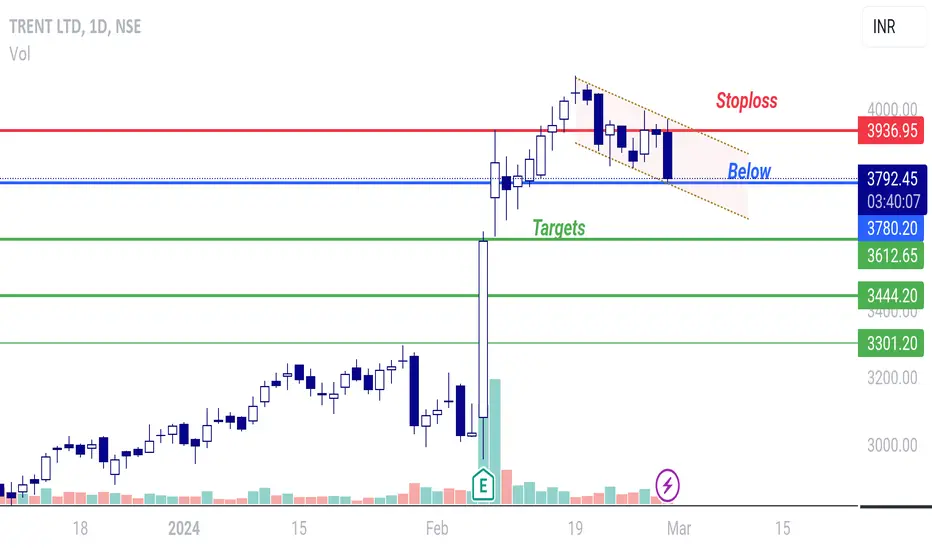
Trent may have Bent. A head and shoulder pattern on the top always comes with a caution especially when the high is a doji.
Trent
Breaking All-Time Highs: A Journey into TRENT's Price Action 🚀Hey traders! 🌟 Ready to embark on an exciting journey into the world of TRENT's recent price action? We've got a breakout, some zones, and a plan to trade! Let's dive in.
TRENT has made a historic move, breaking all-time highs with impressive volume. 📈
we observe the formation of a Demand Zone – the classic rally base rally (RBR) pattern.
RBR Zones: After an upward move and consolidation, another rally occurs. In our case, it's the Demand Zone. Currently, TRENT is inside the RBR zone, testing the breakout level.
TRENT is testing its breakout level with low volume, and now residing in the RBR zone. Consider initiating buy trades within this zone, aligning with the broader bullish trend.
The stage is set for potential upward momentum from the RBR zone.
📚 Remember, this analysis is for educational purposes only. I am not a SEBI registered analyst. Trade responsibly.

TRENT DOUBLE BOTTOM BREAKOUTTRENT breaking double bottom
good volume strong rsi
educational idea only

Trade-23/100-TRENT-R:R Experiment-BuyBuying TRENT in DAILY positional trade
Good structure making HH-HL.

TRENT RECTANGLE BREAKOUTTRENT breaking out a range box
with huge volume bullish RSI
and MACD crossover
educationa idea only

T R E N TTRENT fut broke out of triangle pattern on an hourly chart with good OI build up as well as very good risk:reward ratio.
Could be bought with mentioned stoploss & target.

T R E N TTRENT broke past multiple resistance level of 1730 with good OI build up.
Could be bought with mentioned stoploss & target.


Trent All time HighTrent india retail sector company continue show the positive trent currently the share is brackout in the all time hight level. The price is also follow in the Channel.
i am bullish on the share and my stop loss is higher time frame is channel lower point.
Note:- This is only for education purpose, if you support kindly subscribe youtube channel


Trent A Swing Buy or not ?Hi, well you have seen that how the market is falling and most of the stock are going down including nifty but at now things have changed and it's showing us a buy with the hint of Inverse head and shoulders pattern one of the most common, used and with higher success rates. Targets can be taken near 1560 to 1565. Thank you . pls do follow and like the post. also tell me your opinion on this

TRENT LTD: SHORT TERM TREND ANALYSISThis scrip is certainly a Cash Cow for the Traders in next few days. Here we see TRENT LTD in completed CUP and HANDLE Format. The Chart has retested the support level at 1286 and crossed above the level 1340.55. First Entry level @ 1340 has already crossed as stock is trading @ 1363.10. However, if it retests the support level @ 1340.55 , one can enter the trend @ 1340. The Targets would be 1380 (Previous Resistance), 1475 (Previous Resistance) and 52 Week High of 1560.
Volume is High and Trend is supported by both the Moving Averages. Please refer to the Chart for further details and let me know if you have any questions. This analysis is completely for educational purposes, and it has nothing to do with CALL TIPS.
Please do not forget to boost once you are satisfied with my analysis.

TRENT Long Buying: A Smart Move According to Technical AnalysisThis report aims to provide a technical analysis of TRENT stock and a recommendation for buying the stock in the short term. The analysis is based on the latest charts and indicators, and is intended for investors and traders who are looking to capitalize on market movements.
Background:
Trent Limited is an Indian retail and lifestyle company. The company's stock is listed on the National Stock Exchange of India (NSE) and is widely followed by investors and traders.
Analysis:
The TRENT stock has been in a range-bound pattern for the past few months, but recent price action suggests that the stock may be breaking out. The stock has been trading in a range between 1155.70 and 1224, and a breakout above 1224 could signal a short-term trend reversal.
The technical indicators are also pointing to a potential buying opportunity. The Relative Strength Index (RSI) has been trending higher and is currently at oversold levels, indicating that the market is oversold and may be due for a rebound. Additionally, the Moving Average Convergence Divergence (MACD) histogram has crossed above the zero line, suggesting that the trend is gaining momentum.
Furthermore, price action on the chart shows that the stock has reached a strong support level and is showing signs of a potential reversal, with bullish cand formation.
Recommendation:
Based on the analysis above, we recommend buying TRENT stock if it breaks 1224 levels, with a stop loss of 1155.70 and a target 1 of 1283 and target 2 of 1358.70. This strategy aims to capitalize on a short-term trend reversal and capture potential profits as the market rebounds.
Disclaimer:
It's essential to keep in mind that the market is highly volatile and unpredictable. Therefore, it's recommended to keep a close eye on the price action, and use stop loss and take-profit levels to minimize risk and maximize returns. It's important to conduct your own research and analysis before making any investment decisions, and always consult a financial advisor before taking any action.
Conclusion:
In conclusion, TRENT stock appears to be breaking out of a range-bound pattern and may be due for a short-term rebound. Technical indicators and price action on the chart also suggest a potential trend reversal. Therefore, buying TRENT stock if it breaks 1224 levels with a stop loss of 1155.70 and a target 1 of 1283 and target 2 of 1358.70 is a recommended strategy for traders and investors looking to capitalize on market movements in the short term.

TRENT BREAKING OUT Trent breaking out 200ema
immediate target can be 1386
keep in mind the sl
for educational purpose

TRENT - Ichimoku Bullish Breakout Stock Name - Trent Limited
Ichimoku Cloud Setup :
1). Today's close is above the Conversion Line
2). Future Kumo is Turning Bullish
3). Chikou span is slanting upwards
All these parameters are showing bullishness at Current Market Price
and more bullishness AFTER crossing 1566
#This is not Buy and Sell recommendation to any one. This is for education purpose and a helping hand to learn trading in Market.
# Cloud Trading
# Ichimoku Cloud
# Ichimoku Followers
I hope you all like my analysis.
Please do share your thoughts into comment section.
Please give a like, it motivates me to do analysis.

TRENT - Triangular Pattern BreakoutTrent has given Triangular pattern Breakout. Looks symmetrical Triangle pattern breakout to me.
It has good support from volume and RSI is also 60.
I think it can give good 200 -300 point move in the short term.
My target is 1800 , SL is 1350.


Trent - Flag and pole in thew makingTrent can be bought on breaking the pole line which is around 1480 levels. diwali si around the corner expecting it to break for a great move. Entry only above the pole line.

Affle India Ltd. Breaking out shall we wait for restest...!!!! Affle India Ltd. Breaking out..iii shall we wait for restest...!!!! What our comunity says you can give your suggestions... iii


Trent short term for buy.Trent market strategy.
Marekt form a sideways pattern and also it was broken in hr tf.
in 15 min tf looks like a Double bottom and also in hr tf market form a swing pattern. when market break the pattern plan to trade.


TRENT - Looking strong above 1130Trent - looking good for a rally above 1130 with couple of buying sessions.
