TRENT : Right Time to Catch Wave?
### 🧠 Chart Context & Wave Overview
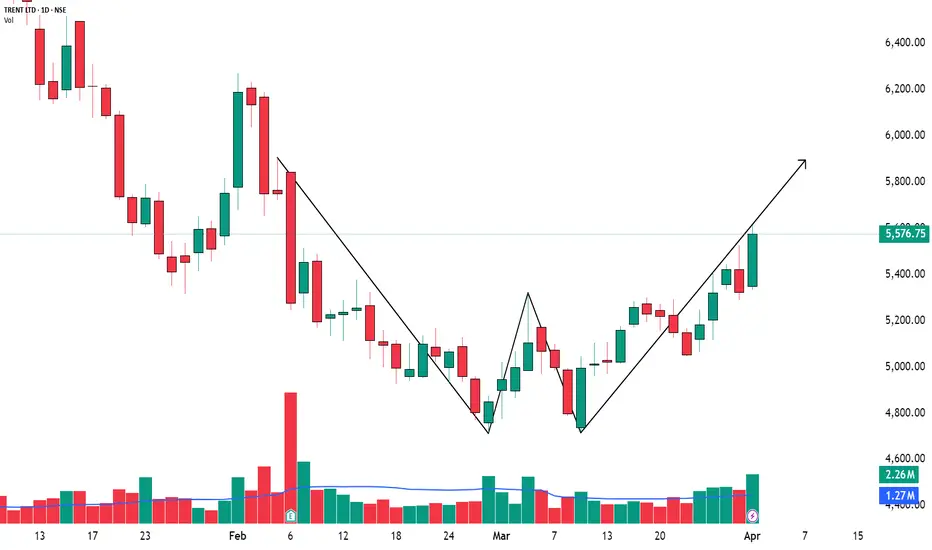
The chart of TRENT LTD (Daily Timeframe) displays a strong Elliott Wave corrective setup , where price action seems to have completed an extended retracement (113%–127%) of the previous swing low .
This zone often marks the final leg of a correction and can lead to the start of a fresh impulsive rally — possibly Primary Wave 5 .
📊 Key Observations:
* Price is consolidating inside the Extended Retracement Zone (₹4,249–₹4,357) .
* Intermediate Wave (a-b-c) structure looks complete.
* Breakout above the long-term trendline (Wave 2–4) will confirm bullish reversal.
---
### 📚 Educational Insights
💡 Extended Retracement Zone (113%–127%):
When corrections go beyond the usual 61.8%–78.6% retracement, it often represents an “overshoot flush” — a zone where weak hands exit and institutional buyers enter.
📘 Elliott Wave Psychology Recap:
Wave 4 corrections tend to be complex and deep , but they provide the last strong entry opportunity before the final impulsive move (Wave 5).
🔁 Character Change in Price Action (ChoCH):
A ChoCH above recent highs indicates the first structural shift — confirming that sellers are losing control and accumulation may be underway.
---
### 🎯 Projection & Price Prediction
* 🟢 Primary Support / Entry Zone: ₹4,249 – ₹4,357
* ⚙️ Extended Retracement Base: ₹4,012 – ₹4,261
* 🔴 Stop-Loss (Closing Basis): Below ₹3,929
* 🎯 First Upside Target: ₹5,850 – ₹6,059
* 🚀 Second Target: ₹7,471
Once the structure confirms reversal above ₹4,600–₹4,750, the probability for a Wave 5 impulse toward ₹7,400+ increases substantially.
---
### 💡 Trading Strategy (Educational Purpose Only)
📈 Entry Plan:
Watch for bullish reversal signals (Hammer / Bullish Engulfing / Double Bottom) in ₹4,250–₹4,350 zone.
Aggressive traders can accumulate early with SL below ₹3,929.
Conservative traders can wait for confirmation above ₹4,700.
🎯 Targets:
• Target 1 → ₹5,850 – ₹6,059
• Target 2 → ₹7,471 (Extended Wave projection)
⚖️ Risk Management:
• Risk only 1–2% per trade 💰
• Avoid aggressive averaging during corrections
• Wait for structure + volume confirmation before scaling
---
### 🧩 Educational Takeaways
✅ Extended retracement zones often represent strong demand and accumulation phases.
✅ A ChoCH or structure breakout gives early reversal confirmation.
✅ Wave 5 rallies are often sharp and impulsive — rewarding patient traders.
✅ Combining Elliott Wave + Fibonacci + Price Action improves accuracy and timing.
---
### 📊 Summary & Outlook
TRENT LTD is holding firm within its extended retracement base (₹4,250–₹4,350) , signaling exhaustion of sellers.
A breakout above the trendline resistance could trigger a strong Wave 5 impulse toward ₹5,850 initially and ₹7,400+ eventually.
Patience and confirmation remain key to capturing this move effectively. ⚡
---
### ⚠️ Disclaimer
I am not a SEBI-registered analyst .
This analysis is purely for educational and informational purposes and should not be considered financial advice.
Please consult your financial advisor before taking any trading positions.
Trentlong

Strong bullish breakout🚀 TRENT LTD Trade Setup - STWP Indicator Insights 🚀
💹 Strong bullish breakout in TRENT LTD! Here’s the setup:
🔹 Entry: ₹5614.95
🔹 Stop Loss: ₹5280 (Risk: ₹334 per share)
🔹 Target 1: ₹5949 (+₹337 per share)
🔹 Target 2: ₹6284 (+₹670 per share)
📊 Why this trade looks promising?
✅ RSI & Bollinger Band Breakout 📈
✅ Bullish SuperTrend & VWAP support ✅
✅ BB Squeeze-Off Breakout - Potential strong move ahead!
Trading Strategy:
🔸 Safe Approach: Wait for a pullback near ₹5400-₹5500 for entry.
🔸 Aggressive Approach: Hold with SL ₹5280, aim for ₹5949-₹6284!
📉 Risk is limited, rewards are high! Are you taking this trade? Drop your thoughts below! 🔥💬
Trent - Too many opportunitiesStock reaching a strong resistance area of 6585 - 6620
Bears may try to take control again of the stock
Can be sold if get an confirmation in LTF (Hourly) with Sl of 6630
If all goes fine, we may see 6200 area back soon
If it closes above 6630 then stock may go sideways to slow bullish for quite some time (Excellent Straddle Opportunity)
Also area of 7300 -7320 is the highest probability sell area
Caution : Always take confirmation in LTF

TRENT Stock: Key Levels, Trends, and Trading StrategiesTrend Analysis
Primary Uptrend:
The stock has been following a strong upward channel, as shown by the blue trendlines.
Over the past months, the price has consistently respected these trendlines, indicating strong investor confidence and sustained buying pressure.
Current Channel Movement:
The price is trading within a secondary ascending channel, showing shorter-term consolidation within the broader trend.
This setup suggests that while the uptrend remains intact, the stock is in a phase of measured growth.
Key Levels
Support Levels:
₹6,688.75: A critical near-term support level, highlighted in red. This level aligns with the lower boundary of the short-term channel.
₹6,353.25: The major support level that the price must hold to sustain the broader uptrend.
Resistance Levels:
₹7,081.15: A key resistance zone, which the stock has been testing recently.
₹7,234.70 and ₹7,445.10: Further resistances that could come into play if the stock breaks out above ₹7,081.15.
₹7,644.10: The ultimate resistance in the current setup, beyond which the stock could experience strong bullish momentum.
Volume Analysis:
A noticeable volume spike occurred during the last leg of the uptrend, signaling strong accumulation by investors.
Current volume trends are more subdued, suggesting a period of consolidation, which often precedes a breakout.
Key Observations
Bullish Flag Formation:
The stock is forming a bullish flag, a continuation pattern that often leads to further upside. A breakout above ₹7,081.15 could confirm this pattern.
Potential Scenarios
Bullish Case:
If the stock breaks ₹7,081.15 with strong volume, it could rally toward ₹7,234.70 and eventually ₹7,644.10.
Bearish Case:
If the stock breaches ₹6,688.75, the next support at ₹6,353.25 will be crucial to watch.
TRENT stock exhibits strong upward momentum, making it an attractive option for traders. A breakout above ₹7,081.15 could signal further gains, while buying near ₹6,688.75 support levels offers a favorable risk-reward setup. As always, implementing strict stop-loss levels and sound risk management is crucial to handle potential market volatility effectively.

TRENT IN Aggressive UPTRENDTRENT in strong bullish trend and currently in a Pole & Flag pattern. I have placed the targets on the trendlines, follow after you crosscheck with your study. There's a volume imbalance zone,too.
NOTE: I'm not a SEBI REG. Study before investing.

Trent All time HighTrent india retail sector company continue show the positive trent currently the share is brackout in the all time hight level. The price is also follow in the Channel.
i am bullish on the share and my stop loss is higher time frame is channel lower point.
Note:- This is only for education purpose, if you support kindly subscribe youtube channel

TRENT CUP AND HANDLE Trent looking with cup and handle Pattern
IT WILL BE GOOD STOCK FOR GOOD RETURN

TRENT Long Buying: A Smart Move According to Technical AnalysisThis report aims to provide a technical analysis of TRENT stock and a recommendation for buying the stock in the short term. The analysis is based on the latest charts and indicators, and is intended for investors and traders who are looking to capitalize on market movements.
Background:
Trent Limited is an Indian retail and lifestyle company. The company's stock is listed on the National Stock Exchange of India (NSE) and is widely followed by investors and traders.
Analysis:
The TRENT stock has been in a range-bound pattern for the past few months, but recent price action suggests that the stock may be breaking out. The stock has been trading in a range between 1155.70 and 1224, and a breakout above 1224 could signal a short-term trend reversal.
The technical indicators are also pointing to a potential buying opportunity. The Relative Strength Index (RSI) has been trending higher and is currently at oversold levels, indicating that the market is oversold and may be due for a rebound. Additionally, the Moving Average Convergence Divergence (MACD) histogram has crossed above the zero line, suggesting that the trend is gaining momentum.
Furthermore, price action on the chart shows that the stock has reached a strong support level and is showing signs of a potential reversal, with bullish cand formation.
Recommendation:
Based on the analysis above, we recommend buying TRENT stock if it breaks 1224 levels, with a stop loss of 1155.70 and a target 1 of 1283 and target 2 of 1358.70. This strategy aims to capitalize on a short-term trend reversal and capture potential profits as the market rebounds.
Disclaimer:
It's essential to keep in mind that the market is highly volatile and unpredictable. Therefore, it's recommended to keep a close eye on the price action, and use stop loss and take-profit levels to minimize risk and maximize returns. It's important to conduct your own research and analysis before making any investment decisions, and always consult a financial advisor before taking any action.
Conclusion:
In conclusion, TRENT stock appears to be breaking out of a range-bound pattern and may be due for a short-term rebound. Technical indicators and price action on the chart also suggest a potential trend reversal. Therefore, buying TRENT stock if it breaks 1224 levels with a stop loss of 1155.70 and a target 1 of 1283 and target 2 of 1358.70 is a recommended strategy for traders and investors looking to capitalize on market movements in the short term.

Trent - Flag and pole in thew makingTrent can be bought on breaking the pole line which is around 1480 levels. diwali si around the corner expecting it to break for a great move. Entry only above the pole line.

Trent Analysis !! Broke Out.📈 Trent Ltd. 📉
This broke out from a Resistance Zone of 1175-1200 and closed above it .
On Buy Side I am looking for Targets of 1400-1450.
Target Calculation = 2*(Resistance Level - Last swing low)
StopLoss should be kept below 1125-1150 zone.
It offers 1:2 Risk To Reward.
All Important Supports and Resistances are drawn in chart. All levels are on closing basis.
Please have a look and revert back if you need some more study on it.
Disclaimer : Consult Your Financial Advisor Before Taking Any Decision On This Analysis.

Simple Trade Setup | TRENT | 11-04-2022 [INTRADAY]NSE:TRENT
Observations:
1) On 15min time frame, we can see it has traded below the support channel and now this support channel should work as resistance channel.
Please refer below chart : 15min time frame.
-------------------------------------
Trade Setup for 11-04-2022
1) Don't Jump in to trade at the beginning of the market. Let it get settle for 15-20min first and judge the price action.
2) Everything is mentioned on the chart. I hope it is easy to understand.
3) All the levels will work as support, resistance, entry and exit w.r.t price action near that level.
4) Avoid gap up or gap down chase. Wait and trade between levels.
Please refer below chart for levels.
Hope I made it easy to understand it.
Do comment your doubt or suggestion.
Note: Trade with Strict SL. It may or may not hit all the levels. So one can book profit / loss at respective level considering how price action works near that level.

TRENT: BULLISH BREAKOUTRange breakout with strong weekly closing. One should buy the sock with SL of 1140 and look for the target of 1360/1440 in coming weeks

#TRENT breakout NSE:TRENT
Trent Limited has just given strong breakout. above 1284 one can go long for mentioned target with given stop loss on chart.
******whatever charts or levels or ideas we are sharing here or on any other platform are just for educational purpose only, not a recommendation. Please do your own analysis before taking any trade on it. We are not SEBI registered.


TRENT Swing tradeCup and Handle pattern.
Trade with caution, use approprite position sizing and risk management.
