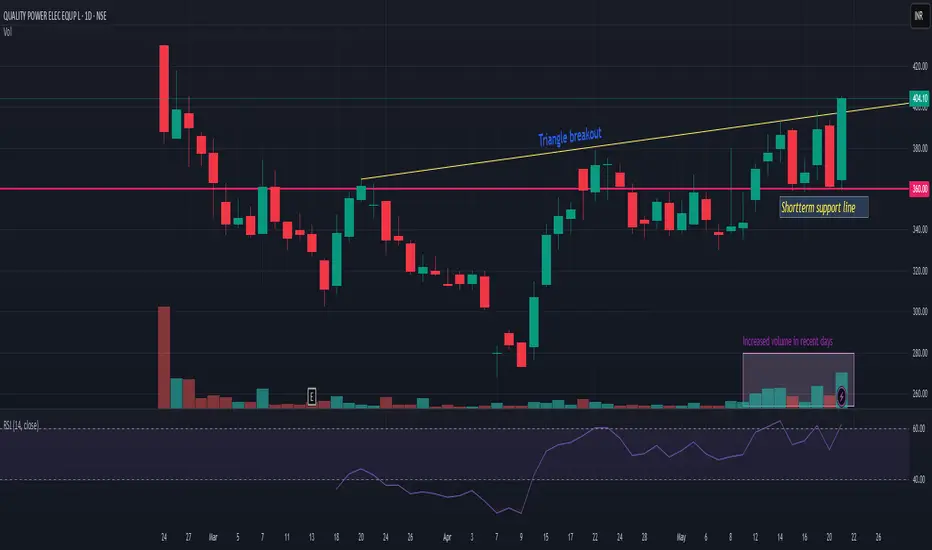
QPOWERQPOWER is recently listed IPO stock and now it has given triangle breakout with decent volume. 355-60 is very strong support. Closing below this may change my view. Upper side we may see momentum till 470-510. Risk reward is quite favorable. Another thing which i observed is today it is trading at all time high volume after listing day. So probability of holding and continuing momentum is quite high. keep it on radar.
Triangle
silver in triangle breakout. Two possibilities. one is impulisveElliott Wave Analysis:-
1st possibility:-
Silver is in a triangle breakout . if it is getting towards upside breakout then we have a nice opportunity of pullback and and we can add it if the pullback occurs. else we can enjoy this journey quietly.
2nd possibility:-
Silver had already made a pullback towards down side breakout. Once it start the way it will fly towards downside and then it will complete a C wave in whole B wave then upside C wave will be impulsive.
This type 2 will be discussed in next chart. I will post it as seperately chart for clear understanding .
I am not a SEBI registered advisor. Before taking a trade do your own analysis or consult a financial advisor. I share chart for education purpose only. I share my trade setup.
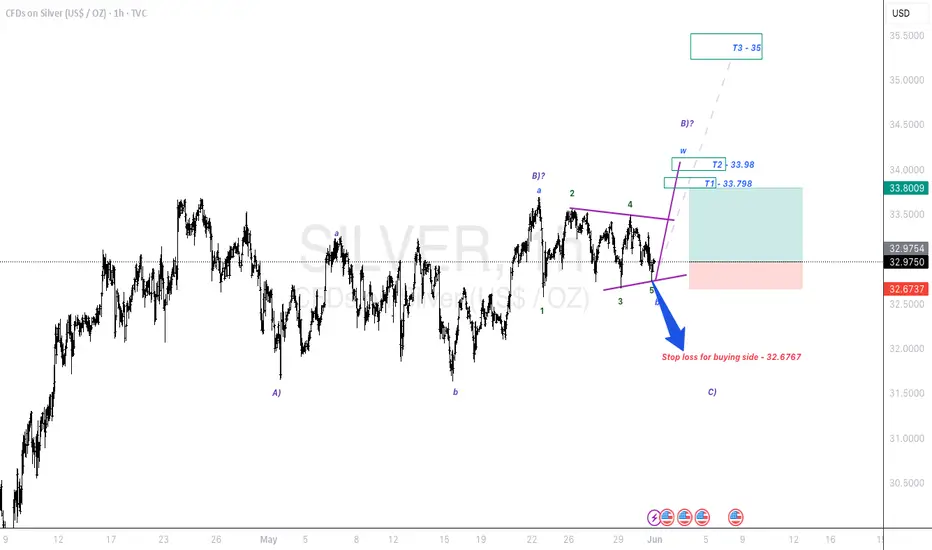
The buy position is better than the sell positionStick to your strategies
Given the formation of the ascending triangle pattern, it is very likely that long positions will bring more profit to traders than short positions in the coming days (currently, the pullback is completed to the chord of the triangle)

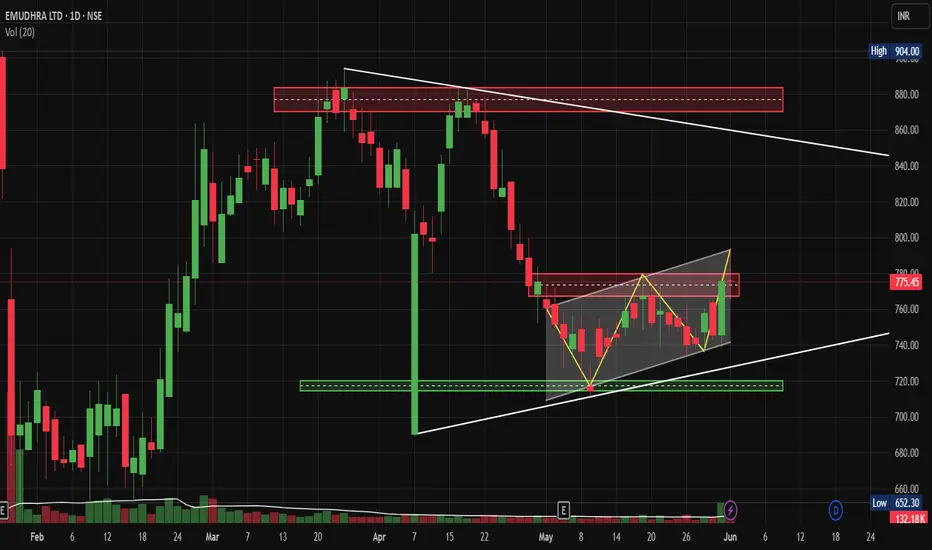
Emudhra Watchlist StockEmudhra's Triangle Breakout Drama: Why This Digital Security Stock Could Rally 15% from Current Levels
Price Action:
Looking at Emudhra's daily chart, we're witnessing a textbook technical setup that could offer substantial rewards for patient traders. The stock has been consolidating in a well-defined triangle pattern since late April, with price action compressed between converging trend lines around 720-780 levels.
The current price action shows Emudhra testing the upper boundary of this Wedge formation at approximately 775-780 resistance zone. What's particularly interesting is how the stock has maintained its position above the key psychological level of 750, suggesting underlying strength despite the recent market volatility.
Volume Action:
From a volume perspective, we've seen relatively subdued activity during this consolidation phase, which is typical behaviour within triangle patterns. However, any breakout above 780 with accompanying volume surge would validate the bullish continuation thesis.
The base formation here spans roughly 6-8 weeks, providing sufficient time for weak hands to exit and strong accumulation to occur. Support levels are clearly defined at 720 (triangle lower boundary) and 700 (psychological support), while immediate resistance sits at 780, followed by the major level at 880.
The triangle pattern, combined with the stock's position above key moving averages, suggests a potential measured move target of around 850-870 levels, representing approximately 10-15% upside from current levels.
Trade Setup:
Entry: 782-785 on breakout with volume confirmation
Target 1: 820 (initial resistance)
Target 2: 850-870 (measured move target)
Stop Loss: 750 (below triangle support)
Risk-Reward Ratio: Approximately 1:2.5
Risk management is crucial here - the stop loss at 750 provides a reasonable buffer while maintaining favourable risk-reward dynamics. Traders should wait for a decisive breakout above 780 with at least 50% higher than average volume to confirm the pattern completion.
Sectoral Backdrop:
The digital security and cybersecurity sector has been gaining traction globally, with increasing digitization post-pandemic driving demand for authentication and security solutions. Emudhra operates in the digital trust space, providing digital signature solutions and PKI services, which positions it well for the ongoing digital transformation wave.
Fundamental Backdrop:
While technical analysis drives this setup, Emudhra's business fundamentals appear supportive, with the company's focus on digital identity solutions aligning with government initiatives like Digital India. The increasing adoption of digital signatures across various sectors provides a favourable operating environment for sustained growth.
Risk Factors:
Technical Risks:
- False breakout possibility if volume doesn't support the move
- A broader market correction could invalidate the pattern
- Failure to hold 750 support would signal a pattern failure
Fundamental Risks:
- Intense competition in the digital security space
- Regulatory changes affecting the business model
- Economic slowdown impacting enterprise spending
- Technology disruption in authentication methods
My Take:
The key catalyst to watch would be any major contract announcements or regulatory developments that could trigger the breakout. Given the tight consolidation and technical setup, this stock deserves a spot on active traders' watchlists for the coming weeks.
Keep in the Watchlist.
NO RECO. For Buy/Sell.
📌Thank you for exploring my idea! I hope you found it valuable.
🙏FOLLOW for more
👍BOOST if you found it useful.
✍️COMMENT below with your views.
Meanwhile, check out my other stock ideas on the right side until this trade is activated. I would love your feedback.
Disclaimer: "I am not a SEBI REGISTERED RESEARCH ANALYST AND INVESTMENT ADVISER."
This analysis is intended solely for informational and educational purposes and should not be interpreted as financial advice. It is advisable to consult a qualified financial advisor or conduct thorough research before making investment decisions.
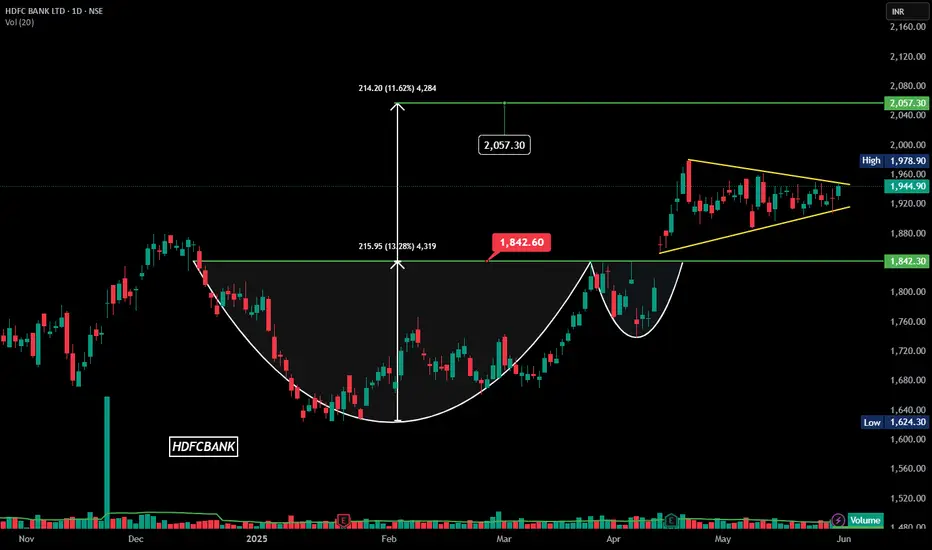
HDFCBANK | Symmetrical Triangle | Daily |Watchlist### **Technical Analysis of HDFC Bank Ltd. (NSE)**
The **daily candlestick chart** of **HDFC Bank Ltd.** highlights key technical patterns, suggesting potential bullish momentum.
### **Key Observations:**
1. **Cup and Handle Formation:**
- A well-defined **cup and handle** pattern is visible, indicating prolonged accumulation.
- Breakout above **1,960.00 INR** confirms bullish sentiment.
- **Projected Target:** **2,057.30 INR**, a **11.62% upside** from breakout.
2. **Symmetrical Triangle Breakout:**
- Price action consolidating within a **symmetrical triangle**, leading to breakout confirmation.
- Strong move above **1,944.90 INR**, validating upward momentum.
3. **Volume & Price Action:**
- **Volume:** **14.37M** surpassing 20-day moving average of **10.13M**, confirming strength.
### **Support & Resistance Levels:**
- **Support:** **1,842.00 INR**, acting as a key cushion in case of pullbacks.
- **Resistance:** **2,057.30 INR**, aligning with the measured move projection.
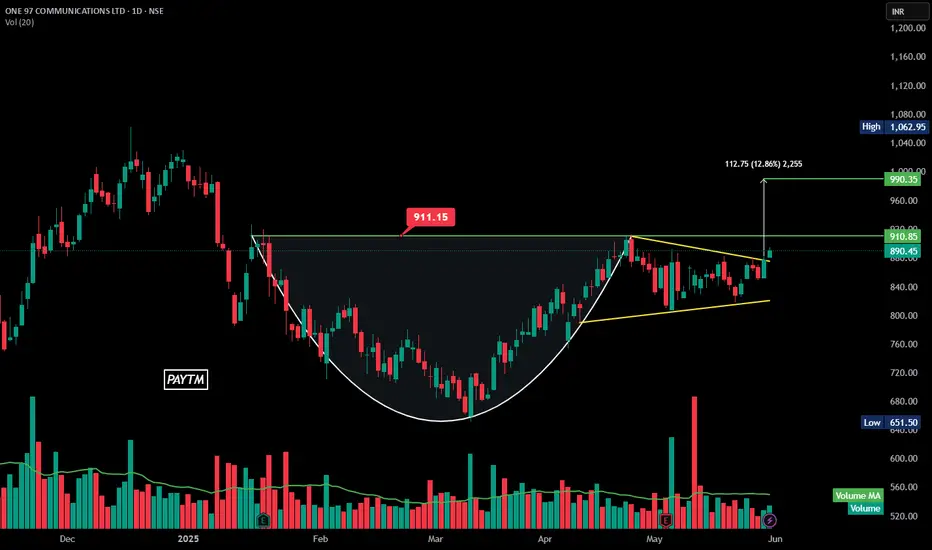
PAYTM | Symmetrical Triangle | Daily ### **Technical Analysis of Paytm (ONE 97 COMMUNICATIONS LTD - NSE)**
The chart highlights a **symmetrical triangle breakout**, signaling potential bullish momentum.
### **Key Observations:
**Symmetrical Triangle Formation:**
- The price oscillated between converging trendlines, forming a tightening range.
- The breakout above the upper trendline confirms bullish continuation.
**Cup and Handle Preceding the Breakout:**
- The earlier **cup and handle** pattern reinforced accumulation before the breakout.
**Breakout Confirmation:**
- **Resistance Level:** **911 INR**—a key level to watch.
- **Target Price:** **990.35 INR**, representing a **12.86% upside** from the breakout point.
**Volume Surge:**
- Increased trading activity during the breakout strengthens the validity of the move.
### **Indicators to Watch:**
- **RSI:58, it confirms strong buying momentum.
- **MACD:** A bullish crossover reinforces trend continuation.
- **Support Level:** **911 INR**—holding above this level strengthens the bullish case.
Venus Pipes Explodes 12% Breaking Out of 6-Month BaseNSE:VENUSPIPES Explodes 12%: Breaking Out of 6-Month Base Could Target ₹1,600 as it made a Beautiful Chart Structure Just Before Q4 FY25 Results.
Price Action Analysis
NSE:VENUSPIPES is experiencing a significant breakout moment, currently trading at ₹1,452.00 with an impressive 12.37% gain (₹159.80). The stock has decisively broken above a critical resistance zone around ₹1,400-1,420 after consolidating in a well-defined base for nearly six months. This breakout comes with strong momentum and represents a potential shift from accumulation to the markup phase.
Volume Analysis:
Volume is exceptionally strong at 626.33K shares compared to the average of 85.02K - nearly 7.5x times normal volume. This massive surge in participation validates the breakout and suggests institutional buying interest. The volume spike coinciding with the price breakout is a textbook confirmation signal that significantly increases the probability of continuation.
Key Support & Resistance Levels:
- Newly Broken Resistance: ₹1,400-1,420 zone (now potential support)
- Next Major Resistance: ₹1,500-1,520 (psychological level and previous resistance)
- Ultimate Target Resistance: ₹1,900-1,950 (red horizontal line - major resistance from earlier highs)
- Strong Base Support: ₹1,100-1,150 zone (multiple green arrows showing successful tests)
- Immediate Support: ₹1,380-1,400 (previous resistance becomes support)
Technical Patterns:
1. Rectangle Breakout: Clean break above the 6-month consolidation range (₹1,100-1,420)
2. Multiple Bottom Formation: Several tests of the ₹1,100-1,150 support zone (marked with green arrows)
3. Ascending Triangle: Recent price action shows higher lows approaching the ₹1,420 resistance
4. Volume Breakout Pattern: Classic high-volume breakout from a prolonged base
Trade Setup - Breakout Continuation
Primary Entry Strategy:
- Entry Point: ₹1,440-1,460 (current levels or minor pullback)
- Aggressive Entry: ₹1,420-1,430 (on any retest of breakout level)
Target Levels:
- First Target: ₹1,520-1,540 (psychological resistance and measured move)
- Second Target: ₹1,650-1,680 (extension target based on base width)
- Ultimate Target: ₹1,800-1,850 (major resistance zone approach)
Risk Management:
- Stop Loss: ₹1,350 (below the breakout zone and recent support)
- Tight Stop: ₹1,390 for short-term traders
- Position Size: Maximum 2-3% of portfolio at risk
Alternative Setup - Conservative Approach
For risk-averse traders:
- Entry: ₹1,480-1,500 (after clearing first resistance convincingly)
- Stop Loss: ₹1,420 (below confirmed breakout level)
- Targets: ₹1,600, ₹1,750
Pattern Analysis:
The stock has formed a solid 6-month base between ₹1,100-1,420, allowing for significant accumulation. The multiple tests of support around ₹1,100-1,150 (green arrows) demonstrate strong buying interest at lower levels. The recent ascending triangle formation within the larger rectangle pattern suggests building momentum that has now been released.
Risk-Reward Assessment:
- Primary Setup R:R: 1:2.8 (Entry ₹1,450, Stop ₹1,350, Target ₹1,730)
- Breakout Target: Rectangle pattern suggests potential for 25-30% move
- Failure Risk: Breakdown below ₹1,380 would invalidate the bullish setup
Key Technical Factors:
The convergence of multiple bullish signals - rectangle breakout, volume confirmation, successful base building, and momentum surge - creates a high-probability setup. The stock has spent considerable time building this base, and the breakout with such strong volume suggests genuine institutional participation rather than retail speculation.
Trading Strategy:
Traders should look for any minor pullbacks to the ₹1,420-1,440 zone as ideal entry opportunities. The key is to ensure the breakout level holds as support. A sustained move above ₹1,500 would confirm the pattern and likely attract momentum buying, potentially accelerating the move toward the ₹1,650-1,700 zone.
Monitor for any evening star or shooting star patterns at resistance levels, which could signal temporary exhaustion and provide profit-taking opportunities.
Keep in the Watchlist.
NO RECO. For Buy/Sell.
📌Thank you for exploring my idea! I hope you found it valuable.
🙏FOLLOW for more
👍BOOST if you found it useful.
✍️COMMENT below with your views.
Meanwhile, check out my other stock ideas on the right side until this trade is activated. I would love your feedback.
Disclaimer: "I am not SEBI REGISTERED RESEARCH ANALYST AND INVESTMENT ADVISER."
This analysis is intended solely for informational and educational purposes and should not be interpreted as financial advice. It is advisable to consult a qualified financial advisor or conduct thorough research before making investment decisions.

AuropharmaDaily time frame shows price is testing trend line resistance, and lower time frame shows price consolidation in the form of symmetrical triangle.
Buy above 1210 with the stop loss of 1200 for the targets 1222, 1234, 1248 and 1264.
Sell below 1178 with the stop loss of 1188 for the targets 1166, 1152, 1138 and 1126.
Break out in these mentioned levels should have volume to reach the targets.
Always do your own analysis before taking any trade.

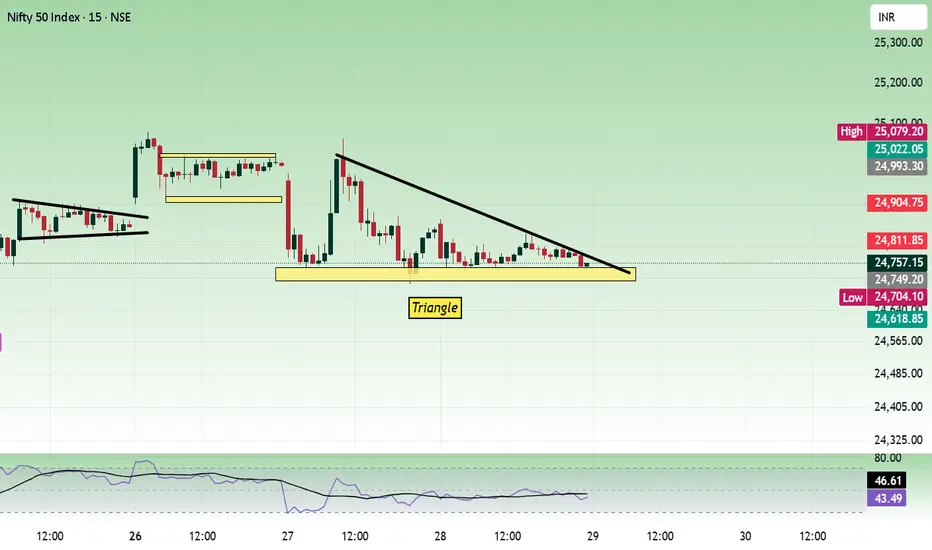
Nifty - May 29 Monthly Expiry analysisToday price moved in a very narrow range. No clear signal to buy or sell and option premium decayed. Consolidation leads to break out, if the range is broken. Resistance is seen at 24800 zone.
Buy above 24840 with the stop loss of 24800 for the targets 24880, 24920, 24980, 25020, 25060 and 25120.
Sell below 24680 with the stop loss of 24720 for the targets 24640, 24600, 24560, 24520, 24480 and 24420.
Expected expiry day range is 24500 to 25100.
Always do your own analysis before taking any trade.
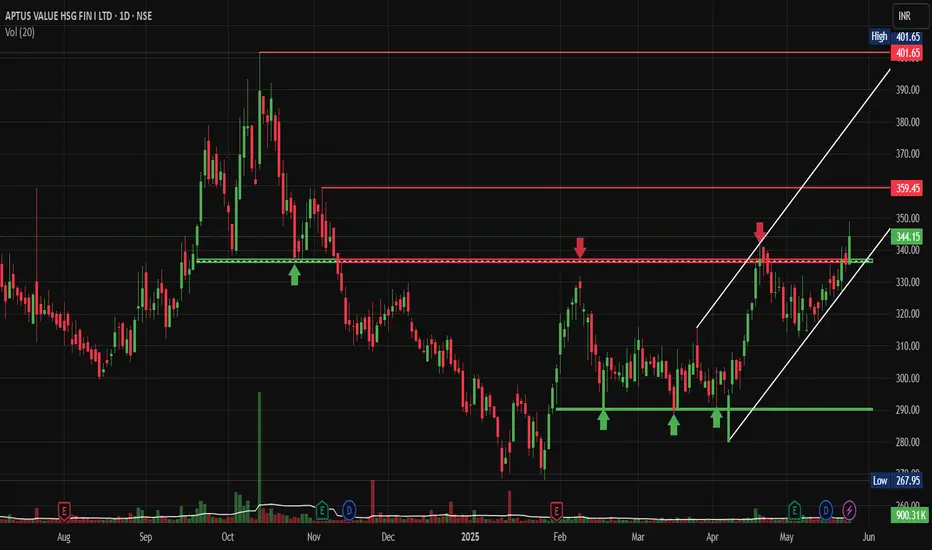
Aptus Rising Channel Pattern with Prior Triple Bottom PatternNSE:APTUS : Rising Channel Pattern with Prior Triple Bottom Pattern Signals Major Reversal - Could This Be the Next Multi-Bagger?
Pattern Recognition & Base Formation:
NSE:APTUS presents a compelling technical setup with a Triple Bottom reversal pattern formed at the ₹267-275 support zone. This pattern, completed over several months from late 2024 to early 2025, represents one of the most reliable bullish reversal formations in technical analysis.
The stock has also carved out a distinct ascending triangle pattern with the upper trendline acting as dynamic resistance around ₹340-350 levels. The recent breakout above this consolidation zone, accompanied by increased volume participation, signals a potential trend change from the prolonged correction phase.
Key Technical Levels Analysis:
Critical Support Levels:
- Immediate Support: ₹330-335 (recent breakout consolidation)
- Major Support: ₹290-295 (triple bottom neckline and 50% retracement)
- Ultimate Support: ₹267-275 (triple bottom base - absolute floor)
Resistance Levels:
- Immediate Resistance: ₹359 (marked horizontal resistance zone)
- Next Target: ₹380-385 (psychological resistance before ATH)
- Ultimate Target: ₹401.65 (all-time high retest)
- Extension Target: ₹420-430 (measured move from triple bottom pattern)
Volume Profile Assessment:
The volume pattern shows significant improvement during the recent bounce from the triple bottom lows. Today's volume at 900.31K represents a 44% increase from the 20-day average, indicating institutional interest returning to the stock.
The volume during the formation of the triple bottom showed classic accumulation characteristics - high volume on declines (smart money buying) and lower volume on any bounces, until the recent breakout attempt.
Technical Pattern Breakdown:
Primary Pattern: Triple Bottom Reversal
- Formation Period: December 2024 - February 2025
- Support Base: ₹267-275
- Neckline: ₹290-295
- Measured Target: ₹350+ (already achieved), next target ₹420-430
Secondary Pattern: Ascending Triangle
- Formation Period: February 2025 - Present
- Base: Rising support from ₹275 to ₹330
- Apex: ₹340-350 resistance zone
- Breakout Status: In progress with volume confirmation pending
Trade Setup Strategy:
Setup Classification: Reversal Play with Pattern Confirmation
Entry Approaches:
- Aggressive Entry: ₹340-345 (current levels on any minor dip)
- Conservative Entry: ₹330-335 (on pullback to breakout support)
- Value Entry: ₹290-295 (if neckline retest occurs - lower probability)
Position Management:
- Initial Position: 1-1.5% portfolio allocation
- Add-on Levels: ₹330-335 (if pullback materialises)
Profit Booking Strategy:
- Target 1: ₹365-370 (6-8% upside) - Book 25% position
- Target 2: ₹385-390 (12-15% upside) - Book 40% position
- Target 3: ₹410-420 (20-25% upside) - Book remaining 35%
Risk Management:
- Tight Stop: ₹325 (5-6% downside for aggressive traders)
- Swing Stop: ₹310 (10% downside for position traders)
- Pattern Stop: ₹285 (below neckline - invalidates bullish thesis)
Sector & Fundamental Backdrop:
Housing finance companies are experiencing renewed interest due to:
- Improving real estate cycle momentum
- Regulatory clarity on lending norms
- Credit growth revival in retail segments
- Government policy support for affordable housing
Risk-Reward Assessment:
Bullish Catalysts:
- Triple bottom completion - highly reliable reversal signal
- Volume expansion during the recent bounce
- Sector tailwinds supporting fundamentals
- Technical breakout from months of consolidation
- Strong support base established at ₹270 levels
Risk Factors:
- Overall market volatility could impact momentum
- NBFC sector sensitivity to interest rate changes
- Need to sustain above ₹340 to confirm breakout
- High beta nature amplifies market moves
Bottom Line:
NSE:APTUS offers an attractive risk-adjusted opportunity with the completion of a triple bottom reversal pattern. The stock appears to be in the early stages of a potential trend reversal after months of base building.
The most prudent approach would be to initiate positions around current levels (₹340-345) with a tight stop below ₹325, targeting the ₹365-370 zone initially. Any pullback to the ₹330-335 support area would present an even better entry opportunity.
The key technical milestone will be a decisive break and hold above ₹350, which would likely trigger the next leg of the move toward the ₹380-400 zone. Until then, trade with defined risk parameters and respect the established support levels.
Keep in the Watchlist.
NO RECO. For Buy/Sell.
📌Thank you for exploring my idea! I hope you found it valuable.
🙏FOLLOW for more
👍BOOST if you found it useful.
✍️COMMENT below with your views.
Meanwhile, check out my other stock ideas on the right side until this trade is activated. I would love your feedback.
Disclaimer: "I am not SEBI REGISTERED RESEARCH ANALYST AND INVESTMENT ADVISER."
This analysis is intended solely for informational and educational purposes and should not be interpreted as financial advice. It is advisable to consult a qualified financial advisor or conduct thorough research before making investment decisions.
Sensex - Expiry day analysis May 27Last week price has formed a bull flag formation and we got the break out today. And today's move has formed a symmetrical triangle. Near by resistance is at 82500 and support is at 81900. Price have to gain strength to break this range.
Buy above 82140 with the stop loss of 82040 for the targets 82220, 82360, 82480, 82600, 82720 and 82840.
Sell below 81860 with the stop loss of 81960 for the targets 81780, 81700, 81560, 81460, 81340 and 81260.
Always do your own analysis before taking any trade.

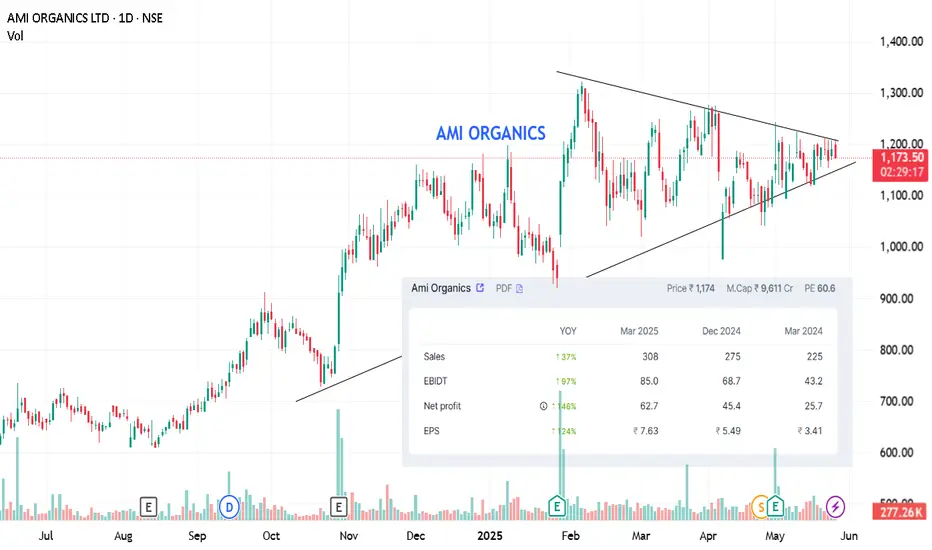
AMI ORGANICS: RANGE and TRIANGLE with strong Q results, ami organics is set to break the consolidation range with stong momentum, early setup has advantage.
keep your risk reward in check and can become a good script.
Multi-Month Triangle Breakout Can Signal Move to ₹750+NSE:TIPSMUSIC Made a Beautiful Chart Structure Today and Breaks Free of Multi-Month Triangle Breakout and Could Signal Explosive Move to ₹750+
Price Action Analysis:
NSE:TIPSMUSIC is currently trading at ₹676.80, up 3.68% (₹24.00) today. The stock has been consolidating in a narrowing range since January 2025, forming a classic symmetrical triangle pattern. After testing the lower support multiple times around ₹580-600, the stock is now approaching the apex of the triangle and showing signs of a potential upside breakout. The recent price action shows higher lows being formed, indicating growing buying interest at lower levels.
Volume Analysis:
Volume is healthy at 319.61K shares, significantly above the average of 192.25 K. The increased participation suggests growing interest as the stock approaches a crucial decision point. Volume patterns show consistent buying support during dips to the triangle's lower boundary, while recent sessions have seen upticks in volume accompanying the move higher.
Key Support & Resistance Levels:
- Immediate Resistance: ₹720-730 zone (upper triangle boundary and previous resistance)
- Major Resistance: ₹750-760 (prior swing high from December)
- Triangle Support: ₹580-600 zone (marked with green arrows - multiple successful tests)
- Key Support: ₹560-570 (breakdown level that would invalidate the pattern)
- Dynamic Resistance: Descending trendline from November highs
Technical Patterns:
1. Symmetrical Triangle: Well-defined triangle formation since January, with converging trendlines
2. Triple Bottom: Multiple successful tests of the ₹580-600 support zone (green arrows)
3. Ascending Triangle Element: The recent higher lows suggest buyers are becoming more aggressive
4. Compression Pattern: Decreasing volatility as price approaches the triangle apex, typically before significant moves
Trade Setup - Breakout Play:
Entry Strategy:
- Primary Entry: ₹695-700 on confirmed breakout above triangle resistance with volume
- Secondary Entry: ₹680-685 on any pullback to current levels (anticipatory entry)
Targets:
- First Target: ₹730-735 (immediate resistance)
- Second Target: ₹760-770 (measured move from triangle base)
- Final Target: ₹800-820 (extension target based on triangle height)
Risk Management:
- Stop Loss: ₹640 (below recent swing low and triangle support)
- Tight Stop: ₹660 for aggressive traders
- Position Size: Maximum 2% of portfolio at risk
Alternative Setup - Continuation Play
For conservative traders waiting for confirmation:
- Entry: ₹735-740 (after clearing first resistance zone)
- Stop Loss: ₹695 (below breakout level)
- Targets: ₹780, ₹820, ₹860
Risk-Reward Analysis:
- Primary Setup R:R = 1:2.5 (Entry ₹690, Stop ₹640, Target ₹770)
- The triangle pattern suggests a potential 15-20% move upon breakout
- A failed breakout risk exists if volume doesn't confirm the move
Key Catalysts to Watch:
The stock appears to be in the final stages of its triangle consolidation. A breakout above ₹720 with strong volume (above 400K shares) would confirm the pattern and likely trigger momentum buying. Conversely, a breakdown below ₹640 would invalidate the bullish setup and could lead to a test of ₹560-570 levels.
The decreasing volatility and tightening price range suggest a significant move is imminent. Given the multiple successful tests of support and the overall market context, the probability favours an upside resolution, making this an attractive risk-reward setup for both swing and position traders.
Traders should monitor volume closely on any breakout attempt, as genuine breakouts from triangle patterns typically require volume confirmation to sustain the move.
Keep in the Watchlist.
NO RECO. For Buy/Sell.
📌Thank you for exploring my idea! I hope you found it valuable.
🙏FOLLOW for more
👍BOOST if you found it useful.
✍️COMMENT below with your views.
Meanwhile, check out my other stock ideas on the right side until this trade is activated. I would love your feedback.
Disclaimer: "I am not a SEBI REGISTERED RESEARCH ANALYST AND INVESTMENT ADVISER."
This analysis is intended solely for informational and educational purposes and should not be interpreted as financial advice. It is advisable to consult a qualified financial advisor or conduct thorough research before making investment decisions.

Lodha - Taking rejection at the trendlineTaking rejection at declining trendline on daily timeframe. Bearing engulfing is seen. SL could be just above the trendline.

MothersonMotherson triangle pattern formed.
Buy if upside resistance broke and sell if downside support broke..wait for sustains above resistance level and below support level.

Ascending triangle pattern which might be long termOverall, a massive long-term stock
Can be played for short term in bouts too
At this level looks like an add
AKUMSAKUMS seems stronger and given triangle breakout. Volume is also very decent as its just 1st hour of trading and almost nr previous day volume. We may see momentum rally nearing 12-15% from here as long as its closing above this trendline it may continue to outperform. Risk reward is quite good. Result is on 26th may. Keep it on radar

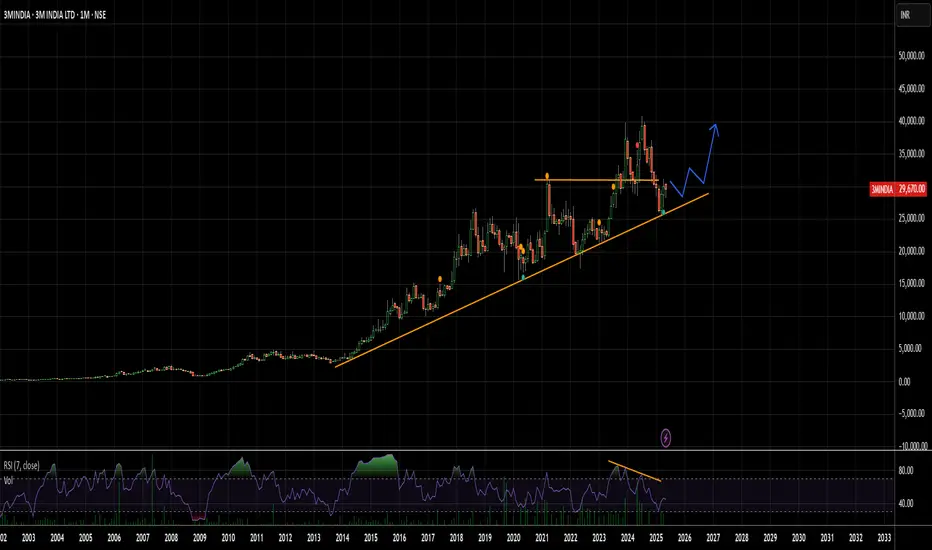
Flag and Pole in Styrenix what was the old INEOS StyrolutionOverall the pattern shows that a convergence is happening at this level
When we look at the stock over a long period of time, what I realise is that the patterns are repetitive and it has not participated in the bull market as much as the other stocks.
Looking at the shareholding pattern also we can understand that the no.l of shareholders in this counter are only 45,000 which means only savvy and old timers what knew this counter and IPO investors are there rather than catching the frenzy of FNO and traders and mass allotments.

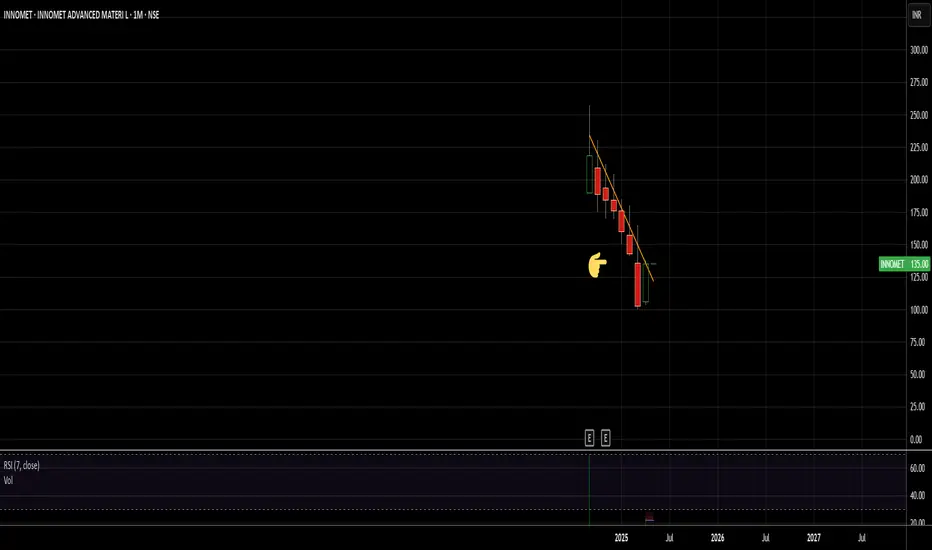
A leader in Powder MetallurgyNSE:INNOMET Innomatt Advanced Materials: Pioneering Excellence in Powder Metallurgy and Specialised Materials
As a metallurgist with a Ph.D. in Materials Science, I have always been fascinated by the transformative potential of advanced materials in cutting-edge industries. One company that stands out in this domain is Innomatt Advanced Materials, a Hyderabad-based leader in powder metallurgy, sintering, and precision casting. Their expertise caters to some of India’s most prestigious organisations, including the Defence Research and Development Organisation (DRDO) and the Indian Space Research Organisation (ISRO), supplying high-performance materials that meet stringent aerospace and defence requirements.
A Trusted Partner for R&D and Academia
Innomatt’s clientele extends beyond government agencies to premier academic and research institutions such as IITs and NITs, where innovative materials are essential for breakthroughs in engineering and technology. Whether it’s developing intricate components or custom alloys with exacting specifications, Innomatt excels in delivering solutions through powder metallurgy—a process that ensures superior density, strength, and consistency compared to traditional manufacturing methods.
Specialised Applications with Future-Ready Potential
The applications of Innomatt’s materials are vast and continually expanding. From high-temperature alloys for space exploration to wear-resistant components for defence systems, their products are engineered for extreme conditions. As industries increasingly demand lightweight, durable, and high-performance materials, powder metallurgy is poised to play an even greater role in sectors like:
Aerospace & Defence (critical engine parts, armour systems)
Automotive (high-strength, fuel-efficient components)
Energy (materials for nuclear and renewable energy systems)
Medical Technology (biocompatible implants and surgical tools)
A Legacy of Expertise and Reliability
What sets Innomatt apart is its well-established leadership, with promoters who bring over a decade of experience in advanced materials manufacturing. Their deep industry knowledge, combined with a commitment to innovation, ensures that they remain at the forefront of material science advancements.
For researchers, engineers, and industries seeking bespoke material solutions, Innomatt Advanced Materials is not just a supplier—it’s a strategic partner in shaping the future of high-performance materials.
Have you worked with specialised materials in your field? Share your thoughts on how powder metallurgy is transforming modern manufacturing!
#AdvancedMaterials #PowderMetallurgy #DRDO #ISRO #Innovation #MaterialsScience #EngineeringExcellence
CONCOR – Triangle Breakout with Fib Targets in SightCONCOR After weeks of coiling inside a symmetrical triangle, CONCOR has finally broken out above key resistance near ₹705 — backed by strong volume and price action.
Current Price: ₹730.50
Highlights:
Triangle Breakout Zone: ₹702.15 (Fib 38.2%)
Next Key Levels: ₹764.70 & ₹809.25 (61.8% & 78.6%)
Strong Support Zone: ₹663–₹645 (Fib 23.6% & horizontal base)
Also reclaiming the 200 EMA powerful trend confirmation.
Structure + Breakout + Fib Confluence = High Probability Setup
A close above ₹735+ may ignite momentum toward ₹767+ & ₹858+ zones.
Keep it on your radar.
#CONCOR #ContainerCorp #BreakoutAlert #TrianglePattern #FibLevels #NSEStocks #MomentumTrade #BullishBreakout #SwingTrading #IndianStocks #TradingSetup #ChartAnalysis #TechnicalBreakout #PriceAction

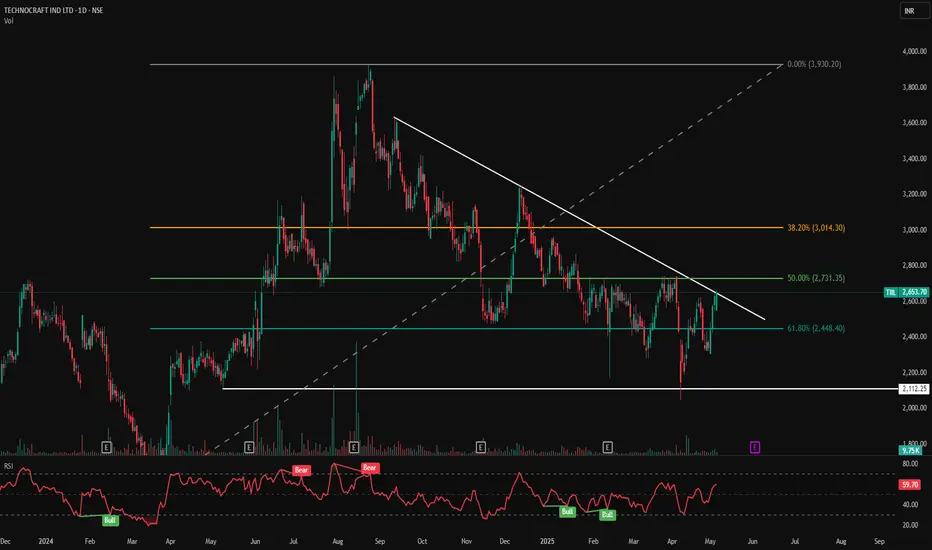
TILL - Descending Trendline Breakout Watch📊 TIIL – Descending Trendline Breakout Watch | Key Fib Retest in Play
🕰️ Timeframe: 1D | 🧭 Pattern: Descending Triangle | 🎯 Fibonacci Reversal Setup
📈 Technical Analysis Summary:
TIIL is currently approaching a major trendline resistance, drawn from its all-time high. After a long downtrend, the stock is now testing the 50% Fibonacci retracement level at ₹2,731.35 with rising momentum.
The price is hovering near a breakout zone and consolidating just below resistance, hinting at potential bullish continuation. A successful breakout can open gates to much higher levels, especially toward the 38.2% Fib zone and beyond.
🔍 Chart Highlights:
⚪ Descending Trendline: Key multi-month resistance line
🟢 Current Price Action: Holding above 61.8% Fib (₹2,448.40) and pushing toward 50% zone (₹2,731.35)
🔵 Base Support: ₹2,112.25 (previous structure low)
📈 Volume: Gradual build-up near resistance zone
🔴 RSI (14): Currently at 59.70 – neutral-to-bullish, showing higher lows
📍 Bullish RSI Icons: Highlighted near recent bottoms, indicating accumulation zones
📌 Support & Resistance Levels:
Type Level (₹)
🔼 Resistance 1 2,731.35 (Fib 50%)
🔼 Resistance 2 3,014.30 (Fib 38.2%)
🔻 Support 1 2,448.40 (Fib 61.8%)
🔻 Support 2 2,112.25 (Major horizontal support)
🧭 Trading Setup Overview:
✅ Bias: Bullish if price breaks and closes above trendline and ₹2,731
💡 Entry Watch: Break and hold above ₹2,731.35 with volume
🛑 Invalidation: Close below ₹2,448.40 (61.8% Fib)
🎯 Upside Targets: ₹3,014 → ₹3,500+ (based on structure)
💬 Conclusion:
TIIL is at a critical juncture with a high-probability trendline breakout setup in play. The Fibonacci confluence, improving RSI, and rising volume indicate a bullish bias. Watch for a strong breakout candle above ₹2,731 for potential positional opportunities.
⚠️ Disclaimer: This chart is shared for educational purposes. Kindly consult your financial advisor before making any trading decisions.
🔔 Follow @PriceAction_Pulse for more high-probability swing setups and technical chart breakdowns!
📌 Save & share if TIIL is on your breakout watchlist!
PREMEXPLN - Cup & Handle Breakout | Volume Surge📊 PREMEXPLN – Cup & Handle Breakout | Volume Surge + Key Fibonacci Confluence!
🕰️ Timeframe: 1D | 📐 Pattern: Cup & Handle | 📊 Momentum: Bullish
📈 Technical Chart Overview:
Premier Explosives has executed a clean breakout above a long-term descending trendline and a cup & handle base with a massive spike in volume, hinting at a powerful trend reversal.
Price surged nearly +19% intraday, confirming strength near the 61.8% Fibonacci retracement from the previous swing high at ₹910.30 to the swing low at ₹253.40.
🔍 Chart Highlights:
☕ Cup & Handle Pattern: Formed over several months, signaling accumulation and breakout
📐 Descending Trendline: Broken with strength and volume confirmation
📊 Volume Spike: Volume highest since April 2024 – strong buyer interest
🟢 Breakout Zone: ₹472.65–₹480.00 (key previous resistance)
🔴 RSI (14): At 67.72 – approaching overbought zone, suggesting strong momentum
🧱 Support & Resistance Levels:
Level Type Price (₹)
🔼 Resistance 1 504.10 (Fib 61.8%)
🔼 Resistance 2 581.10 (Fib 50%)
🔼 Resistance 3 659.90 (Fib 38.2%)
🔻 Support 1 440.00 (Breakout Retest Zone)
🔻 Support 2 308.75 (Horizontal demand zone)
🔻 Support 3 253.40 (100% Fib low)
🔧 Indicators Used:
Fibonacci Retracement – Plotted from ₹910.30 to ₹253.40
RSI (14) – Showing bullish divergence and breaking out of consolidation
Volume Bars – Confirming breakout with institutional strength
Bull/Bear Icons – Track momentum shifts visually over RSI
🧭 Trade Outlook:
✅ Bias: Bullish
🛒 Entry Zone: Retest near ₹472.65–₹480 (ideal pullback entry)
🎯 Targets: ₹504 → ₹581 → ₹660+
❌ Invalidation: Close below ₹440 with volume
💬 Summary:
PREMEXPLN looks strong on the daily chart after breaking a classic cup & handle pattern with volume confirmation. The breakout aligns perfectly with Fibonacci retracement zones, suggesting room for continued upside. Monitor for a potential retest entry.
⚠️ Disclaimer: This is a technical analysis chart for educational purposes only. Do your own research and consult a financial advisor before trading.
🔔 Follow @PriceAction_Pulse for more breakout charts, swing trades & price action insights!
💾 Save and share if PREMEXPLN is on your watchlist this week.

