Bharti Airtel Cmp 1717 dated 14-2-2025Bharti Airtel Cmp 1717 dated 14-2-2025
1. Ascending Triangle BO @ 1685
2. Price rise with Volumes
3. RSI BO
Buy above 1725 SL 1680 target 17401750-1760-1770-1780
Pattern target 1860 SL 1585
Triangle

NaturalgasThe chart is self-explanatory and shared only for educational purposes. Natural gas has shown a clear indication of reversal from support and also displayed a clear triangle breakout, indicating potential for upward movement. A stop-loss must be followed.

MANAPPURAM FINANCE LTD - APPROACHING RESISTANCE AREASymbol - MANAPPURAM
Manappuram Finance Ltd. has been experiencing a recovery from lower levels in recent weeks. The stock has bounced back from support zones and is now testing key resistance areas. However, it faces considerable challenges at higher levels, showing signs of consolidation as it approaches its resistance zones.
The overall trend appears to be in recovery, following a significant dip. However, the stock is facing resistance at higher levels, indicating a potential pause or consolidation before any significant movement.
Short-term trend looks slightly bearish, as the stock has encountered selling pressure at resistance levels and is currently consolidating. Long-term trend remains positive, driven by the company’s strong fundamentals in the gold loan market.
The stock is currently trading within an ascending triangle pattern and is consolidating near key resistance levels. My personal bias is towards the downside, and we could potentially see a sell-off from the resistance zone towards the triangle support trendline, with the possibility of a move below it.
The trade strategy could involve looking for short opportunities near the resistance zone, especially if the stock fails to break out and begins to reverse. However, if the stock manages to break above the resistance trendline of the ascending triangle, the bias would shift to the upside.
Disclaimer - Do not consider this as a buy/sell recommendation. I'm sharing my analysis & my trading position. You can track it for educational purposes. Thanks!

NUVOCOAs Prakashplutus sir said,
"Cement
Cement
Cement
Cement
Cement"
Extrapolating further, this scrip has been steadfast even during the recent fall and holding this for sometime now.
#triangle pattern

Ascending Triangle Pattern Breakout in Bajaj FinanceThe chart of **Bajaj Finance Ltd. (NSE: BAJFINANCE)** on the **weekly timeframe** shows a **recent breakout from an ascending triangle pattern**.
### **Ascending Triangle Pattern Breakout:**
1. **Structure of the Pattern:**
- The **horizontal resistance** zone (highlighted in blue) was previously tested multiple times, around **7,768 - 8,000**.
- The **ascending trendline** (in purple) has consistently provided higher lows, forming the base of the triangle.
- The price was **squeezing between the resistance and the ascending trendline**, creating buying pressure.
2. **Breakout Confirmation:**
- The price has successfully broken above the resistance **with strong bullish momentum**.
- A significant **green breakout candle** suggests strong buying interest.
- The breakout occurred after multiple rejections at resistance, indicating **accumulation before the breakout**.
3. **Retest Possibility:**
- Price may pull back toward the **7,768 - 8,000 zone** to **retest the breakout level as new support** before continuing its upward move.
- A successful retest would confirm the breakout and strengthen bullish confidence.
4. **Target Projection:**
- The **height of the ascending triangle** (from the base near 6,400 to the resistance around 8,000) is approximately **1,600 points**.
- Applying this range to the breakout point suggests a potential **target of around 9,600 - 9,800**.
### **Conclusion:**
- The **ascending triangle breakout** is a strong bullish signal.
- The price may **retest the breakout zone before continuing higher**.
- **Long-term trend remains bullish**, supported by the trendline and momentum.

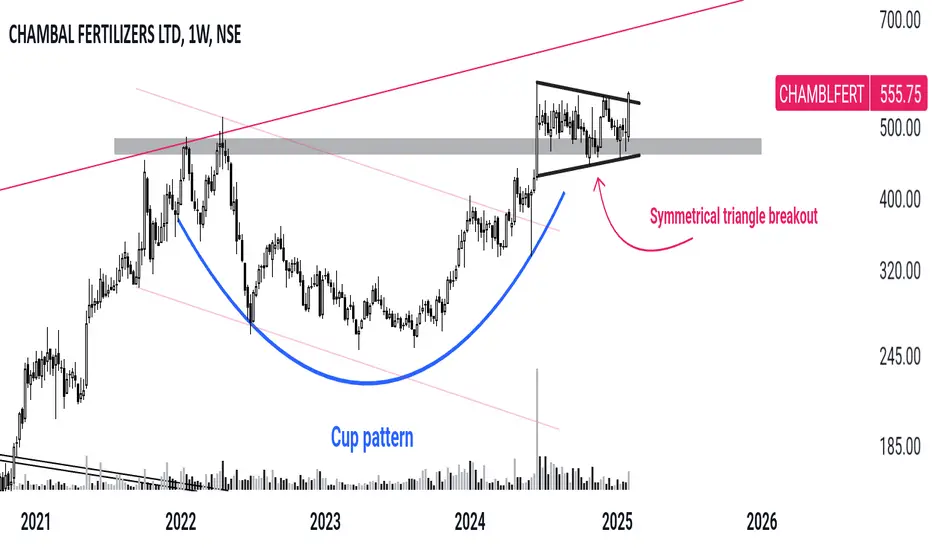
#CHAMBLFERTCup pattern breakout ✔️
RETEST ✅
Symmetrical triangle breakout ✔️
Volume ✔️
Pattern 👍
Price in ascending channel 👍
Pre and Post Breakout with Pattern trading I make educational content videos for swing / positional trading

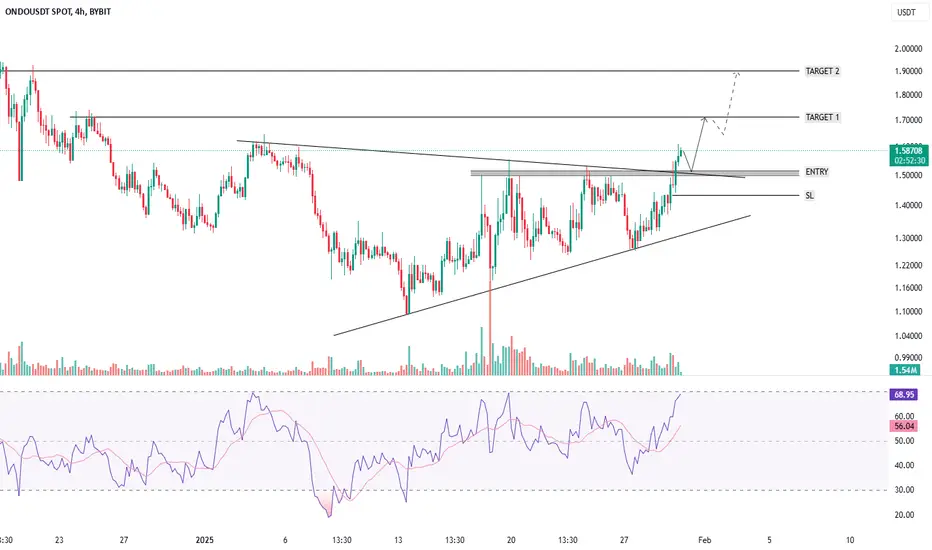
ONDOUSDT - TRIANGLE PATTERN BREAKOUT - BULLISH OUTLOOKSymbol - ONDOUSDT
ONDOUSDT continues to demonstrate an upward trend, with periodic cyclical counter-trend corrections. The chart is currently indicating a potential conclusion of the correction phase, suggesting a readiness for further upward movement. A significant consolidation pattern has developed within the context of the prevailing uptrend. In this regard, the price is attempting to break above the consolidation resistance (triangle) and surpass the next key resistance level at 1.538. This level is of particular importance. Should the bulls successfully maintain support above 1.538, ONDO may experience a recovery towards the 1.7–1.9–2.15 range in the short to medium term.
Support levels: 1.538, 1.44
Resistance levels: 1.7344, 1.90
A minor pullback to support, followed by a false breakdown, remains a possibility. However, sustained price consolidation above this level would confirm readiness for upward movement. Entry, SL & Target levels are indicated on the chart.
Ascending Triangle Pattern in BAJAJ FINANCEChart Analysis & Trade Setup
Stock: Bajaj Finance Ltd (NSE)
Timeframe: 1W (Weekly Chart)
Technical Analysis:
Resistance Zone (Orange Region):
The price has faced multiple rejections in this zone historically.
The stock has now broken above this resistance, signaling a potential breakout.
Support Levels:
Purple Trendline: Long-term ascending trendline acting as dynamic support.
Blue Zones: These levels indicate past significant buying areas.
Breakout Confirmation:
Trade Plan:
Entry: Around ₹7,899 - ₹8,000, post-breakout confirmation.
Stop Loss (SL): Placed at ₹7,600 (below breakout zone).
Target: ₹10,000 (based on breakout projection and past price action).
Risk-to-Reward (RR) Ratio:
Target Gain: ₹2,000 (from ₹8,000 to ₹10,000)
Risk (SL): ₹400 (from ₹8,000 to ₹7,600)
RR Ratio: 5:1 (Favorable trade setup)
Expected Price Movement:
The price is expected to retest the breakout zone around ₹8,000 before moving higher.
If the retest holds, the stock may rally toward ₹9,200 - ₹10,000.

3 Price action pattern for swing trading I daily make educational content videos for swing / positional trading

Paytm - CMP 950 - Monthly - Symmetrical Expanding TrianglePaytm has created Symmetrical Expanding Triangle in Monthly time frame
RSI going up continuously, still not in overbought zone
MACD is looking good
Price is above 20 Months EMA
volume is good for past 4-5 months
Crossed 930 resistance with good volume
DII has increased holding in June and Sep 2024, FII has decreased holdings
Target 1 : 1160++
Target 2 : 1350 , This could be next Resistance
if price sustain at 1350 and give breakout from triangle with good volume then Target 3 could be ATH - 1955++

KAYA LTD - Symmetrical Triangle - MonthlyKAYA LTD formed Symmetrical Triangle pattern on Monthly chart.
Formed symmetrical triangle and given breakout with very huge volume and retest done .
RSI is looking good and taking support
ROCE going minus every year since last 5-7 years :(
poor sales growth since last 5 years :(
FII's and DII's has increased their holding little bit since last 2 quarter.
What will happen next quarter ? will it go sideways or downtrend will start ?
Resistance1 : 505-511
Resistance 2 : 590-600
No Entry, No Targets until positive results or news coming :)

Piramal Enterprises Limited (PEL) !! Ready to ride trend ?? A symmetrical chart pattern on PEL ??
From a broader perspective, the stock has been consolidating at these levels, considering the overall market structure and bearish sentiment in the Indian market and quarterly results show a decline in PEL profits.
Moreover, it raises the question—how many of you have opted for loans from PEL? "KON hain ye log, Kaha se atte hain!!" Compared to other loan providers, PEL doesn’t seem to stand out as a major player in the personal loan space or offer particularly attractive deals to customers.
Technical Analysis:
PEL is forming a symmetrical chart pattern. An early entry could be considered around the ₹900 level.
Stop Loss: 950 Rs
Target : Open/Mentioned on Chart
Strategy: One can take 900 PE FEB month Expiry or Short the Future.
Let me know what you think about this analysis.
Happy Trading!

Nifty Breakdown: A Retest of 21,300-21,000 on the Cards?Nifty has decisively broken out of a Falling Wedge + Descending Triangle, confirming a Lower High-Lower Low (LH-LL) pattern. If this bearish momentum sustains, we could see the following levels:
Immediate downside toward 22,500
In the worst-case scenario, a retest of 21,300-21,000—the lows last seen during the election volatility of June 2024.
🚩 What’s Adding Pressure?
1️⃣ Midcap, Smallcap, and Microcap indices have also broken down from their bases, intensifying the bearish sentiment.
2️⃣ Uncertainty over Union Budget 2025: Will it contain market-friendly announcements or trigger further panic?
3️⃣ Trump’s global policies & their potential impact on India.
4️⃣ SEBI’s regulations, which could also weigh on market sentiment.
📉 What’s the Key Risk?
If the budget disappoints and external policies remain unfavourable, retailers may panic sell, potentially driving Nifty toward these crucial levels.
💡 Trading Tip:
Preserve capital during such volatile phases. As Paul Tudor Jones said, "Don’t focus on making money; focus on protecting what you have."
💭 What’s Your View?
Will Nifty reverse from 22,500 post-budget?
Or are we looking at a deeper correction toward 21,300-21,000?
📈 Let’s discuss below!

Wipro Looking for SupportHello friends good evening, I have prepared a chart for one of my trades in Wipro which I am sharing with you all. So as we can see the Wipro ADR ( American Depository Receipt) listed in the American market is trading down by 4 to 5 percent. In such a situation we can expect that we may see a similar decline in the price of Wipro shares tomorrow or in the coming session. Therefore I have marked a demand zone on its weekly chart and hope that the price will get a bounce from this demand zone, which will be helpful for us to trade on the long side.
Different traders follow different setups and indicators to understand support bounce, I would like to understand it only through price action on smaller time frames and will update accordingly.
I hope you liked the idea if yes then please like and share it, thank you all.
Best Regards- Amit.

DLFPrice is at triple bottom support, which is a bullish pattern. At the same time it is consolidating in the formation of descending triangle which is a bearish pattern.
So how to trade? Let us decode it.
Buy above 738 with the stop loss of 731 for the targets 746, 752, 760 and 768.
Sell below 724 with the stop loss of 731 for the targets 718, 712, 704 and 696.
Do your own analysis before taking any trade.

Nifty weekly review - Jan 20 to Jan 24Movement was bit choppy last weak and price tested the patience of option buyers. Still 23400 zone acts as an important zone to decide the direction.
Buy above 23220 with the stop loss of 23180 for the targets 23260, 23320, 23380, 23420 and 22460.
Sell below 23140 with the stop loss of 23180 for the targets 23100, 23060, 23010, 22960 and 22900.
As per the daily chart, price is still testing the support zone. Once the test is over, we can expect good move.
Do your own analysis before taking any trade.

INDUSTOWER | SWING TRADE | ASCENDING TRIANGLE BREAKOUTINDUSTOWER | SWING TRADE
Chart Analysis:
1) Ascending Triangle Breakout
2) Strong candle formations after breakout

GOLD Triangle BreakoutGold has given a breakout from Triangle Pattern on 1D timeframe. It had been consolidating since November 2024.

DPABHSHAN | Ascending Triangle Breakout | Swing TradeDPABHSHAN | Ascending Triangle Breakout | Swing Trade
Stock giving a good breakout
Chart Analysis:
1) Ascending Triangle Breakout
2) Market Structure Breakout
3) Breakout - Consolidation - Breakout

$NSE:GSPLNSE:GSPL : Gujarat State Petro Ltd 🚀
I've spotted several key technical patterns and points of interest 📊:
Descending Triangle Pattern 🔺
A clear descending triangle has formed from September 2023 to January 2025
Upper resistance line is descending from around ₹470 to ₹370 levels
Lower support line has been relatively flat around ₹350-₹360 levels
Price Action & Trend 📈
Currently showing a strong bullish candle with a +9.16% gain 📊
Price has broken above the descending triangle resistance line
Multiple EMAs (Exponential Moving Averages) visible on the chart showing previous resistance levels 📉
Volume Analysis 🔍
Significant volume spike visible in the latest session (8.05M vs avg volume of 928.27K) 📊
Volume Run Rate is extremely high at 1664.19% 🚀
Previous major volume spikes were seen in September 2023 📅
Key Price Levels 💵
Current price: ₹373
Recent resistance levels: ₹394.80, ₹401.40
Support levels: ₹350.00, ₹321.05
52-week high appears to be around ₹469.70
Technical Indicators 📈
RSI (shown in the bottom panel) has moved from oversold to neutral territory 🔄
Multiple EMAs crossovers visible, indicating trend changes 🔀
The current breakout from the descending triangle pattern with high volume support suggests a potential trend reversal from bearish to bullish 📊. However, traders should watch for confirmation of this breakout in subsequent sessions to validate the pattern completion 📉.
Price Targets 🎯
Traditional Triangle Measurement Method
Height of triangle: ~₹470 - ₹321 = 149 points
Breakout point: ~₹372-₹375 level
Conservative target: ₹375 + 149 = ~₹524 INR
Alternative Measured Move Targets
First resistance: ₹394.80 (Immediate resistance)
Second resistance: ₹401.40 (Previous consolidation level)
Third resistance: ₹435.00 (Major resistance from October 2023)
Risk Management Levels ⚠️
Support (Stop Loss): ₹350.00 (Previous support)
Risk:Reward: Favorable if using ₹350 as stop loss for targets above ₹400
Important Considerations 🤔
High volume breakout (767.99% change in volume) adds credibility to the move
Previous resistance around ₹435-₹440 zone
Conservative target: ₹394.80
Aggressive target based on pattern measurement: ~₹495
Disclaimer:
This is not financial advice. Please do your own research before making any investment decisions. Trading stocks involves risk and may not be suitable for all investors.

The Q.S.R. space is all heated up and they left of this poor oneLooking at Devyani at 200+ P/E
Sapphire at 150+ P/E
Jubilant Foodworks at 130+ P/E
all the other players like Westside and others also playing at high valuations
I feel recently listed RSA and BBQ nation are pretty cheap

Birlasoft Ltd : Ready for a BreakoutBirlasoft Ltd is a company engaged in computer programming, consultancy, and related activities. It provides software development and IT consulting services.
Pro:
Almost debt-free
Good profit growth of 18.2% CAGR over the last 5 years
Healthy dividend payout of 28.3%
Technical Analysis: \
The stock is forming a Descending triangle pattern , indicating a potential breakout.
Volume is also building up from the last swing low.
Expecting a good profit for the upcoming quarters
Stop Loss of 25 points with a target of 350 ++ points.
One can consider this stock for a shorter period with a target of 600 to 605.
