KPI Green (D): Aggressive Bullish, Promoter-Backed MomentumTimeframe: Daily | Scale: Linear
The stock is staging a violent recovery from the bottom of a Symmetrical Triangle. While it has surged +26% in two days, it is currently testing the critical angular resistance . The move is backed by "Insider Buying," which gives it high structural conviction.
🚀 1. The Fundamental Catalyst (The "Why")
The volume explosion is driven by two major factors:
> Promoter Buying: Reports confirm that Quyosh Energia (Promoter Group) purchased shares (approx. 11.2 Lakh shares) via bulk deals. When promoters buy at market prices, it signals they believe the stock is undervalued.
> SJVN Order: The recent execution of the 200MW Solar Project agreement with SJVN (worth ~₹696 Cr) has improved revenue visibility for 2026.
📈 2. The Chart Structure (The Triangle)
> The Setup: The stock has been consolidating in a Symmetrical Triangle since the ATH.
- Support: The bounce from ₹313 (and the recent higher low) was the launchpad.
- Resistance: The stock is now "Kissing" the downward-sloping trendline (around ₹510–₹515 levels).
> Current Status: Despite the +26% move, a daily close above this angular trendline is needed to confirm the end of the correction.
📊 3. Volume & Indicators
> Volume Spike: The volume of 77M+ (combined sessions/exchanges) is an "Institutional Stamp." This is not retail accumulation; this is big money entering.
> RSI: Rising sharply. Note that daily RSI is entering "Overbought" territory (>70) due to the sudden surge. In strong momentum trends (like Power/Energy), RSI can stay overbought for weeks.
🎯 4. Future Scenarios & Key Levels
The stock is at the "Make or Break" point at the trendline.
> 🐂 Bullish Breakout (The Continuation):
- Trigger: A decisive Daily Close above ₹515 .
- Target: ₹581 .
- Blue Sky: If ₹581 clears, the path opens to retest the ATH ( ₹743 adjusted/unadjusted depending on chart).
> 🛡️ Support (The "Pullback"):
- Immediate Support: ₹479 . Since the stock rose +26% in 2 days, a cooling-off pullback to ₹479 is healthy and should be used to add.
- Stop Loss: A close below ₹450 (mid-point of the surge candle) would signal that the momentum was a "flash in the pan."
Conclusion
This is a High-Octane Setup .
> Refinement: The Promoter Buying makes this a "Buy on Dips" candidate rather than a "Sell on Resistance" one.
> Strategy: Watch for the ₹515 breakout. If it clears, the momentum will likely carry it swiftly to ₹580 .
Triangle

Graphite India - Triangle PatternGraphite India looks good above 645 to buy and hold for the long time.
Targets are 715-815-940.
Buy and accumulate for long time, buy on every dips.
Company doing good work and giving better profit.

BTC Broadening Bearish Formation Earlier, BTC was supposed to create a multi-week Rising Wage pattern, but that seems to have been rejected around 90.3k.
Note:
1. The past may or may not repeat
2. BTC might go to 81k, create bullish divergence on weekly or daily to retrace back to 100k before a major pullback
3. BTC will go to 84-81k. That looks to be more likely now.

NBCC(India ) Ltd: At the verge of Tri-Angle Break OutNBCC (India) Ltd :
Trading at 122 and above all its moving Averages)10/20/50/100 DEMA)
Golden Cross over of 10 DEMA in Daily & Weekly Charts
Formed a Tr-angle pattern in daily chart and is about to cross the resistance line
Facing resistance at around 125-130 ,in the event of holding above 130 on closing basis expect a possible move towards 150+ as per the Tri-angle pattern break out Target(For educational purpose only)

CUBEX TUBINGS:Likely Triangle Break Out for 10% TARGETCUBEX TUBINGS:Trading at around 112.
Trading above all the critical Moving Averages viz.10 DEMA,20DEMA,50DEMA.
Golden Cross Over :10 DEMA Over 100DEMA
Increase in Volume.
Tri-Angle Break Out
Combination of the above with increase in volume suggests 10-15% upside for a Target of 120/130/140/150(For Educational purpose only)

RVNL cmp 319.15 by Daily Chart viewRVNL cmp 319.15 by Daily Chart view
- Support Zone 294 to 306 Price Band
- Resistance Zone 332 to 345 Price Band
- Support Zone tested retested over past few days
- Support Zone since January 2025 seems been sustained
- Volumes below avg traded quantity, need to increase for fresh upside
- Breakout from Descending Triangle pattern might be in the making process

StarThe price faced resistance at the 1020 zone, fall down and took support at the 850 zone. This created a narrow range which resulted in a symmetrical triangle pattern. The breakout can happen in any direction.
Buy above the 900 - 910 zone with the stop loss of 885 for the targets 925, 940, 954, 972, 996 and 1018.
Sell below 860 with the stop loss of 875 for the targets 844, 826, 808, and 790.
Always do your analysis before taking any trade.

Triangle Compression Zone🔎 Overview
The Triangle Compression Zone highlights a phase where price transitions from directional movement into consolidation. After an initial trend, price begins to contract between converging support and resistance lines, signaling reduced volatility and temporary market balance.
------------------------------------------------------------
📘 Concept
A triangle forms when price creates Lower Highs near resistance and Higher Lows from support. This converging structure reflects decreasing momentum and growing indecision, as buyers and sellers reach equilibrium. The pattern represents compression rather than direction, with price awaiting clarity.
------------------------------------------------------------
📊 Chart Explanation
• Market Structure
Price initially forms Higher Highs and Higher Lows, confirming directional strength before entering consolidation.
• Resistance Line
The upper trendline connects multiple rejection points, defining the area where selling pressure limits upside.
• Support Line
The lower trendline links higher low swings, showing consistent buyer defense.
• Triangle Compression
As price oscillates between these boundaries, the range narrows and volatility contracts, creating a balanced market state.
• Key Observation
The contracting structure signals indecision. Directional confirmation only occurs once price accepts beyond the triangle boundaries.
------------------------------------------------------------
📝 Summary
• Triangle represents volatility compression after a trend.
• Support and resistance converge as price range tightens.
• Market remains balanced until a clear resolution occurs.
------------------------------------------------------------
⚠️ Disclaimer
📘 For educational purposes only.
🙅 Not SEBI registered.
❌ Not a buy/sell recommendation.
🧠 Purely a learning resource.
📊 Not Financial Advice.

Triangle formationThangamayil Jewellers – Glistening with Opportunity
The overall sentiment in the jewellery sector has turned positive, supported by strong fundamentals and global tailwinds.
Gold and silver prices are on a consistent uptrend, hitting new highs almost daily, driven by both safe-haven demand and global metal rallies.
Thangamayil Jewellers, a Tamil Nadu-based company, has established a strong presence among the middle class, with steady growth in both sales and revenue.
Technically, the stock shows a clear bullish triangle formation on the monthly chart, while also exhibiting low-price accumulation patterns on the daily timeframe.
This setup offers a compelling combination of fundamental strength and technical breakout potential, making it a stock to watch closely in the current metals rally.

After the IPO of 2 subsidiaries that B/S might strengthenCanara Bank Subsidiaries Set for IPO; Strategic Moves Strengthen Position
There is news that two subsidiaries of Canara Bank — one in mutual funds and the other in insurance — are preparing for Initial Public Offerings (IPOs). In both joint ventures, Canara Bank is expected to be the primary seller, and the proceeds are likely to flow directly to the bank’s balance sheet, strengthening its capital position.
Following recent banking sector reforms, Canara Bank has emerged as one of the more robust players among the newly consolidated public sector banks, benefiting from an improved digital banking experience and a healthier loan book.
This trend of consolidation and strategic monetisation of assets may pave the way for a select few public sector banks to evolve into financial powerhouses, with well-diversified subsidiaries across mutual funds, insurance, and other financial services.
Canara Bank, in particular, appears well-positioned to replicate its quiet but consistent success in equity mutual funds, potentially carving out a niche for itself in the broader financial services landscape.

UPL ; Trade possible if ascending triangle 1H breakout.I have marked an ascending triangle line, and it shows how consolidation is expected around this area. This trade can take maximum of your 1 week to attain or fail.
Not a reco, for educational purpose.
I also validated the volumes with LuxAlgo indicator, it is really higher for a doji candle to attain.

Seeing vs Believing: Multi-Pattern Structure vs Single-Line BOOn the left, the weekly chart is mapped as a full A+ type setup, where multiple structural elements work together instead of relying on a single, convenient line.
-A red counter trendline marks a series of lower-high rejection points, visually defining the “least liquidity” supply line that price has repeatedly respected.
-A dotted parallel channel outlines a broader multi-pattern context.
-A dashed hidden line adds another layer of structure, hinting at less obvious inflection zones that are not visible at first glance but often align with prior reactions.
-Finally, an orange line represents a higher time frame resistance level, bringing in a top-down perspective so that the current weekly price action is seen in relation to a dominant, bigger-picture barrier.
On the right, by contrast, the chart is reduced to a single white line drawn in a way that “forces” the candles to appear as if they are breaking out.
This is a great example of chart psychology in action: instead of objectively mapping all relevant patterns, many traders draw what they want to see—one clean breakout line—ignoring hidden structures, multi-timeframe confluence, and complex pattern overlap.
The intention of this post is purely observational and educational, not forecasting.
It aims to show how a professional, multi-pattern approach (CT lines, channels, hidden lines, and higher timeframe levels) can radically change the way a chart is interpreted compared to the simplistic, single-line breakout mindset that dominates retail thinking.
Disclaimer: This post is for educational and illustrative purposes only and does not constitute investment, trading, or financial advice. Always do your own research and consult a registered financial professional before making any trading decisions.

Walchandnagar Inds cmp 172.50 by Weekly Chart viewWalchandnagar Inds cmp 172.50 by Weekly Chart view
- Support Zone 144 to 163 Price Band
- Resistance Zone 205 to 225 Price Band
- Support Zone tested retested over past few weeks
- Volume spiked heavily last week and above avg traded qty

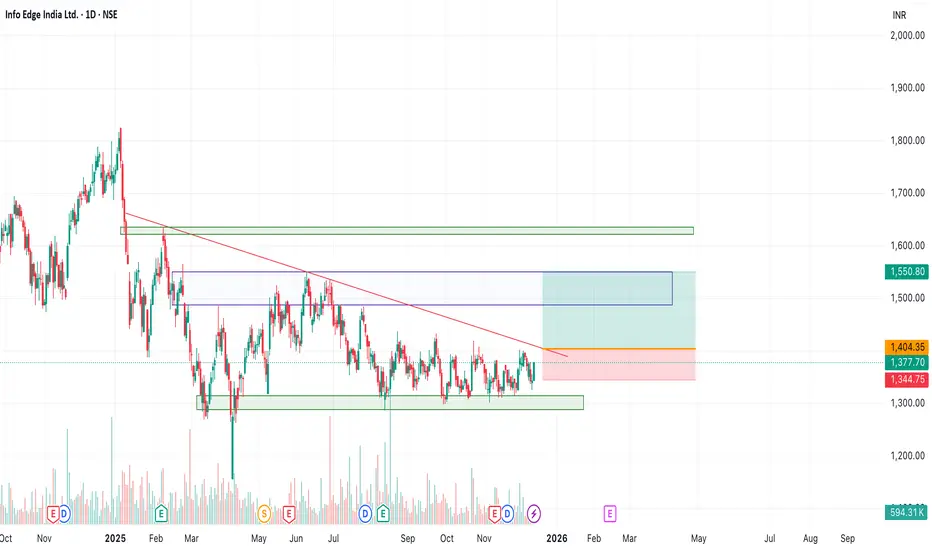
Info Edge India cmp 1377.70 by Daily Chart viewInfo Edge India cmp 1377.70 by Daily Chart view
- Support Zone 1268 to 1315 Price Band
- Resistance Zone 1405 to 1455 Price Band
- Darvas Box : Stock trading in 1300 to 1432 Range
- Falling Resistance Trendline Breakout attempts made
- Volumes spiking regularly above average traded quantity

NaukriInfo Edge - Consolidation is ongoing and near breakout.
Above 1405, there is a breakout and target will be in range of 1490-1550.
Above 1550 it will be 1620-40.
Keep hold for the long term will give good returns.
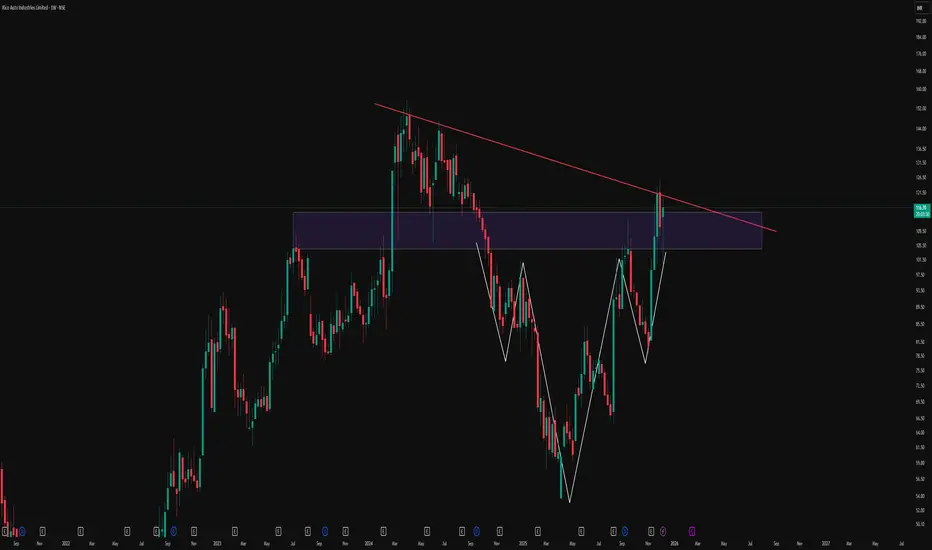
Reclaiming The Breakdown: Descending Triangle To Inverse HnSThis weekly chart of Rico Auto illustrates how structure can evolve over time and why rigid bias around a single pattern can be misleading. Price initially respected a clear descending trendline, forming a classic descending triangle and eventually breaking down below the support zone. Instead of continuing in a straight-line downtrend, the market absorbed that move and began to build a broader basing structure.
Over the following swings, price developed an inverted head and shoulders formation, highlighted here with the white structure, right inside and just below the prior breakdown area. As the pattern matured, price not only reclaimed the prior horizontal zone but also pushed back toward the original red counter-trendline that once acted as dynamic resistance. The same trendline that confirmed the initial triangle breakdown is now being revisited, showing how former breakdown structures can later turn into key decision zones rather than one-way signals.
This chart is shared purely to study how multiple patterns can co-exist and morph on higher timeframes:
-A descending triangle that initially breaks to the downside
-A subsequent inverse head and shoulders basing pattern
-A later reclaim of the old breakdown area and retest of the descending trendline
Disclaimer
This post is for educational and illustrative purposes only and is not investment, trading, or financial advice. Please do your own research and consult a registered financial professional before making any trading or investment decisions.

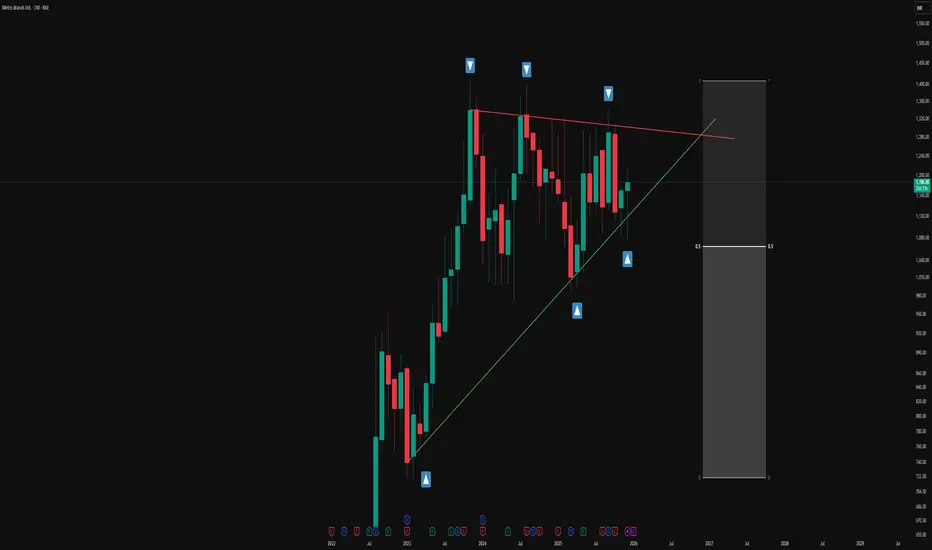
Simple Triangle Pattern on a Monthly Time FrameOverview -
This monthly chart illustrates a symmetrical triangle pattern defined by a series of higher lows and relatively stable swing highs, framed by a green ascending trendline and a red counter-trendline. The structure is presented in an observational manner to highlight how price has evolved within these converging boundaries over an extended period.
Triangle structure -
1.The green line represents the primary trendline, drawn from successive higher swing lows where price has repeatedly found support and turned back up. Each time price touches or approaches this green line, the contact is marked with a blue upward arrow box to emphasize how buyers have consistently responded around this rising level. Together, these points of contact visually document the stepping pattern of higher lows that contributes to the lower boundary of the triangle.
2.The red line acts as the counter-trendline, connecting multiple prominent swing highs where upward movement has stalled and reversed. Blue downward arrow boxes are placed at these touchpoints to highlight how price has respected this sloping resistance zone over time. The repeated interaction with the red line shows how sellers have been active around this upper boundary, creating a series of contained pushes to the upside.
Understanding -
The overall construction emphasizes how multiple touches on both the trendline (T) and counter-trendline (CT) are used to validate the presence of this symmetrical triangle. Rather than focusing on any single candle, the chart showcases the cumulative behaviour of price over many months, making it a useful visual example for studying how support and resistance can evolve into a geometric pattern on a higher time frame.
Disclaimer: This description is purely educational and observational, intended to explain chart structure and pattern formation. It does not constitute investment advice, trade recommendations, or any suggestion to buy, sell, or hold any financial instrument.
Coforge: Ending Diagonal Signals Exhaustion Near Wave (D) HighCoforge has likely completed Wave c of (D) with a clean ending diagonal near the upper boundary of the multi-month triangle structure. This raises the probability of Wave (D) being complete — if price turns down from here.
Technical View
Ending Diagonal: The final leg into ₹1,986 shows a wedge structure — typical of terminal C-waves inside corrective patterns.
Structural Resistance: This move hits the B–D trendline, a natural pivot for Wave (D) completion.
Pivot Zone: The 52-week high at ₹2,005.35 is a clean external invalidation. A sustained move above it would contradict the triangle scenario.
Trade Setup (If Reversal Confirms)
Bias: Short-term bearish (potential Wave E)
Trigger: A confirmed bearish reversal candle in the ₹1,985–₹1,995 zone
Target: ₹1,700–₹1,750
Invalidation: Close above ₹2,005.35
Note: This is a countertrend short inside a strong rally. Wait for the actual reversal signal — the ED alone is not a sell trigger.
Disclaimer: This analysis is for educational purposes only and does not constitute investment advice. Please do your own research (DYOR) before making any trading decisions.

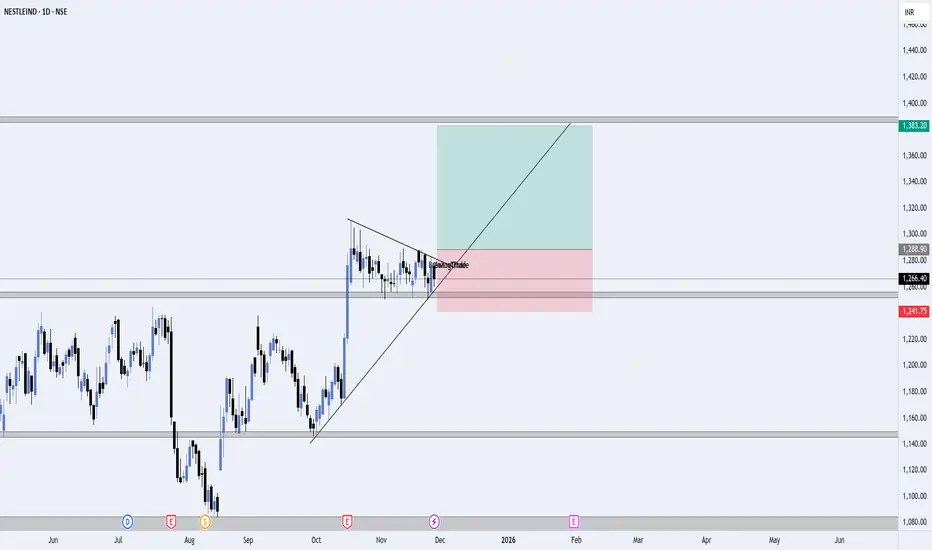
NESTLEIND – Symmetrical Triangle Breakout Setup (1D Chart)I’m watching Nestle India for a potential bullish breakout from a symmetrical triangle on the daily timeframe. Price has been consolidating after a strong impulsive move, and it is now respecting both trendline support and triangle resistance.
🔍 What I'm Seeing
Price created a strong rally, followed by a healthy consolidation.
A symmetrical triangle pattern has formed — showing tight price compression.
Price is currently sitting near the trendline support, indicating buyers are still active.
A breakout above the triangle could trigger the next bullish leg.
📈 Trade Idea
Entry Zone: Around current levels near the triangle breakout
Stop Loss: Placed below the trendline + recent swing lows
Target: Previous strong resistance zone near ₹1383
This gives a clean risk-to-reward setup with a logical structure: risk below support, target at the next major supply zone.
🎯 Why This Setup Makes Sense
Triangle breakout often leads to strong directional moves.
Trendline support confirms buyer strength.
Market structure is shifting bullish after breaking the downtrend earlier.
⚠️ Risk Note
This is not financial advice. Always manage risk properly and wait for a confirmed breakout candle before entering.
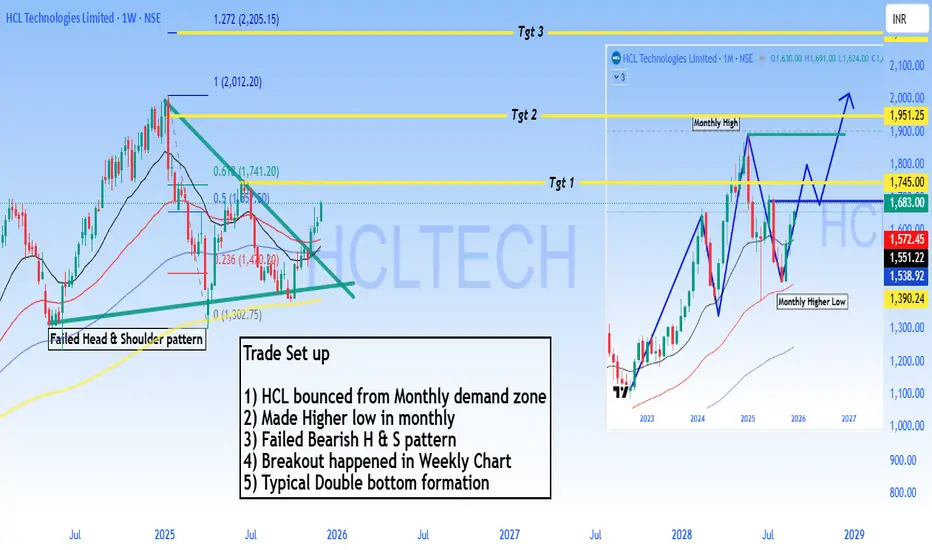
HCLT - Buy - Technical Analysis#HCL Technologies Limited - Technical Analysis
Price: 1,683.00 |
#Trade Setup - Bullish Reversal
#Outlook
Strong bullish setup with 4-35% upside potential. The failed bearish head & shoulder pattern combined with monthly demand zone bounce suggests institutional accumulation. Breakout above 1,745 opens path to 1,951 and beyond.
Pattern Analysis:
1. Bounced from monthly demand zone - Strong support established
2. Made higher low in monthly chart - Trend reversal signal
3. Failed Bearish Head & Shoulders pattern - Bears trapped, bullish continuation
4. Breakout confirmed on weekly chart - Momentum shift
5. Typical double bottom formation - Classic reversal pattern
Technical Structure:
- Monthly higher low at 1,390 confirms bullish structure
- Failed H&S pattern invalidation is highly bullish
- Price now targeting previous resistance zones
Target Levels:
- Target 1: 1,745.00
- Target 2: 1,951.25
- Target 3: 2,272.70
Support: 1,572 - 1,551 (critical zone)
⚠️ DISCLAIMER
**NOT investment advice.** Educational analysis only. Trading involves substantial risk of loss. Past patterns don't guarantee future results. Always do your own research and consult a SEBI-registered financial advisor. Author assumes no responsibility for losses.
#HCLTech #StockMarket #NSE #TechnicalAnalysis #ITStocks #IndianStockMarket #SwingTrading #Trading #FinTwit #TradingView #ChartAnalysis #StocksToWatch #Nifty50 #TechStocks
#Bajaj Finance Limited - BUY - Technical Analysis#Bajaj Finance Limited - #Technical Analysis
Price: 1,048.00
#Swing Trading Setup
Pattern: #Range #breakout with #consolidation above breakout zone. #Triangle/Box pattern breakout with target hit. Currently forming double bottom pattern.
Key Technical Points:
1. Range breakout & consolidating above breakout area
2. EMA's sorted & aligned - price trading above all EMAs
3. Triangle/Box pattern breakout - target achieved, now forming double bottom
4. Classic divergence in recent bounce area confirming retracement completion
Target Levels:
- Target 1: 1,103.80
- Swing Target 2: 1,155.00
- Grand Target: 1,225.00
Support: 1,026 - 1,018 (critical zone)
#Outlook
Strong bullish structure with potential upside of 10-17% toward targets. The double bottom formation suggests the retracement phase is complete. Price sustaining above ₹1,048 confirms continuation toward higher targets.
⚠️ DISCLAIMER
This is NOT investment advice. For educational purposes only. Stock trading involves substantial risk. Past performance doesn't guarantee future results. Always do your own research and consult a SEBI-registered financial advisor before investing. Author assumes no responsibility for losses.
#BajajFinance #StockMarket #NSE #TechnicalAnalysis #SwingTrading #IndianStockMarket #Trading #FinTwit #ChartAnalysis #StocksToWatch #TradingView #MarketAnalysis

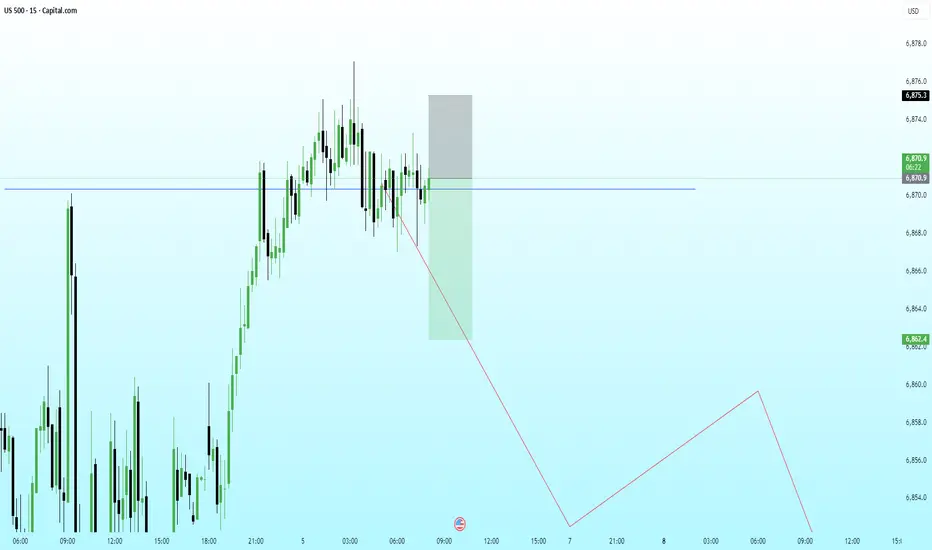
US500 – Clean Retest of Broken Structure With Bearish ContinuatiPrice has retested the broken structure level (blue line) and is now reacting inside a premium zone, suggesting sellers may re-enter the market from this region. The consolidation and repeated rejections indicate absorption of buy-side pressure.
With HTF context still pointing toward a deeper correction, this LTF retest offers a potential distribution setup before a continuation lower toward the next major liquidity pocket.
Bearish Path:
• Retest of the broken structure
• Reaction from premium supply zone
• LTF breakdown and structure shift
• Continuation toward downside liquidity + inefficiencies below