JBCHEPHARM - KEEP EYE ON IT (LONG SETUP) | ASCENDING TRIANGLEThis is how I see the future of JBCHEPHARM. Keep an eye on it for possible entry opportunities.
Disclaimer: I am not SEBI certified and these are my personal views. Please do your research before making any investment decisions.
Triangle

SJVN Ltd:- Ascending TriangleSJVN Ltd:- Ascending Triangle
Breakout soon stock.
62 % Upside potential
Plan your trade accordingly.
Views are for ‘’EDUCATIONAL PURPOSE ONLY’’,trade at your own risk.
"Trade what you see, Not what You Think"
Happy Trading(:)

Spic on Potential Symmetrical triangle Breakout..!
SPIC has been consolidating in a channel pattern for last 2years in weekly chart. In daily chart formed a symmetrical triangular pattern and trying for a breakout following in a uptrend.
Potentially can reach upto the top of the channel 107rs. Maintain strict Stoploss 82rs which is below the triangle Pattern.

Amazing Swing trading idea for 1 August MarketsI daily make educational content videos for swing / positional trading

CAPLIPOINT LONG 1530-1545, CUP AND HANDLEBullish Indicators:
Ascending triangle pattern.
Trading above key moving averages (20-day, 50-day, and 200-day).
Potential cup and handle formation.
RSI is bullish but not overbought.
Volume spikes on upward movements.
target 1: 1596
target 2: 1800+
Note: I am not SEBI registered or TA expert. just learning the TA and sharing my views and you should consider doing research on your own before making any investment decisions.
Finished Trades (1/1)
JUBLINGREA - Target hit in 4 sessions (check out it in ideas section)

HINDUSTAN PETROLEUM |Ascending Triangle & Channel BreakoutHINDUSTAN PETROLEUM |Ascending Triangle & Channel Breakout
Chart Analysis
1) Ascending Triangle Breakout
2) Channel Pattern Breakout
3) Breakout consolidation breakout

Deepak NitriteDeepak Nitrite fundamentally strong stock. If you look at the quarterly chart, it has been respecting rectangle breakout. Triangle trendline breakout done. Once rectangle breakout happens, stock would roar.

Multi year breakout with Ascending right angle triangle patternMulti year breakout with good volumes.
Ascending right angle triangle pattern breakout with good volumes.

Deepak fertilizers & petrochemical Corp LtdIt is involve in chemicals, mining chemicals & fertilizers business.
Market Cap: 8474 crores
P/E 12.6 vs Industry P/E 33.2
ROCE is 25%
Previously ,it demonstrated a perfect example of Cup pattern breakout that achieved its target.
Currently it is on verge of giving breakout in a symmetrical triangle. weekly closing above 680 and RSI weekly closing above 60 should be consider as confirmation of breakout .If it does closes then it should head for 720 and 834. It has the potential to cross it ATH of 1065 in 2024.
The View should be neglected if it breakdown in symmetrical triangle.
This is not a stock Recommendation.

Ascending triple pattern TTML is tata company. Ascendig triple pattern. Can break the level then entry.

Ascending triple pattern TTML is tata company. Ascendig triple pattern. Can break the level then entry.

MANINFRA | Ascending Triangle Breakout | Swing TradeMANINFRA | Ascending Triangle Breakout
Stock gives a clean ascending triangle breakout with first traget of 12% and later it can go high. This stock given breakout after long time so we can expect good returns

MANINFRA | Ascending Triangle Breakout | Swing TradeMANINFRA | Ascending Triangle Breakout
Stock gives a clean ascending triangle breakout with first traget of 12% and later it can go high. This stock given breakout after long time so we can expect good returns

BREAKOUT IN DSSL 📌SWING TRADE FOR NEXT WEEK🚀
Hello Traders⚡
I am a Swing Trader by Passion i only trade on Momentum Stock's.
📌I Post Daily SWING CHARTS Analysis on My Trading view profile..
So let's Start
📌TRADE ANALYSIS OF -DSSL-
• Potential Breakout Chart
• VCP Pattern
• Short Range Consolidation
• Price Can Take Retest from support Line
• Overall The Price Is Moving In HH-HL Formation
• Volume Buildup Near BO Zone
• Looks Good For 10-20% Upside Levels After The Breakout
📌 If you have any questions about any stock you can comment on post 📱
📌Disclaimer:-
This all charts analysis are only for educational purposes only
I do not provide any CALL or Tips

BREAKOUT IN LOVABLE📌SWING TRADE FOR NEXT WEEK🚀
Hello Traders⚡
I am a Swing Trader by Passion i only trade on Momentum Stock's.
📌I Post Daily SWING CHARTS Analysis on My Trading view profile..
So let's Start
📌TRADE ANALYSIS OF -LOVABLE-
• Potential Breakout Chart
• VCP Pattern
• Short Range Consolidation
• Price Can Take Retest from support Line
• Overall The Price Is Moving In HH-HL Formation
• Volume Buildup Near BO Zone
• Looks Good For 10-20% Upside Levels After The Breakout
📌 If you have any questions about any stock you can comment on post 📱
📌Disclaimer:-
This all charts analysis are only for educational purposes only
I do not provide any CALL or Tips

3 Amazing swing trading ideas for 29 July markets I make educational content videos for swing / positional trading

INFOSYS - TRIANGLE PATTERN - MONTHLY CHARTInfosys has given Triangle Pattern breakout at monthly chart, looks positive as per Price Action.
For learning and educational purposes only, not an advice.

$NSE:GLOBE: Still NOT TOO late to BUYSummary:
NSE:GLOBE Globe Textiles exhibits strong fundamentals with a high Piotroski score of 8 and is trading at a reasonable PE ratio of 15. The stock has shown a strong technical breakout with significant volume, indicating potential for further upside.
Fundamentals:
Very strong fundamentals
High Piotroski score of 8
Currently trading at a PE ratio of 15
High-performing player in the textiles industry
Technical:
Strong volume peak after consolidation, indicating potential institutional buying
Strong breakout, still not too late to buy
Good liquidity
Trade Setup:
Entry: Current Market Price
Stop Loss: Conservative stop loss level based on recent support (4.50)
Potential Upside: 8.50 NSE:GLOBE

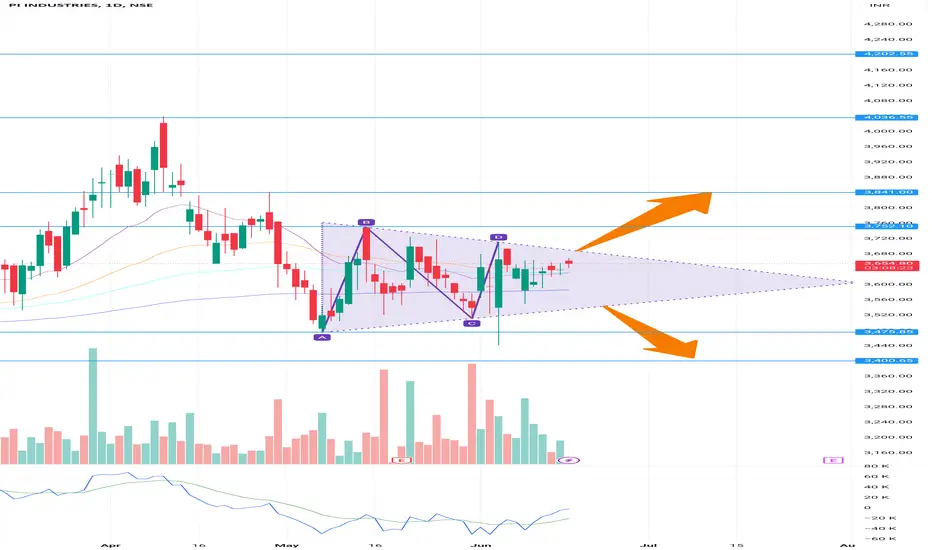
Long PIIND FOR TARGET OF 4200PIIND is trading in symmetrical triangle pattern on daily charts.
Currently inside the triangular channel. Once breakout is confirmed.
We can see piind moving to new highs in future. Another positive found is moving average crossovers occurring on weekly charts.
Wait for breakout confirmation to enter.
All targets are marked on chart.
Follow stop loss as the triangle breakout point on either side. Strictly on closing basis
BREAKOUT IN UCO BANK📌SWING TRADE FOR NEXT WEEK🚀
Hello Traders⚡
I am a Swing Trader by Passion i only trade on Momentum Stock's.
📌I Post Daily SWING CHARTS Analysis on My Trading view profile..
So let's Start
📌TRADE ANALYSIS OF -UCO BANK-
• Potential Breakout Chart
• VCP Pattern
• Short Range Consolidation
• Price Can Take Retest from support Line
• Overall The Price Is Moving In HH-HL Formation
• Volume Buildup Near BO Zone
• Looks Good For 10-20% Upside Levels After The Breakout
📌 If you have any questions about any stock you can comment on post 📱
📌Disclaimer:-
This all charts analysis are only for educational purposes only
I do not provide any CALL or Tips

Laxmi Organic - Bullish Divergence and Breakout from TriangleWeekly Chart Insights:
Symmetrical Triangle Pattern: Over the past years, Laxmi Organic Industries Ltd has formed a symmetrical triangle.
Breakout Confirmation: Recently, the price broke above the upper trendline of the triangle.
Retest of Breakout: The price action is retested the breakout at the Trendline and has moved upwards now.
Bullish Divergence:
Time Period - 26 March to 12th May
Lower Low in Price - Price went from 235.2 to 228.5
Higher Low in RSI - RSI went from 37.2 to 37.6
Disclaimer: This analysis is for educational purposes and should not be considered financial advice. Always conduct your own research before making any investment decisions.

IOC Looks ready for another rally from the base1. Retest the trendline
2. Retested the Previous ATH
3. Price surge above the 20-50 DMA with good volumes
4. Good First entry point
5. For further confirmation wait for breakout and retest

Libas - Potential Bullish Divergence in Descending TriangleLibas Designs Ltd. is currently trading within a descending triangle pattern. A potential bullish divergence between the price action and the RSI could indicate an upcoming trend reversal.
Technical Analysis:
Descending Triangle Pattern: The stock has been consolidating within a descending triangle pattern, characterized by lower highs and a strong support level around ₹16.5.
Lower Low in Price: The price recently made a lower low, near the support level of the triangle.
Higher Low in RSI: Simultaneously, the RSI (14) made a higher low, creating a bullish divergence. This suggests that the selling pressure is weakening, despite the price making a new low.
Volume Analysis: Volume has been decreasing during the formation of the triangle, which is typical for this pattern and indicates a potential buildup before a breakout.
Trade Setup:
Entry Point: I would wait for a breakout and retest above the top trendline. Probably somewhere above the 17.5 mark.
Stop Loss: A stop loss below ₹16.00, just under the recent support level, to manage risk effectively.
Disclaimer: This analysis is for educational purposes and should not be considered financial advice.
