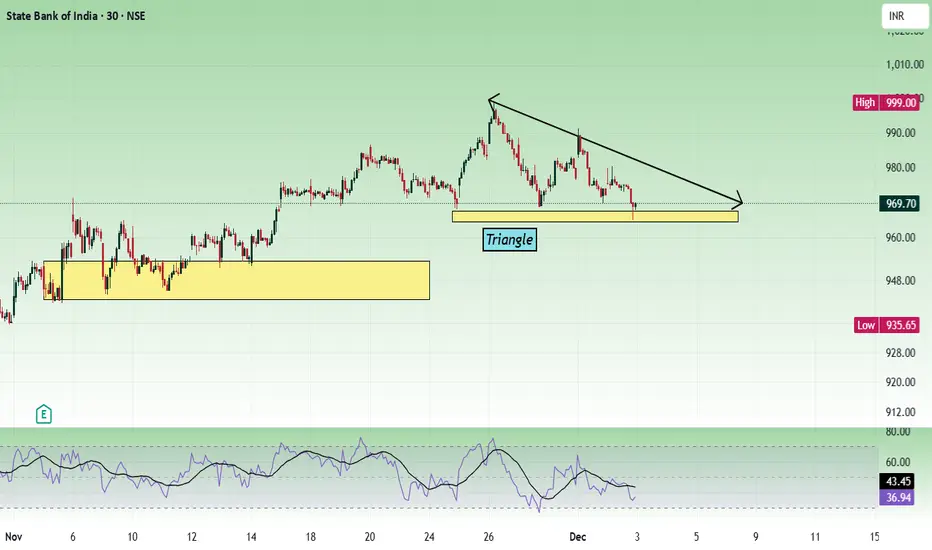
Sbin The lower time frame shows the price is forming a triangle pattern. And nearby support is seen at the 942 to 952 zone.
The daily chart shows, the price is moving steadily and is having a pullback towards the trend line. The price can bounce from the trend line.
If the price breaks the triangle, sell below 960 with the stop loss of 966 for the targets 954, 948, 942 and 936.
Buying opportunities will come when the price tests the 940 zone.
Always do your analysis before taking any trade.
Triangle
Siemens IndiaClean breakout with 3 rejections at the upper trendline on daily chart. Took an entry at 3370 post-confirmation with SL near 3300.

Trade Rate Sensitive Assets: A Comprehensive OverviewIntroduction
In the global financial markets, assets are often influenced by fluctuations in trade rates, currency values, and interest rates. Trade rate sensitive assets are those whose valuations, returns, or profitability are significantly affected by changes in trade rates or related economic variables. Understanding these assets is crucial for investors, traders, and policymakers, as shifts in trade rates can impact everything from corporate earnings to sovereign debt sustainability. In this discussion, we will explore what trade rate sensitive assets are, the types of assets affected, the mechanisms of sensitivity, and practical strategies for managing associated risks.
Definition of Trade Rate Sensitive Assets
Trade rate sensitive assets are financial or physical assets whose value is directly or indirectly influenced by trade rates, exchange rates, or global trade dynamics. In this context, “trade rate” refers to the cost of importing or exporting goods and services, often mediated by currency exchange rates and tariffs. When trade rates fluctuate due to changes in currency valuations, trade policies, or global demand, the cash flows and profitability of these assets can be materially affected.
For example, a company that exports electronics from India to the United States may find that its revenue in Indian Rupees rises or falls depending on the USD/INR exchange rate. Similarly, bonds issued in foreign currency, commodities, or equity of export-driven companies are considered trade rate sensitive.
Categories of Trade Rate Sensitive Assets
Equities of Export-Oriented Companies
Companies engaged in global trade, particularly exporters, are highly sensitive to changes in trade rates. For instance:
Exporters: Revenue depends on foreign currency inflows. A stronger domestic currency reduces the local-currency value of foreign revenue, negatively impacting profits.
Importers: Firms reliant on imported raw materials may face higher costs if the domestic currency weakens, squeezing profit margins.
Examples include:
Technology companies exporting software or hardware.
Commodity companies exporting metals, agricultural products, or chemicals.
Foreign Currency Bonds
Bonds issued in foreign currency expose investors to trade rate and currency risk. When trade rates impact currency valuations:
The local-currency value of coupon payments and principal changes.
Investors holding USD-denominated bonds in emerging markets may gain or lose value depending on the USD exchange rate relative to their home currency.
Commodities
Many commodities are globally traded, so trade rate fluctuations directly influence pricing. For instance:
Oil and gas prices are denominated in USD globally; any currency depreciation in importing countries increases local costs.
Agricultural products, metals, and rare earth minerals are affected similarly, with global trade dynamics impacting supply and demand.
Derivative Instruments
Derivatives such as futures, options, and swaps on foreign currencies, commodities, and trade-sensitive indices also qualify as trade rate sensitive assets. They are particularly useful for hedging or speculating on trade rate movements. For example:
Currency futures can hedge export revenue against domestic currency appreciation.
Commodity futures allow exporters and importers to manage cost volatility.
Real Assets with Trade Exposure
Some physical assets, like factories, warehouses, or ships, are indirectly trade rate sensitive. For example, a shipping company’s revenue is tied to freight rates, which are influenced by global trade activity and currency movements.
Mechanisms of Sensitivity
Trade rate sensitivity arises from several interconnected mechanisms:
Exchange Rate Fluctuations
Exchange rates are a primary determinant of trade rate sensitivity. Assets that generate foreign revenue or require foreign inputs experience profit volatility when exchange rates shift.
A depreciation of the domestic currency improves export competitiveness, potentially increasing revenue.
Conversely, it raises the cost of imported inputs, affecting margins.
Tariffs and Trade Policies
Changes in trade tariffs, quotas, and regulations can directly impact asset value:
Increased tariffs on imported components may raise production costs for domestic manufacturers.
Export restrictions in foreign markets can limit revenue potential.
Global Economic Cycles
Trade-sensitive assets react to changes in global economic growth, as demand for exports fluctuates with industrial production, consumer spending, and investment cycles.
Commodity Prices
Many trade-sensitive assets, especially in resource-driven economies, are influenced by global commodity prices. For example:
Oil exporters benefit from rising crude prices in USD terms.
Agricultural exporters face revenue shifts based on international demand and currency-adjusted prices.
Interest Rate Differentials
Trade-sensitive assets in foreign currency can be indirectly affected by interest rate differentials. Higher domestic interest rates may strengthen the currency, impacting export competitiveness and asset valuations.
Risk and Volatility
Trade rate sensitive assets carry inherent risks due to their exposure to multiple dynamic factors:
Currency Risk: Volatile exchange rates can significantly alter asset values.
Trade Policy Risk: Sudden policy changes, sanctions, or tariffs can disrupt revenue streams.
Commodity Price Risk: Export-driven commodity firms face fluctuations in global prices.
Liquidity Risk: Assets with concentrated trade exposure may be harder to sell during economic shocks.
Investors must recognize that trade rate sensitivity introduces higher volatility compared to domestic-only assets, making risk management essential.
Investment and Hedging Strategies
Investing in trade rate sensitive assets requires careful assessment of global trade trends, currency movements, and economic indicators. Some practical strategies include:
Diversification
Spread investments across regions, sectors, and asset classes to reduce exposure to a single trade-sensitive factor.
Currency Hedging
Use forward contracts, options, or swaps to mitigate currency risk in foreign revenue or bonds.
Commodity Hedging
Exporters and importers can lock in prices via commodity futures or swaps to reduce volatility from global market fluctuations.
Monitoring Policy Developments
Stay informed on tariffs, trade agreements, and geopolitical developments that may affect asset valuations.
Active Portfolio Management
Adjust allocations dynamically based on macroeconomic indicators, exchange rate forecasts, and trade volume trends.
Examples in Real-World Markets
Apple Inc.: Generates significant revenue from exports; USD appreciation can affect international earnings.
Reliance Industries: Exposed to crude oil prices and global trade flows; currency and commodity risks are significant.
Emerging Market Bonds: Sensitive to USD movements and global interest rate changes, affecting repayment in local currencies.
Shipping Companies (e.g., Maersk): Revenue depends on global trade volumes and freight rates, which fluctuate with global economic conditions.
Conclusion
Trade rate sensitive assets form a crucial component of global financial markets, linking macroeconomic trends, currency movements, and international trade dynamics. These assets—ranging from equities, bonds, commodities, derivatives, to physical trade-linked assets—require careful monitoring due to their susceptibility to exchange rates, trade policies, and global demand cycles. Successful investment and risk management in these assets involve a combination of hedging, diversification, and close attention to macroeconomic and geopolitical indicators. Understanding the mechanisms and strategies related to trade rate sensitivity enables investors and policymakers to navigate volatility, optimize returns, and mitigate potential losses in a highly interconnected global economy.
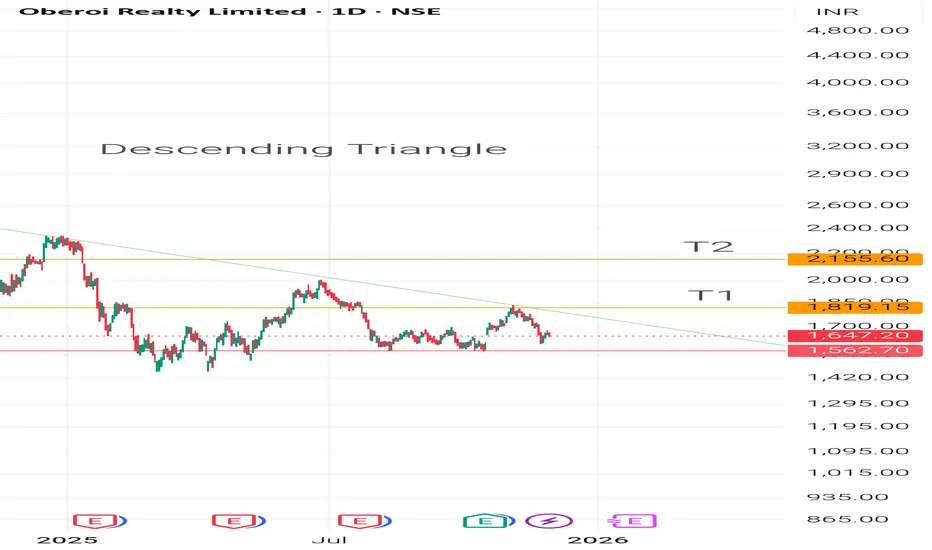
Descending Triangle BreakoutOberoi Reality is forming a Descending Triangle Pattern and can be a good Swing Trade for two reasons:
1. Descending Triangle Pattern gives a Good Breakout Movement.
2. The QOQ result of the stock has been very good with an increase of Profit in the Medium Term.
3. The stock has formed higher low in Price as Well as RSI.
I've set the targets at 38.2 and 50 levels of the fibonacci.
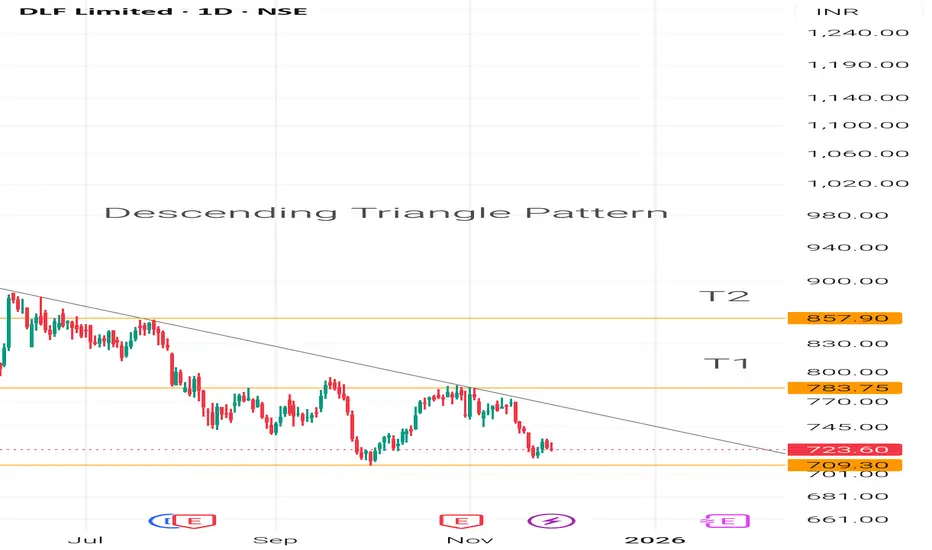
Descending Triangle PatternThis can be a profitable trade because of :
1. The stock is forming Descneding Triangle Pattern which can give potential momentum till 12-15%.
2. The stock's current low is a bit above the previous one and can be also see in the RSI.
3. DLF has given very strong QoQ resultand has shown very high profit.
The Stock's upcoming target are marked using Trend based Fibonacci Extension Tool.
Gravita Triangle Breakout 1DGravita is attempting to breakout after forming a triangle pattern on 1D timeframe with high volumes. The stock is also trading above 200ema. Enter after bullish confirmation.

IGL: DOWNTREND RESUMINGIGL 194 is looking to test 170 to 150 levels. Stock is in downtrend and now ascending triangle breakdown happening. Multiple support at 150 zone which can be testing.
View invalid above 205 levels reclaimed again.

JSW ENERGY : TRINAGULAR BREAKDOWNJSW ENERGY (W) 481. Stock moving towards 450 to 380 levels.
Ascending triangle breakdown in downtrend happening. Bigger timeframe and multiple resistance on higher zone. View invalid if sustain above 505 on weekly basis.

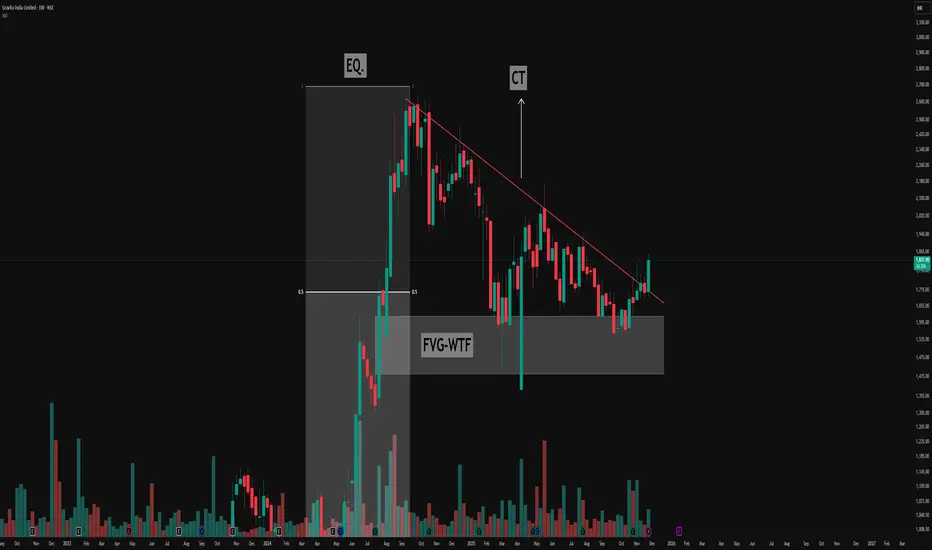
Decoding the Descending Triangle: Key Structure & FVG🔻Understanding the Pattern
- The chart above highlights a classic descending triangle pattern, easily visible by its series of lower highs (marked in red) and a relatively consistent demand zone acting as support.
- This resistance trendline (CT—Contraction Trendline) has been tested multiple times, confirming its significance as sellers consistently respond to price rallies by pushing back from lower levels.
🔻Equilibrium and Price Exploration
- Notice how price action moves from the equilibrium zone (EQ.)—the midpoint of the major move (from lows to all-time highs). This is a key area where supply and demand often rebalance
- The triangle structure forms as buyers continue to find value at support, while sellers become increasingly aggressive at lower highs, compressing price action over time.
🔻Weekly Fair Value Gap (FVG) in Focus
- A prominent Weekly Fair Value Gap (FVG-WTF) is identified, which price has tapped multiple times. This repeated interaction demonstrates its importance as a liquidity pocket where imbalances are re-tested and absorbed.
- Each revisit to this FVG offers a valuable lesson on how strong institutional levels serve as magnets, attracting price to resolve open liquidity.
This post is for educational purposes, highlighting how price structures can be interpreted without suggesting any forecast or trade.
Symmetrical Triangle breakdown 🔎 Overview
The Symmetrical Triangle is a contraction pattern formed when the market prints Lower Highs (LH) and Higher Lows (HL) inside two converging trendlines.
After a strong impulsive bullish move (flagpole), price enters consolidation as volatility shrinks — this creates the triangle.
Momentum shifts only when price breaks out of the structure.
A Symmetrical Triangle is a neutral pattern that can break in either direction, allowing momentum to expand upward or downward once price closes beyond the trendline.
In this chart, price breaks the lower trendline and touching the HL-Swing, confirming a bearish continuation.
⸻⸻⸻⸻⸻⸻⸻⸻⸻⸻⸻⸻⸻⸻⸻
📊 Chart Explanation
1️⃣ Strong Uptrend ( Flagpole )
Price starts with a sharp impulsive rally, forming the base structure before the triangle.
2️⃣ Initial Pullback → First LH + HL
After the rally, price begins contracting, creating alternating Lower Highs (LH) and Higher Lows (HL).
3️⃣ Lower High Swings
Multiple LH points show that buyers are losing strength on every upward attempt.
4️⃣ Higher Low Swings
HL points indicate buyers defending the lower boundary, but with weaker force as the structure tightens.
5️⃣ Converging Trendlines (Triangle Structure)
Upper trendline: Drawn by connecting successive LHs.
Lower trendline: Drawn by connecting successive HLs.
Both lines converge toward the apex, indicating decreasing volatility and market indecision.
6️⃣ Price Consolidation Zone
Inside the highlighted box, candles remain tight and range-bound — a classic compression zone before breakout.
7️⃣ Breakout Confirmation Rule
A valid breakout is confirmed only when a full candle closes beyond the upper or lower trendline and interacts with the nearest LH (for bullish break) or HL (for bearish break).
This shows that the breakout is strong enough to violate the previous swing structure, confirming directional momentum.
A full candle close below the lower trendline confirms bearish continuation.
This signals sellers have regained control and trend continuation is likely.
8️⃣ Bias After Breakdown
Since the prior move was strong bullish but the structure broke downwards, the pattern resolves as a bearish reversal of the short-term structure and continuation of immediate downside momentum.
⸻⸻⸻⸻⸻⸻⸻⸻⸻⸻⸻⸻⸻⸻⸻
🟢 Summary
Symmetrical Triangle is confirmed by alternating LH + HL swings.
Trendlines converge → volatility compression.
A confirmed breakdown close below the lower trendline = bearish continuation signal.
Price structure and swings are correctly identified as per textbook pattern rules
⸻⸻⸻⸻⸻⸻⸻⸻⸻⸻⸻⸻⸻⸻⸻
⚠️ Disclaimer
📘 For educational purposes only.
🙅 Not SEBI registered.
❌ Not a buy/sell recommendation.
🧠 Purely a learning resource.
📊 Not Financial Advice.

Descending Triangle Breakout Can't believe I missed this trade. I had been tracking this stock since August and the mokent I let it slip through my eyes it blasted off 🚀
Sensex - Weekly review Nov 24 to Nov 28We can see a very interesting pattern formation. Price has formed an ascending triangle pattern before breaking out to the upside. After that, it has formed a descending triangle. There is a trend direction zone between 85000 and 85200.
How the price reacts between 85000 and 85200 will decide the trend direction.
Buy above 85260 with the stop loss of 85120 for the targets 85380, 85520, 85680, 85840, 85980, 86120 and 86300.
Sell below 84900 with the stop loss of 85060 for the targets 84760, 84620, 84480, 84320, 84160, 84020, 83880 and 83740.
As per the daily chart, important support is seen at 84500 to 85600.
Always do your analysis before taking any trade.

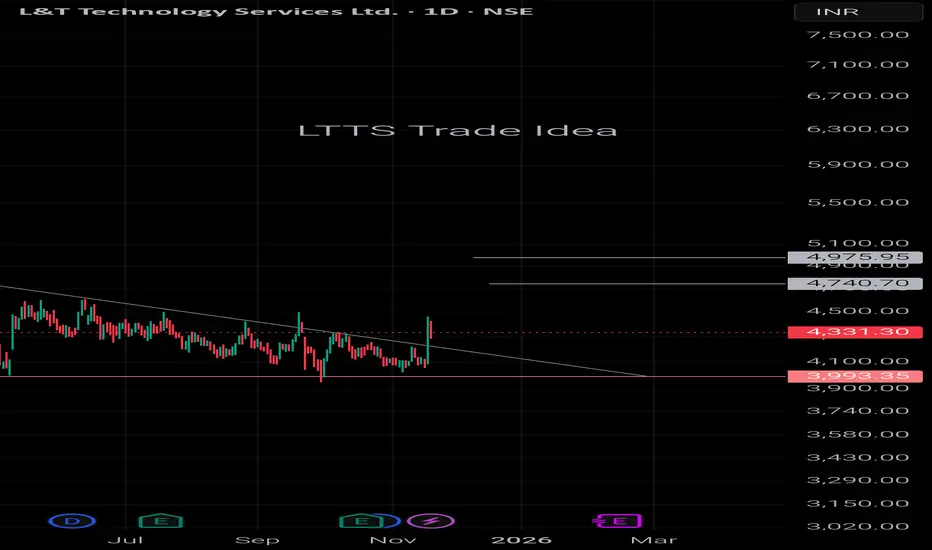
LTTS Deacending Triangle LTTS is giving a breakout from a Descending Triangle Pattern and the immediate Targets for the stock are 4740 and 4975 From FIB Retracement. Sometimes Inaction Hurts more than the not having the right trade 🥲
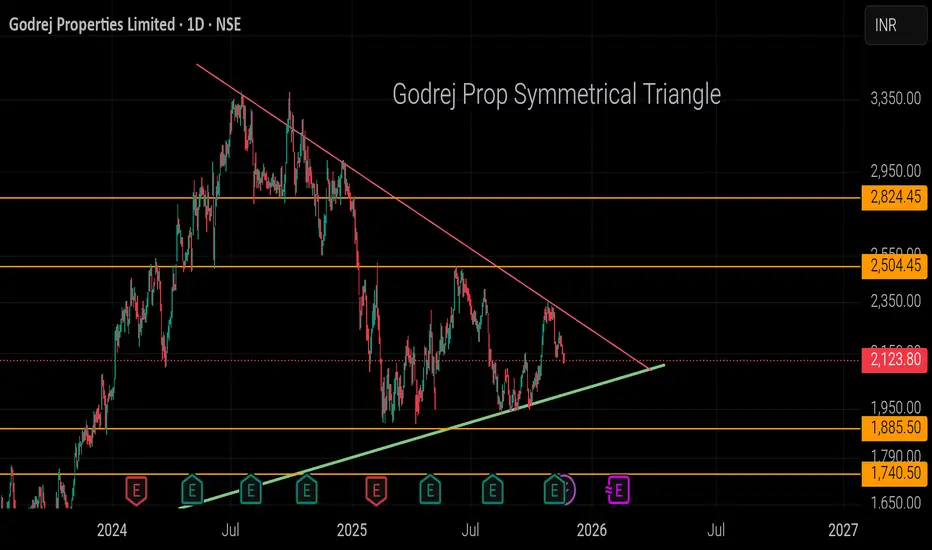
Godrej Properties Symmetrical TriangleGodrej Properties is forming a Symmetrical Triangle. The recent news signify that they have acquired land / property deal worth of 2400 Cr which can boost the stock. I've outlined 4 possible targets using the Fib Tool. Not sure if it's gonna go down or up. Let me know your opinion about it.
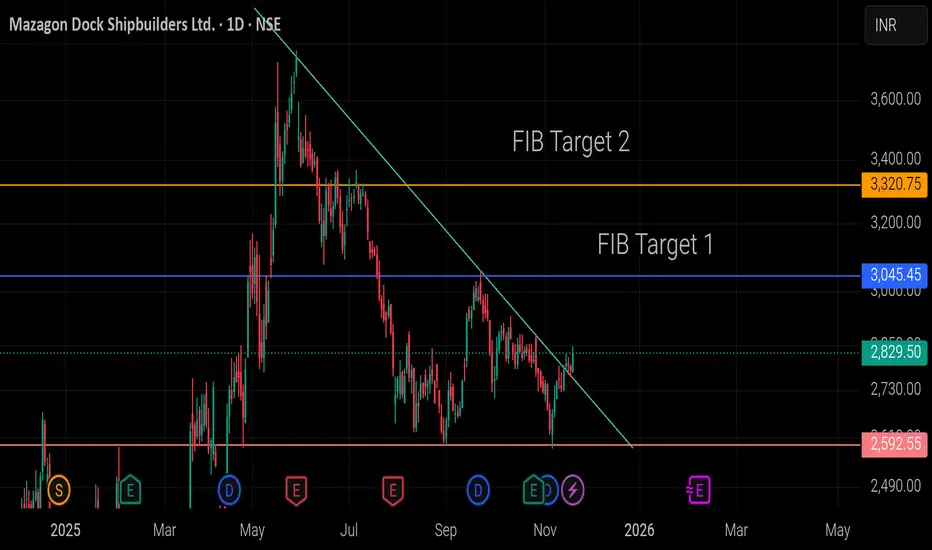
Mazgaon Dock Descending Triangle PatternMazgaon Dock is forming a Descending Triangle Pattern and has given a breakout from it. After breakout it is also giving retracement. The immediate target levels for the stock are 3045 and 3320.
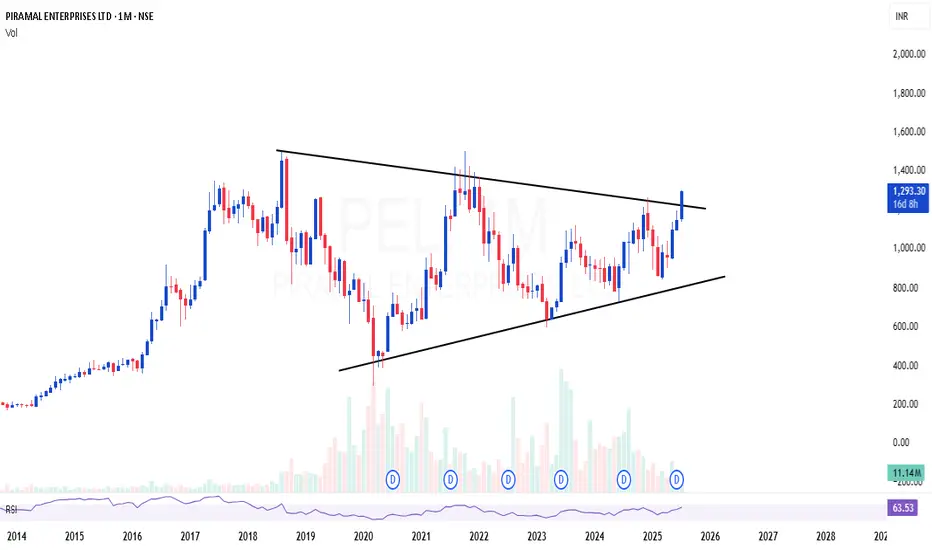
PEL | Triangle breakout after 7 years consolidationPEL | Triangle breakout after 7 years consolidation
CMP : 1293 (Dip : 1150)
SL : 1000
Sensex - Expiry day analysis Nov 20The price is sustaining above the resistance at 85k, and the resistance is acting as support now. The pattern we are seeing in the chart is an ascending triangle, which can give a breakout to the upside. For this to work, the price should show bullish strength at the 85k zone.
Buy above 85060 with the stop loss of 84920 for the targets 85200, 85320, 85480 and 85600.
Sell below 84780 with the stop loss of 84920 for the targets 84660, 84520, 84400 and 84260.
Expected expiry day range is 84800 to 85400.
Always do your analysis before taking any trade.

M&M FinanceClean breakout with 3 rejections at the upper trendline on daily chart. Took an entry at 331 post-confirmation with SL near 320.

Eicher MotorClean breakout with 3 rejections at the upper trendline on hourly chart. Took an entry at 7100 post-confirmation with SL near 7000.

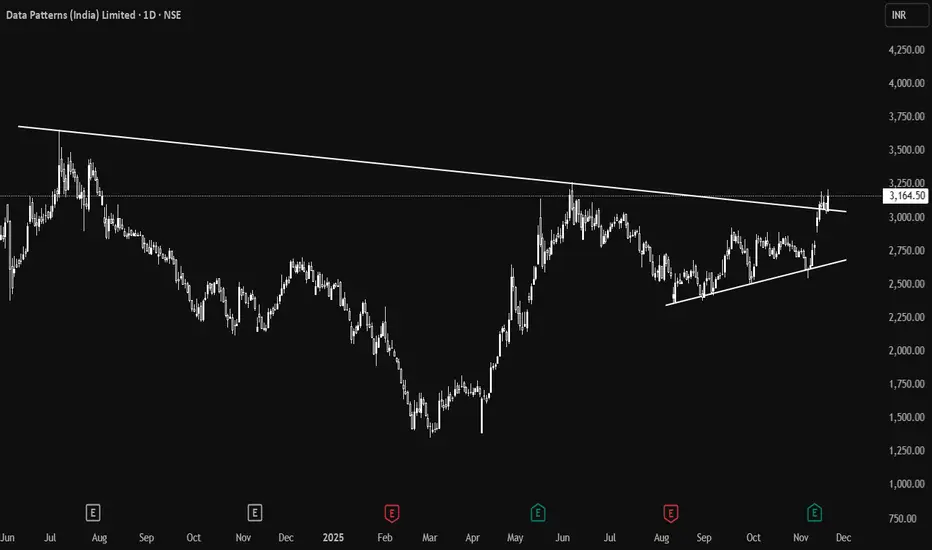
Data PatternsClean breakout with 3 rejections at the upper trendline on daily chart. Took an entry at 3100 post-confirmation with SL near 3000.
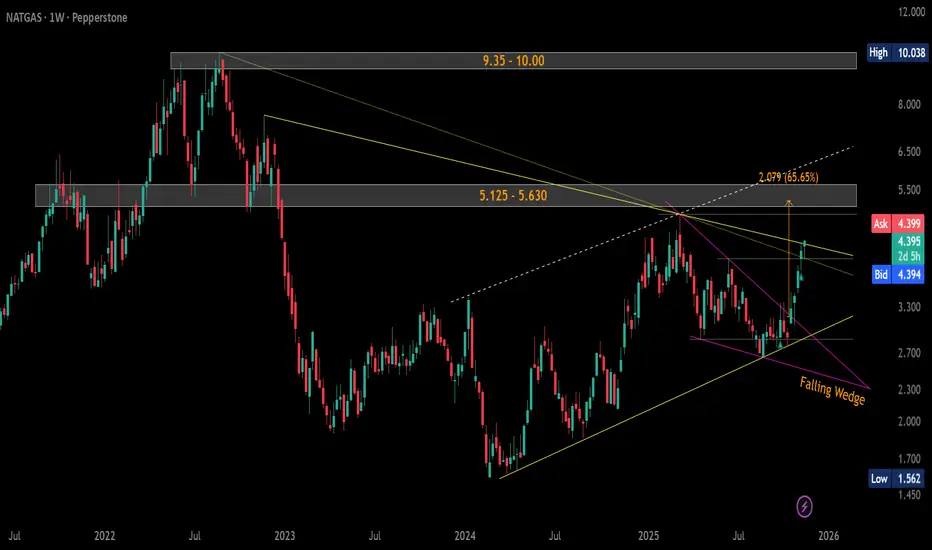
#NaturalGas ($NG) Weekly Update — Trading at Breakout ZoneCMP: $4.400
+54% from suggested levels and +58% from lows. 🚀
Price trading in the key resistance zone $4.339–4.417.
WCB > $4.417 = Symmetrical Triangle breakout → Falling Wedge target: $5.246 🎯
🛡 Supports: $4.067 / $3.803 / $3.625–$3.572
🚧 Major Resistances:
• ST: $5.125–$5.630
• LT: $9.35–$10.00
Tight structure… breakout looks close. 🔥
#NG VANTAGE:NG #NaturalGas #Commodities #PriceAction #SymmetricalTriangle #FallingWedge #ChartPatterns #Breakout
📌 #Disclaimer: This analysis is shared for educational purposes only. It is not a buy/sell recommendation. Please do your own research before making any trading decisions.
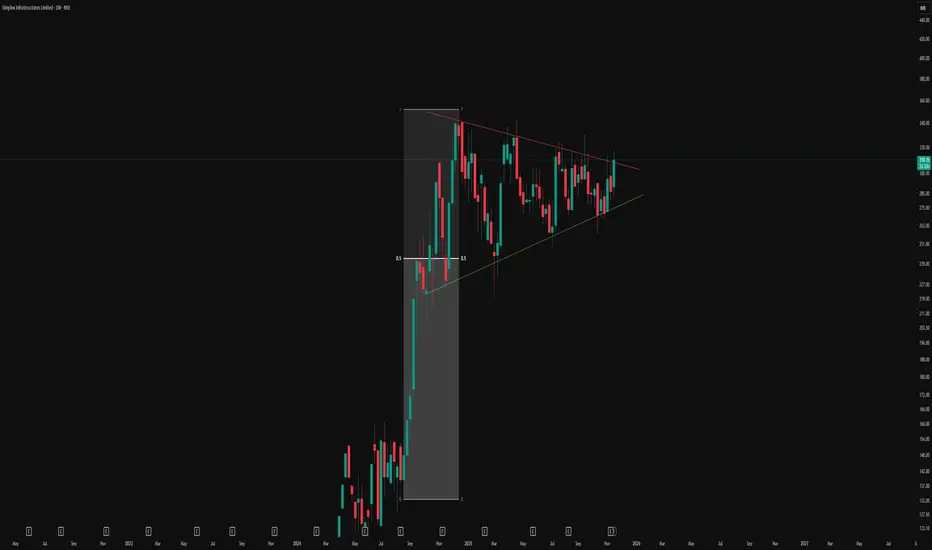
Symmetrical Triangle Formation with 50% EquilibriumVisual Structure and Pattern
-This chart illustrates a textbook symmetrical triangle pattern forming after a strong directional move.
-The red line represents the counter trendline (CT), connecting a series of lower highs.
-The green line marks the ascending trendline, connecting the sequence of higher lows.
-These converging lines encapsulate a contracting price structure, where volatility reduces over time, emphasizing indecision and consolidation among market participants.
-Symmetrical triangles predominantly represent phases where markets consolidate after an impulsive run, and both sides (bulls and bears) gradually reach a point of agreement before the next expansion.
-The 50% equilibrium level within triangles often acts as a magnet for price, attracting liquidity and providing reference for institutional flows, a concept vital for advanced swing trading and risk management.
This post is strictly for educational and analytical purposes, focusing only on chart structures and observable patterns. No content here should be taken as an indication of future price direction or as investment advice.
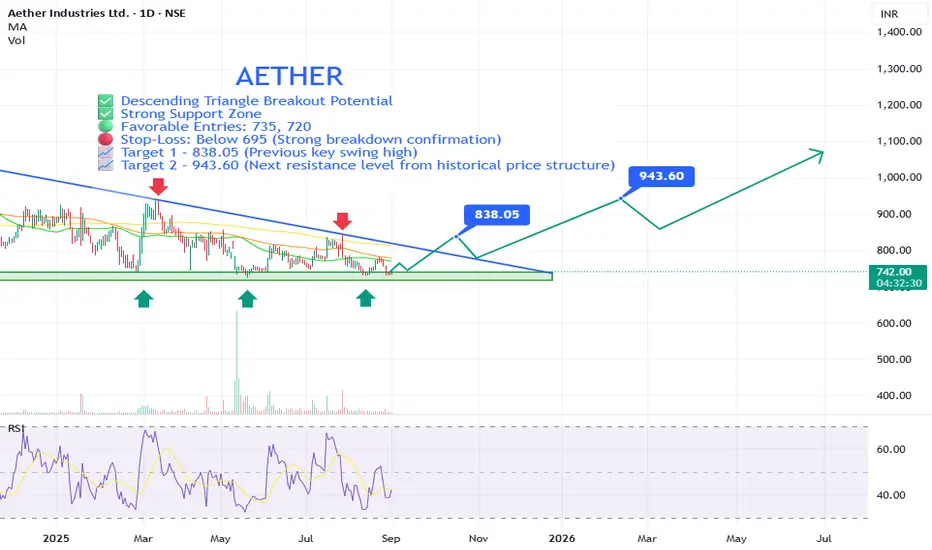
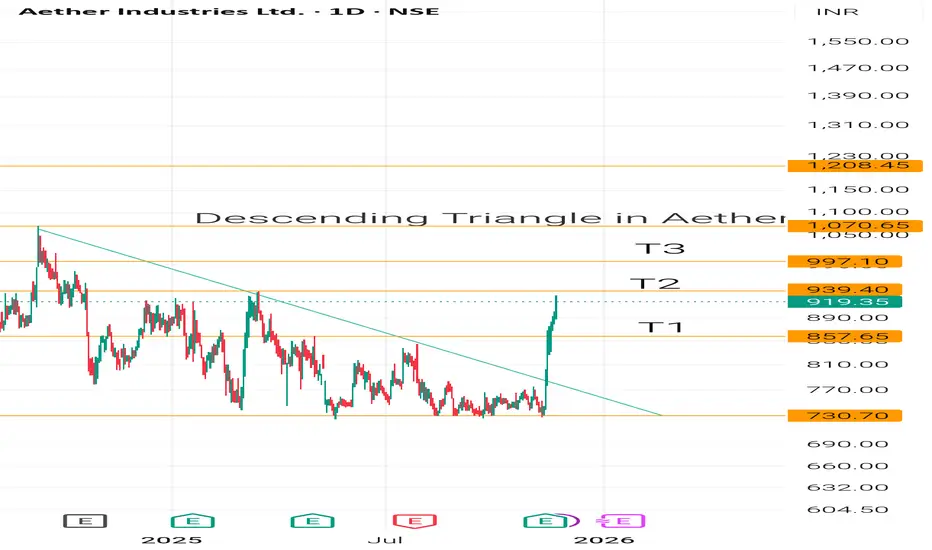
AETHER Bullish Reversal Setup with Strong Risk-Reward PotentialAether Industries Ltd is showing signs of a potential trend reversal from a well-established support zone, supported by a descending triangle breakout pattern and improving technical indicators. This setup suggests a strong risk-reward opportunity for swing traders and positional investors.
⚡ Key Technical Points:
🔵 Descending Triangle Breakout Potential: The price is nearing a breakout from a long-term descending triangle. A breakout above the trendline (~₹778–₹790) could trigger a strong uptrend.
🟢 Strong Support Zone: ₹700–₹720 has held as solid support multiple times (as marked by green arrows), indicating strong demand at these levels.
🟩 Bullish Divergence on RSI: Relative Strength Index (RSI) is showing higher lows while price remains flat or lower, indicating bullish divergence—a sign of potential reversal.
🟢 Favorable Entries: 735, 720
🔴 Stop-Loss: Below 695 (Strong breakdown confirmation)
📈 Target 1 – 838.05 (Previous key swing high)
📈 Target 2 – 943.60 (Next resistance level from historical price structure)
✅ Why This Is a Technically Strong Setup:
✅ Multiple Support Bounces: 700–720 zone has been tested at least 4 times in the last year, showing strength.
✅ Volume-Based Reactions: While volume is low now, past spikes at support zones suggest institutional interest.
✅ Clear Risk Management: Stop-loss is tight (~6–7%) with targets offering 1.5–3x risk-reward potential.
✅ Potential Trend Reversal: Break above descending trendline and moving averages could signal a shift to bullish structure.
✅ Long Base Formation: The stock has been consolidating for over a year—long base formations often lead to explosive moves.
📢 Disclaimer: This is not financial advice. Always do your own research or consult with a professional before making investment decisions.