DOMS – Multi-Month Triangle Breakout |________________________________________
💹 DOMS Industries Ltd (NSE: DOMS)
Sector: Consumer & Stationery Products | CMP: 2621.70 |
View: Multi-Month Symmetrical Triangle Breakout With Expanding Momentum
________________________________________
📊 Price Action:
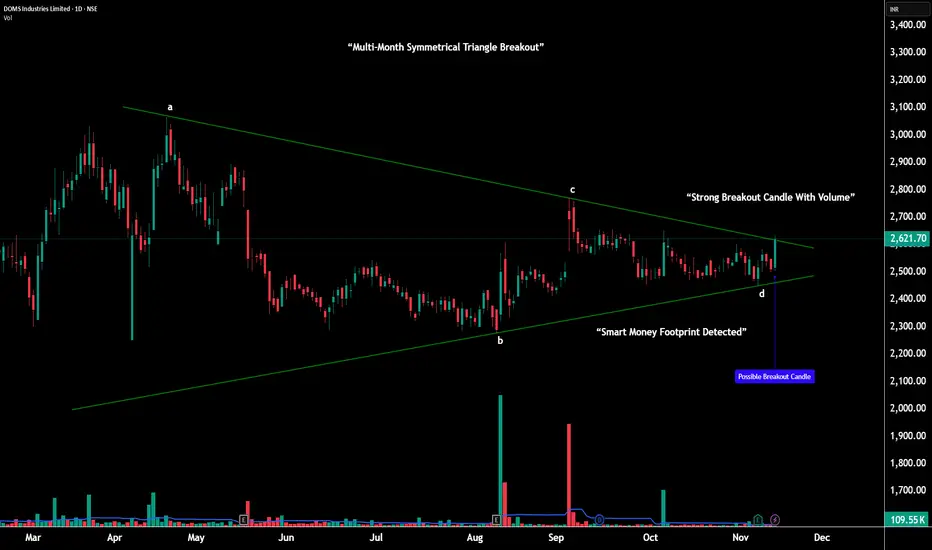
DOMS has spent the last five months forming a large symmetrical triangle — a volatility contraction structure marked by steady lower highs and higher lows from points A–B–C–D.
Throughout this period, buyers consistently defended the broader 2470–2500 demand belt, while sellers lost strength on every push lower.
This slow tightening shows how the market was preparing for a decisive move.
In the latest session, DOMS finally broke above the upper trendline, backed by a strong bullish range candle and a clear rise in volume, confirming the start of a fresh expansion phase.
________________________________________
📉 Chart Pattern Analysis – Large A–B–C–D Symmetrical Triangle:
This multi-month structure represents a major volatility compression following a previous uptrend — a classic continuation setup.
Point A: First major lower high
Point B: Deep anchor low
Point C: Lower high confirming supply weakening
Point D: Higher low showing demand strengthening
This clean A–B–C–D formation validates the symmetrical triangle perfectly.
As price approached the apex, volatility dried up, volume decreased, and the range narrowed — all ideal ingredients for a strong breakout.
The breakout candle now signals the end of compression and beginning of trend expansion.
________________________________________
📈 STWP Trading Analysis:
Bullish Breakout Zone: 2621.70 – 2633.20 | Stop Loss: 2498.60
The breakout candle shows high momentum and elevated volume, signaling institutional activity. Price has reclaimed all key moving averages with trend strength visible across 1H–1D–1W timeframes. As long as DOMS holds above the 2570–2590 structure zone, the bullish continuation bias remains active. Upside resistance levels can be used as potential levels of partial profit-taking, momentum checkpoints, and trend continuation targets.
________________________________________
🕯️ Candlestick Structure – Strong Bullish Breakout Candle:
The latest session printed a wide-range bullish candle, breaking through the upper triangle boundary decisively.
This type of candle — strong body, controlled wicks, clean range expansion — reflects conviction buying, not speculative spikes.
When this appears at the apex of a large compression pattern, it often marks the start of a new trending phase.
________________________________________
📏 Fibonacci Analysis:
Measured from swing low 2275.40 to swing high 2585.70:
38.2% @ 2393 → Secondary support
50% @ 2430 → Balanced support zone
61.8% @ 2467 → Strong golden zone (defended repeatedly)
The rebound from the 61.8% area aligns with the D-point of the triangle — reinforcing the structural validity and strengthening the breakout.
________________________________________
🧭 STWP Support & Resistance:
Resistances: 2667 | 2713 | 2794
Supports: 2540 | 2459 | 2413
The 2470–2500 region remains a major demand base, where the stock formed its higher lows at point D.
Immediate supply lies near 2667–2713, the first test zone after the breakout.
________________________________________
📊 STWP Volume & Technical Setup:
Volume climbed to 109.55K, significantly higher than recent averages — showing accumulation on the breakout.
RSI at 59 and Stochastic at 67 suggest healthy momentum with room for continuation.
MACD structure remains bullish, and multi-timeframe trend strength is intact.
Trend Direction: UPTREND | Volume Confirmation: Strong Buying Activity
________________________________________
🧩 STWP Summary View:
Momentum: Strong
Trend: Bullish
Risk: Moderate
Volume: High
DOMS has broken out of a large multi-month symmetrical triangle, a pattern known for initiating strong directional moves once volatility expands.
The structure remains bullish above 2570–2590, with continuation potential toward 2667 → 2713 → 2794 in the coming sessions.
________________________________________
⚠️ Disclosure & Disclaimer – Please Read Carefully
This analysis is for educational purposes only and should not be treated as investment advice.
I am not a SEBI-registered financial advisor.
Trading carries risk — use stop-loss, risk limits, and disciplined position sizing.
Please consult a SEBI-registered adviser before making trading decisions.
________________________________________
Position Status: No active position in (DOMS) at the time of this analysis.
Data Source: TradingView & NSE India
________________________________________
💬 Found this useful?
🔼 Boost this post to help more traders learn structured analysis
💭 Share your thoughts — does this breakout hold the strength for trend expansion?
🔁 Share with traders who study breakout structures
👉 Follow for more clean, price-action-driven institutional breakdowns
🚀 Stay Calm. Stay Clean. Trade With Patience.
Trade Smart | Learn Zones | Be Self-Reliant 📊
________________________________________
Triangle
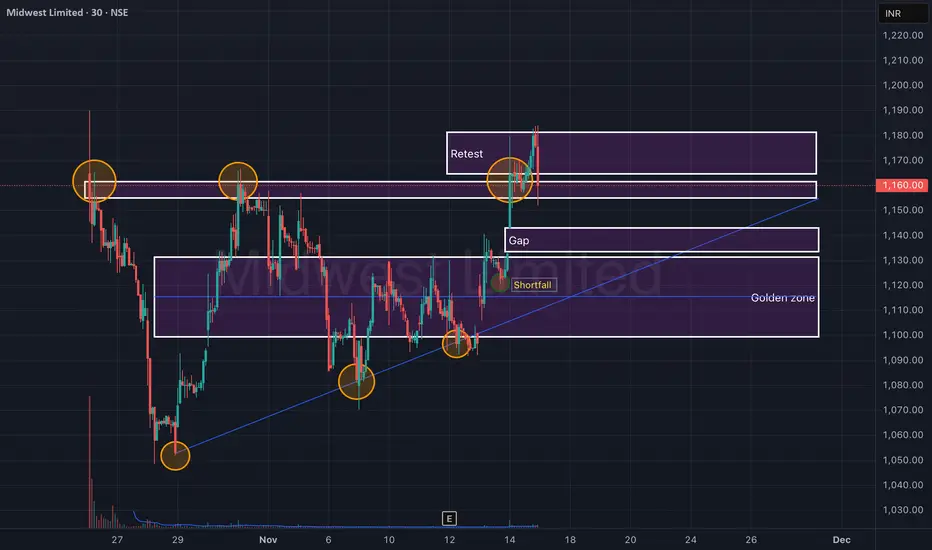
Midwest Ltd – Retest Confirmation After Breakout (30-Min)Midwest Ltd has shown a clean breakout–retest structure on the 30-minute timeframe, respecting both the trendline support and supply zones. The price successfully reclaimed the ₹1,140–₹1,150 range after a short pullback, confirming a bullish retest setup.
The chart highlights how historical rejections (orange circles) have turned into support retests, strengthening the validity of the breakout. If momentum sustains above ₹1,165, a continuation move toward ₹1,180+ could unfold.
🎯 Key Levels:
CMP: ₹1,160 (+3.95%)
Immediate Resistance (Retest Zone): ₹1,165 – ₹1,180
Support / Gap Zone: ₹1,130 – ₹1,145
Golden Zone (Major Support): ₹1,090 – ₹1,115
Stop-Loss: Below ₹1,120 (on 30-min closing basis)
📊 Technical View:
Ascending structure forming higher lows along trendline support.
Gap zone retested successfully, showing demand absorption.
Shortfall recovery followed by a sharp volume rise on breakout.
Sustaining above ₹1,165 may lead to a new swing leg toward ₹1,200.
🧠 View:
Midwest Ltd is showing a textbook breakout–retest structure. Sustaining above ₹1,165 with volume confirmation could trigger a quick 3–4% upside, while ₹1,115 remains the key demand zone.
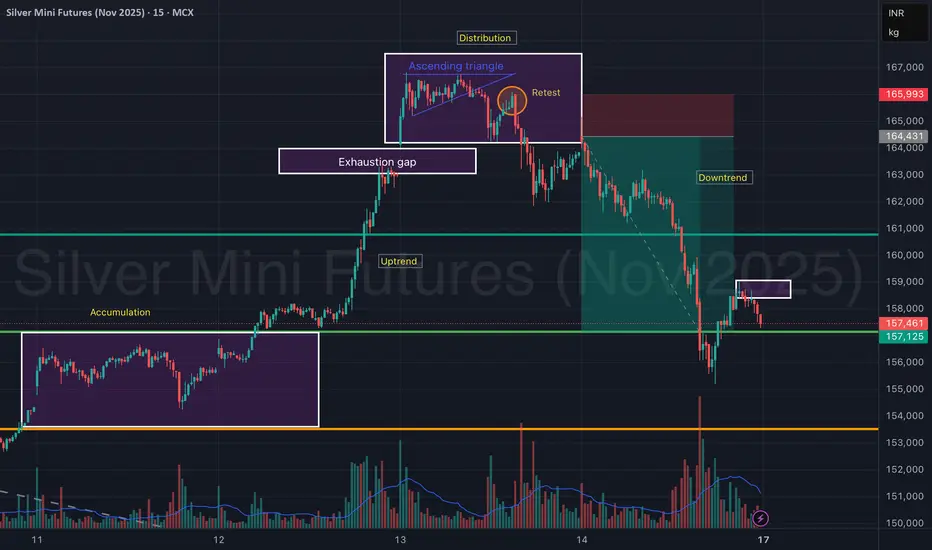
Silver Mini Futures (Nov 2025) – Accumulation to Distribution Silver Mini Futures on the 15-min chart clearly showcases a complete market cycle structure — transitioning from accumulation → uptrend → distribution → downtrend, providing an excellent study in price behavior and volume confirmation.
The move began with accumulation around ₹1,55,000, followed by a strong uptrend breakout, leading to a sharp rally. However, as price entered the ascending triangle near the ₹1,66,000 zone, momentum weakened, signaling distribution.
An exhaustion gap and a failed retest confirmed a reversal, leading to a steep downtrend, which remains active after a minor pullback.
📊 Phase Breakdown:
Accumulation Phase: ₹1,54,800 – ₹1,55,800
Sideways base formation with increasing volume at lows.
Uptrend Phase: Breakout above ₹1,56,000 triggered momentum.
Distribution Phase: Formed an ascending triangle with weak breakout follow-through.
Retest failure at ₹1,65,000 signaled exhaustion.
Downtrend Phase: Sharp decline with heavy volume, currently finding support near ₹1,57,000.
🎯 Key Technical Zones:
Resistance: ₹1,64,400 – ₹1,66,000 (supply zone)
Immediate Resistance (Retest Box): ₹1,58,200 – ₹1,58,800
Support Zone: ₹1,56,800 – ₹1,57,100
Major Support: ₹1,54,500
🧠 View:
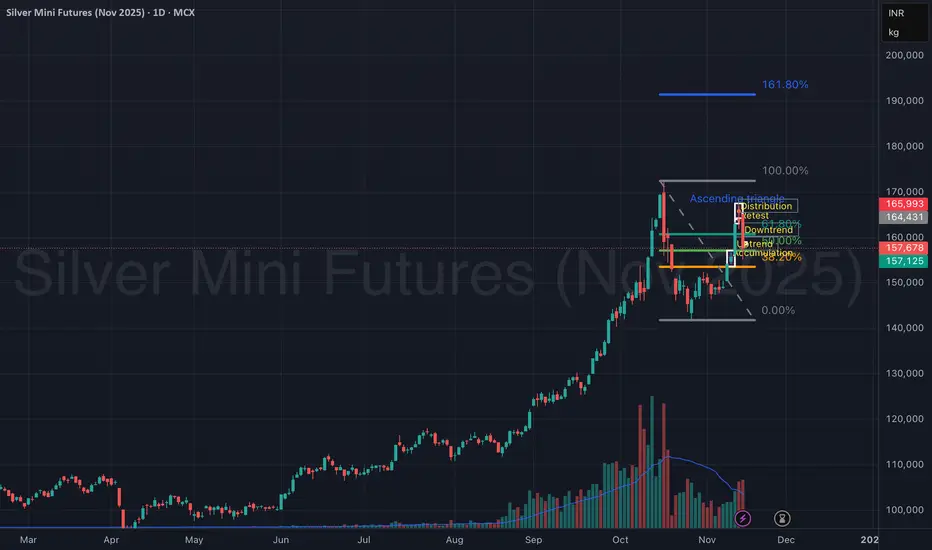
Silver Mini Futures is currently in a downtrend continuation phase after a distribution top. A minor retest near ₹1,58,800 could invite short opportunities, while only a sustained move above ₹1,60,000 may signal trend reversal strength.
Silver Mini Futures (Nov 2025) – Accumulation to DistributionSilver Mini Futures on the 15-min chart clearly showcases a complete market cycle structure — transitioning from accumulation → uptrend → distribution → downtrend, providing an excellent study in price behavior and volume confirmation.
The move began with accumulation around ₹1,55,000, followed by a strong uptrend breakout, leading to a sharp rally. However, as price entered the ascending triangle near the ₹1,66,000 zone, momentum weakened, signaling distribution.
An exhaustion gap and a failed retest confirmed a reversal, leading to a steep downtrend, which remains active after a minor pullback.
📊 Phase Breakdown:
Accumulation Phase: ₹1,54,800 – ₹1,55,800
Sideways base formation with increasing volume at lows.
Uptrend Phase: Breakout above ₹1,56,000 triggered momentum.
Distribution Phase: Formed an ascending triangle with weak breakout follow-through.
Retest failure at ₹1,65,000 signaled exhaustion.
Downtrend Phase: Sharp decline with heavy volume, currently finding support near ₹1,57,000.
🎯 Key Technical Zones:
Resistance: ₹1,64,400 – ₹1,66,000 (supply zone)
Immediate Resistance (Retest Box): ₹1,58,200 – ₹1,58,800
Support Zone: ₹1,56,800 – ₹1,57,100
Major Support: ₹1,54,500
🧠 View:
Silver Mini Futures is currently in a downtrend continuation phase after a distribution top. A minor retest near ₹1,58,800 could invite short opportunities, while only a sustained move above ₹1,60,000 may signal trend reversal strength.
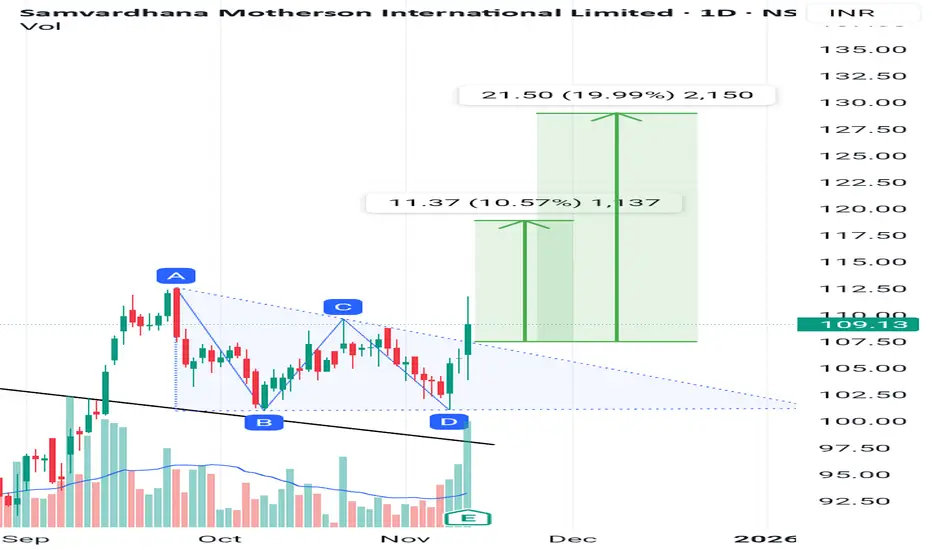
Samvardhana Motherson just made a triangle breakout.will it sustJust broke out of triangle pattern with good volume spike. Volumes are 3 times the average.
It brokeout of treandline on 12 September and gave a move of 10% before entring into consolidation of triangle pattern.
It just broke out of the pattern giving bullish signal.
Indicators
RSI is >60 which is a bullish signal
ADX is still weak at 13.38 although rising when compared to day before when it was 10.9
Entry at 110 looks safe
Might retrace till 100
SL at 95
Target at 119--130
Bharat Dynamics Ltd – Symmetrical Triangle Breakout on Watch (D)Bharat Dynamics is currently trading near a key breakout point of a symmetrical triangle pattern on the daily chart. After a prolonged downtrend, the stock has entered a consolidation phase, forming higher lows and compressing price action — a setup that often leads to a strong directional move.
Bharat Dynamics Q2 Results
✅ Net Profit: ₹216 Cr vs ₹123 Cr (YoY) — 🔼 up 75.5%
✅ Revenue: ₹1,147 Cr vs ₹545 Cr (YoY) — 🚀 strong growth
✅ EBITDA: ₹188 Cr vs ₹98.8 Cr (YoY) — 🔼 up 89.4%
✅ EBITDA Margin: 16.4% vs 18.1% (YoY) — 🔽 slight dip
The price has reclaimed the ₹1,500–₹1,530 zone, and a sustained close above ₹1,550 could confirm a breakout, opening the path for a quick momentum rally toward ₹1,650 and beyond.
🎯 Key Levels:
CMP: ₹1,525.70 (−0.95%)
Breakout Zone: ₹1,550 – ₹1,560
Target 1: ₹1,650 – ₹1,670
Target 2: ₹1,710 – ₹1,740
Resistance: ₹1,950 – ₹2,000
Stop-Loss: ₹1,470 (on daily close basis)
📊 Technical View:
Symmetrical triangle pattern forming after a prolonged correction.
Price compression with reduced volume indicates breakout buildup.
Breakout confirmation expected above ₹1,560 with increasing volume.
If sustained, the move could extend toward the higher resistance zone around ₹1,950+.
🧠 View:
Bharat Dynamics is at a decisive point — a breakout above ₹1,550–₹1,560 with volume can mark the start of a short-term uptrend. Keep an eye on price action near this level for confirmation.

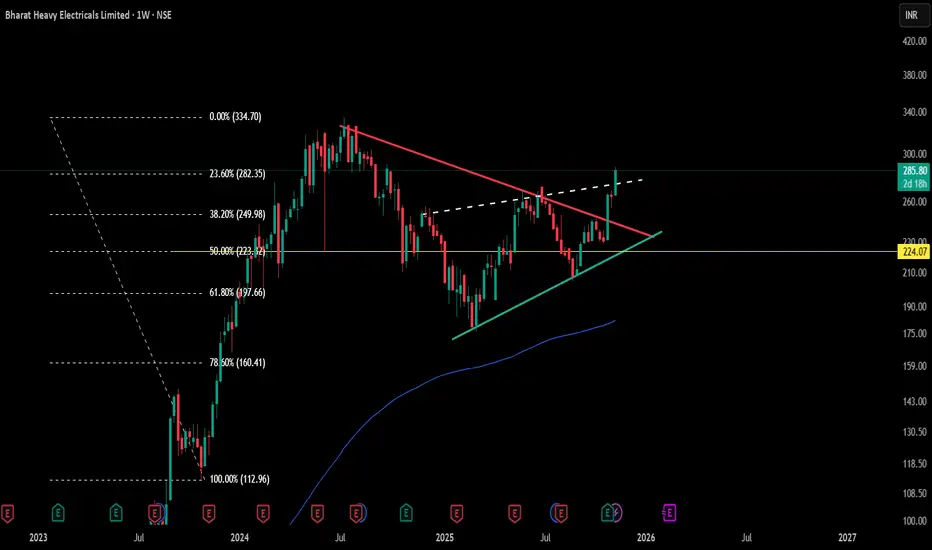
Symmetrical Triangle Structure & Key EquilibriumEditorial Insights
- Symmetrical triangles signal a balanced tug-of-war between buyers and sellers; this compression, as mapped here, often precedes significant expansions in volume and volatility.
- The triangular structure’s edges—CT (red) and trendline (green)—have been tested repeatedly over months, reflecting both supply absorption and demand resilience.
- The hidden white line adds a subtle layer of convergence, useful for traders identifying areas of potential liquidity concentration.
- The yellow 50% Fibonacci level frames the equilibrium for this market phase, offering a snapshot of price discovery dynamics within the triangle.
- Price positioning relative to all these lines is best seen as a way to monitor evolving order flow and market intent, without any explicit forecasting or directional bias.
Key Levels & Reference
- CT (Red): Major supply test points.
- Trendline (Green): Demand and higher low sequence.
- Hidden Line (White): Structural convergence not visibly obvious but influential.
- Fibonacci 50% (Yellow): Core equilibrium reflecting price agreement zone.
This post is for educational and analytical purposes, respecting the principle that all information is a visual observation—not a prediction or directional signal, but a live structure map to enrich your pattern playbook.

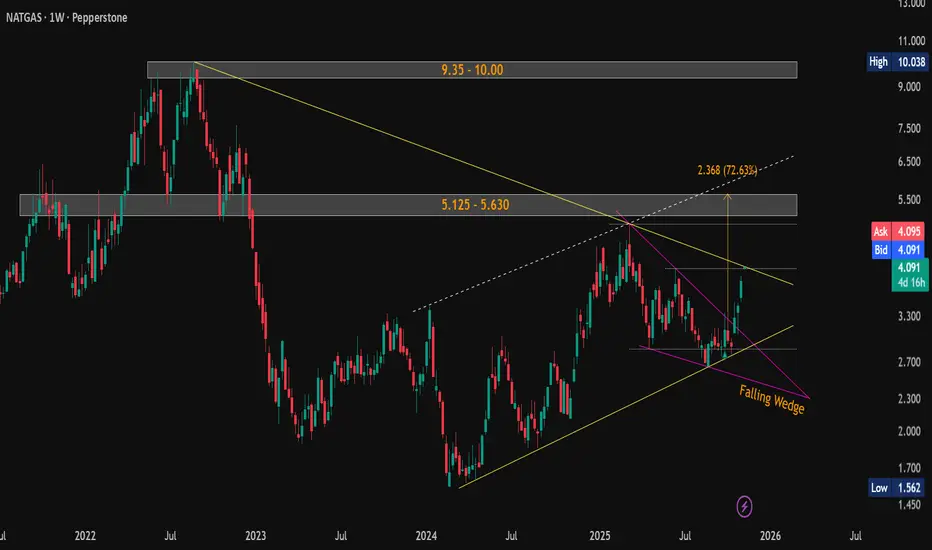
#NaturalGas ($NG) Weekly Update — Testing Critical Resistance!CMP: $4.092
💥 Up +38% from mentioned support ( $3.013–$2.956 ) and +46% from lows in a month . 🚀
The falling wedge breakout played out strongly, and price is now testing the critical resistance of the falling yellow trendline near the previous swing high $4.067 .
A weekly close above this trendline will confirm a major breakout , potentially triggering the next leg higher.
📊 Key Levels:
🛡 Supports: $4.067 / $3.013–$2.956 / $2.692–$2.643
🚧 Resistances / Targets: $5.125–$5.630 / $9.35–$10.00
Structure now forming a larger Symmetrical Triangle between rising and falling yellow trendlines — watch for breakout confirmation .
⚠️ Possible short-term pause/retest before continuation.
#NaturalGas #NG #Commodities #FallingWedge #RisingChannel #SymmetricalTriangle #ChartPattern #PriceAction
📌 #Disclaimer: This analysis is shared for educational purposes only. It is not a buy/sell recommendation. Please do your own research before making any trading decisions.
Silver Triangle BreakoutSilver is attempting breakout forming a ascending triangle pattern on 1h and 4h timeframe. It is also trading above 200ema.

Suzlon (W): Cautiously Bullish, Pending BreakoutThis is a classic "wait and watch" scenario. The stock is coiling in a major, year-long consolidation pattern, and the pressure is building. A powerful fundamental catalyst (record-breaking results) is now meeting a critical technical resistance, setting the stage for a significant move.
📈 1. The Long-Term Context
- The Run-Up: After hitting its all-time low in March 2020, the stock has been in a massive, multi-year uptrend, which paused in September 2024.
- The Pattern: The stock has been consolidating in a Symmetrical Triangle for over a year. This pattern indicates a period of indecision and contracting volatility—a "coiling spring" before its next major trend.
- The Foundation: The long-term trend remains bullish, supported by an active Golden Cross (50/200 SMA) on both the Weekly and Monthly charts .
🚀 2. The Current Setup (The Decisive Hurdles)
The stock is currently squeezed between two key resistance levels that must be broken:
1. A Short-Term Horizontal Resistance: A minor "lid" formed around ₹59-₹61 .
2. The Primary Angular Resistance: The main, multi-month downtrend line that forms the top of the Symmetrical Triangle.
The stock must first break the short-term horizontal level to gain the momentum needed to challenge the main triangle.
📊 3. Indicators & Catalysts
Conflicting indicators are observed which is the key. This is a classic feature of a consolidation phase:
- Short-Term (Weak): The RSI is down (currently in neutral/sell territory), and the short-term EMAs are not yet in a PCO state . This shows the immediate price action is choppy and lacks momentum.
- Long-Term (Strong): The active Golden Cross on higher timeframes shows the underlying trend is still firmly bullish.
- The Catalyst: The "good results" are a massive fundamental driver. The company just reported its highest-ever quarterly net profit (a 539% YoY increase) and a record 85% revenue jump . This provides a strong fundamental case for the triangle to break to the upside .
🎯 4. Future Scenarios & Key Levels to Watch
This is a "wait for confirmation" setup.
🐂 The Bullish Case (Two-Step Breakout)
- Trigger 1 (Short-Term): A decisive, high-volume breakout and close above the horizontal resistance (₹61) .
- Target 1: This would likely trigger a quick move to the first target of ₹65 .
- Trigger 2 (Long-Term): A sustained move that breaks the main angular resistance of the triangle.
- Target 2: This confirms the end of the year-long consolidation and opens the door to long-term target of ₹74 .
🐻 The Bearish Case (Breakdown)
- Trigger: If the stock fails to break out (due to weak short-term momentum) and instead breaks the triangle's support .
- Target: The price would likely fall to retest the recent support level, which is the identified zone of ₹51 - ₹53 .

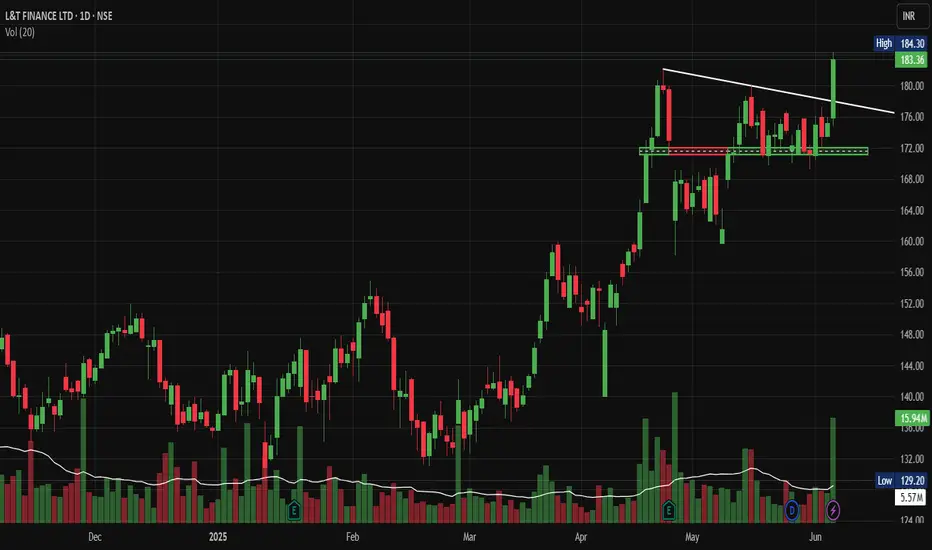
LTF Breaking Out of Consolidation and ascending triangleNSE:LTF : Breaking Out of Consolidation and ascending triangle with heavy volumes today - Is This the Next Big NBFC Move?
Price Action Analysis:
• Base Formation: Clear sideways movement between ₹160-172 levels
• Breakout Confirmation: Recent breach above ₹172 resistance with volume expansion
• Trendline Break: White descending trendline from December highs decisively broken
• Market Structure: Shift from the consolidation phase to the potential trend resumption
• Time Frame: A six-month base provides a strong foundation for sustained movement
Volume Analysis:
• Current Volume: 5.57M against 20-day average of 15.94M
• Volume Pattern: Accumulation visible during the base formation period
• Support Tests: Volume spikes coinciding with successful ₹160-164 support tests
• Breakout Volume: Adequate but not exceptional - requires monitoring for follow-through
• Distribution Signs: No significant selling pressure visible during consolidation
Key Support & Resistance Levels:
Support Levels:
• Immediate Support: ₹172 (new floor post-breakout)
• Secondary Support: ₹168 (previous resistance turned support)
• Major Support: ₹160-164 (primary consolidation base)
• Critical Support: ₹155 (breakdown level)
Resistance Levels:
• Immediate Resistance: ₹190-195 (measured move target)
• Next Resistance: ₹205-210 (psychological and technical zone)
• Long-term Target: ₹220-225 (extension target)
Trade Setup:
Entry Strategy:
• Aggressive Entry: Current levels ₹183-184 for momentum traders
• Conservative Entry: ₹175-177 on pullback to breakout zone
• DCA Approach: Scale in between ₹175-185 levels
Exit Strategy:
• Target 1: ₹192 (measured move from rectangle pattern)
• Target 2: ₹205-210 (next significant resistance)
• Target 3: ₹220+ (extension target for long-term holders)
Stop Loss:
• Closing Basis: Below ₹170
• Intraday Basis: Below ₹168
• Risk Percentage: 7-8% from current levels
Position Sizing & Risk Management:
Position Sizing:
• Conservative: 1% portfolio risk
• Moderate: 1.5% portfolio risk
• Aggressive: 2% portfolio risk (maximum recommended)
Risk Management:
• Stop Loss Discipline: Strict adherence to ₹170 closing stop
• Position Scaling: Reduce position if breaks ₹175 intraday
• Profit Booking: Book 30% at ₹192, 40% at ₹205
• Trailing Stop: Implement above ₹195 levels
Sectoral Backdrop:
NBFC Sector Positives:
• Credit Growth: NBFC credit growth outpacing bank credit
• Market Share: Gaining share in retail and SME segments
• Asset Quality: Improving collection efficiency post-COVID
• Regulatory Support: Favourable policy environment
Sector Trends:
• Digital Lending: Increased adoption of technology platforms
• Rural Focus: Growing emphasis on semi-urban and rural markets
• Partnership Models: Collaborations with fintech companies
Fundamental Backdrop:
Company Strengths:
• Group Support: Strong L&T Group parentage and backing
• Diversified Portfolio: Exposure across infrastructure and retail segments
• Quality Borrowers: Access to L&T Group ecosystem clients
• Management Quality: Experienced leadership team
Recent Developments:
• Asset Quality: Improving NPA ratios
• Profitability: Better margins and ROE metrics
• Growth Strategy: Focus on profitable growth segments
Risk Factors:
Technical Risks:
• False Breakout: Possibility of returning to the consolidation range
• Volume Confirmation: Need for sustained volume support
• Market Correlation: High beta to financial sector performance
Fundamental Risks:
• Interest Rate Risk: Rising rates impacting lending margins
• Credit Quality: Potential stress in the retail lending portfolio
• Economic Slowdown: Impact on borrower repayment capacity
• Regulatory Changes: Policy shifts affecting NBFC operations
Market Risks:
• Sector Rotation: Money moving away from financial stocks
• Liquidity Concerns: Tightening of wholesale funding markets
• Competition: Increased competition from banks and fintech
My Take:
The technical setup suggests accumulation phase completion with potential for a significant move higher. Follow the Strict Trade Plan as Explained Above.
Keep in the Watchlist.
NO RECO. For Buy/Sell.
📌Thank you for exploring my idea! I hope you found it valuable.
🙏FOLLOW for more
👍BOOST if you found it useful.
✍️COMMENT below with your views.
Meanwhile, check out my other stock ideas on the right side until this trade is activated. I would love your feedback.
Disclaimer: "I am not a SEBI REGISTERED RESEARCH ANALYST AND INVESTMENT ADVISER."
This analysis is intended solely for informational and educational purposes and should not be interpreted as financial advice. It is advisable to consult a qualified financial advisor or conduct thorough research before making investment decisions.
VCP Formation within Symmetrical Triangle above 200 EMAThis chart displays a Volatility Contraction Pattern (VCP) developing within a classic symmetrical triangle on the daily timeframe. Two sharply converging trendlines encapsulate the price action with the lower line connecting a series of higher lows (the trendline) and the upper line linking lower highs (counter trendline). Such convergence is characteristic of symmetrical triangles, which represent a period of price consolidation and equilibrium between buyers and sellers.
Volume tends to contract as the pattern matures, signaling market indecision and reduced volatility. Notably, this consolidation is taking place right around the 200-day moving average, which serves as an important reference point for longer-term market participants. The convergence of price and volume patterns here aligns with textbook VCP behaviour and highlights the potential for significant crowd psychology shifts.
This post’s intent is observational and educational, focusing on the visual behavior of price and volume embedded within technical patterns. Studying such symmetries can strengthen understanding of market structure and technical analysis skills, allowing for systematic review rather than speculative outlooks or trade signals.
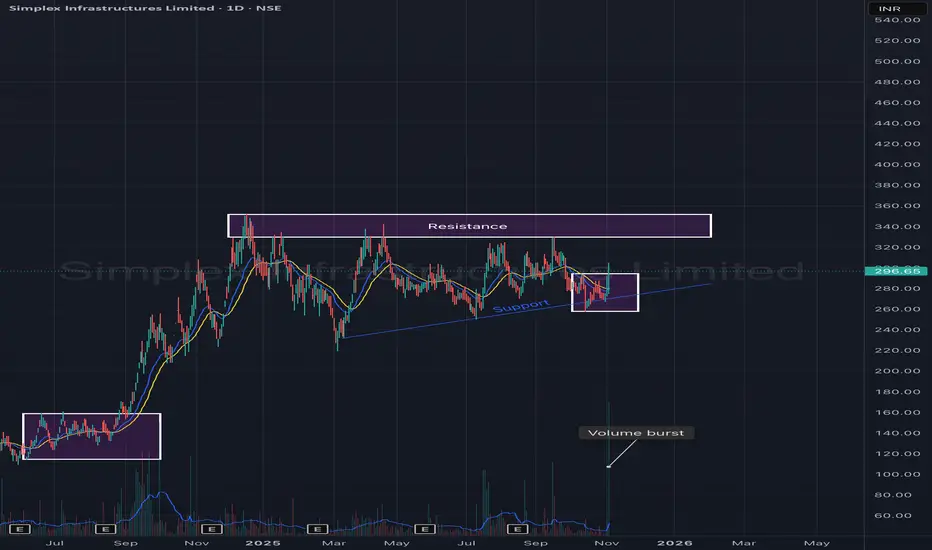
Simplex Infrastructures Ltd – Ascending Triangle Formation with Simplex Infrastructures is showing signs of accumulation and trend continuation within an ascending triangle pattern on the daily chart. The stock has been consistently forming higher lows while facing resistance around the ₹330–₹340 zone.
A recent volume burst near the support trendline indicates strong buying interest from lower levels — hinting at a potential breakout attempt in the coming sessions.
🎯 Key Levels:
CMP: ₹296.65 (+3.20%)
Support Trendline: ₹270 – ₹280
Resistance Zone: ₹330 – ₹340
Breakout Target: ₹370 – ₹390
Stop-Loss: ₹270 (on daily close basis)
📊 Technical View:
Formation of a higher-low structure within an ascending triangle.
Strong volume activity around support confirms accumulation.
Short-term EMAs are flattening, awaiting breakout confirmation.
A close above ₹340 with volume could trigger the next up leg toward ₹380+.
🧠 View:
Simplex Infra is building strength within a bullish ascending triangle pattern. A decisive move above ₹340 may confirm breakout momentum, supported by the recent volume surge, while the rising trendline continues to act as a strong base.
Supriya Lifescience (W): Bullish, Awaiting Breakout ConfirmationThe stock is in a classic bullish consolidation pattern. After establishing a major bottom in March 2023, the price has been in a clear uptrend. The current "Ascending Triangle" pattern shows that pressure is building for a significant move.
📈 1. The Dominant Pattern: Ascending Triangle
- Formation: Since October 2024, the stock has been forming a clear Ascending Triangle. This is defined by:
1. A flat, horizontal resistance line that has rejected multiple breakout attempts.
2. A rising support trendline , indicating that buyers are stepping in at progressively higher prices.
- Implication: This pattern is bullish because it shows that sellers are holding a fixed line, but buyer aggression is steadily increasing.
🚀 2. The Current Setup (The "Coiling Spring")
- Pressure Building: The stock has made several attempts to break the resistance and failed. This is normal and builds energy for the eventual move.
- Imminent Test: The stock is once again testing this critical resistance this week . The price is being compressed between the rising support and the flat resistance, which usually precedes a volatile move.
📊 3. Key Technical Indicators
- RSI: The Relative Strength Index is rising on both the Monthly and Weekly timeframes. This shows that long-term and medium-term momentum is building in favor of the buyers.
- EMAs: The short-term Exponential Moving Averages are in a "PCO" (Price Crossover) state, confirming the immediate trend is bullish.
🎯 4. Future Scenarios & Key Levels to Watch
This setup provides two very clear outcomes:
🐂 The Bullish Case (Breakout)
- Trigger: A decisive, high-volume close above the horizontal resistance of the triangle.
- Confirmation: This move would confirm the triangle is complete and the next leg of the uptrend has begun.
- Target: The next logical price target would be ₹1,300 .
🐻 The Bearish Case (Breakdown)
- Trigger: The stock fails at resistance again and, more importantly, breaks below the triangle's rising support trendline .
- Confirmation: This would invalidate the bullish pattern.
- Target: The price would likely fall to retest the next major horizontal support level at ₹710 .

Astral - Good to see breakout soon.Astral is forming a ascending triangle pattern and looks good to buy at this level.
Short term it can reach to 1580-1590.
If cross and sustain above 1600, We can see 2000-2200.
Good to buy and hold for the next 6-12 months.

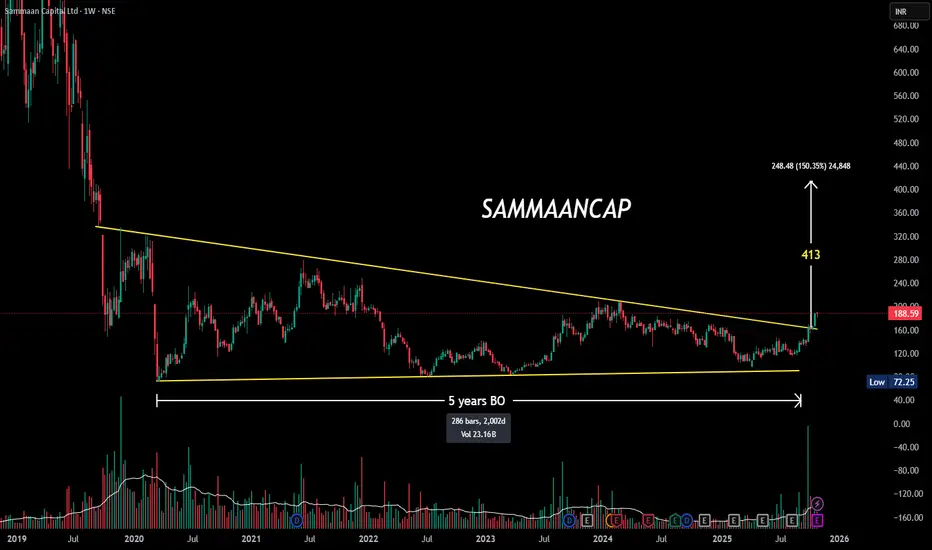
SAMMAANCAP | 5-Year Symmetrical Triangle Breakout at ₹165!📈 #SAMMAANCAP | #TechnicalAnalysis
💥 5-Year Symmetrical Triangle Breakout at ₹165!
After a long consolidation, price breaks out with rising volume — a strong sign of trend reversal despite current negative earnings.
🔹 Pattern: Symmetrical Triangle
🔹 Breakout Zone: ₹165
🔹 CMP: ₹188
🔹 P/E: -5.9 (Loss-making)
🔹 P/BV: 0.7
🔹 Sector: Finance
⚙️ Sustaining above ₹165 could open room toward ₹220–₹240 over the medium term.
#PriceAction #BreakoutStocks #TradingView #ChartPatterns #SwingTrading #StockMarketIndia #TechnicalAnalysis #VolumeBreakout
BEL (Bharat Electronics Ltd) – Ascending Triangle Setup 🟢 BEL (Bharat Electronics Ltd) – Ascending Triangle Setup | Breakout Watch 🚀
📊 Chart Setup:
BEL is forming an ascending triangle pattern on the daily chart — a bullish continuation setup. The breakout level is around ₹435. Confirmation will come with a daily close above ₹435.
🔹 Targets: ₹455 / ₹480
🔹 Support: ₹408
🔹 Pattern: Ascending Triangle (yet to break)
🔹 View: Wait for confirmation candle close above the resistance zone for sustained momentum.
💼 Fundamental Update – Q2 FY25 Results 🛰️
BEL posted strong Q2 numbers beating estimates across all metrics:
• Net Profit: ₹1,285 Cr ↑ vs Est ₹1,143 Cr — Beat
• Revenue: ₹5,764 Cr ↑ vs Est ₹5,359 Cr — Beat
• EBITDA: ₹1,695 Cr ↑ vs Est ₹1,482 Cr — Beat
• EBITDA Margin: 29.42% ↑ vs Est 27.7% — Beat
➡️ Strong all-round performance with robust revenue growth and healthy margins, adding confidence to the bullish setup.
📈 For educational purpose only. Not a buy/sell recommendation.

NBCC 1 DAY CHART🟢 NBCC – Symmetrical Triangle Breakout (1D Chart)
📈 Chart Setup:
NBCC has given a clear breakout from a symmetrical triangle pattern on the daily timeframe, indicating a possible trend continuation.
🔹 Volume: Noticeable rise in volume during breakout, confirming strong participation.
🔹 Trend: Price sustaining above breakout zone.
🔹 Key Levels:
Breakout Zone: ₹117
Immediate Support: ₹112, 109
Next Resistance Target: ₹125
💡 View:
If the price sustains above the breakout level, further upside momentum can be expected. A retest of the breakout zone may offer a good risk–reward entry opportunity.
📊 For educational purpose only. Not a buy/sell recommendation.

IOC ASCENDING TRIANGLE BREAKOUTIOC breaking ascending triangle weekly basis
with huge volume this week
RSI bullish above 60
trading above 20 week ema
target1 180 target 2 can be 196
NO BUY/SELL RECOMENDATION

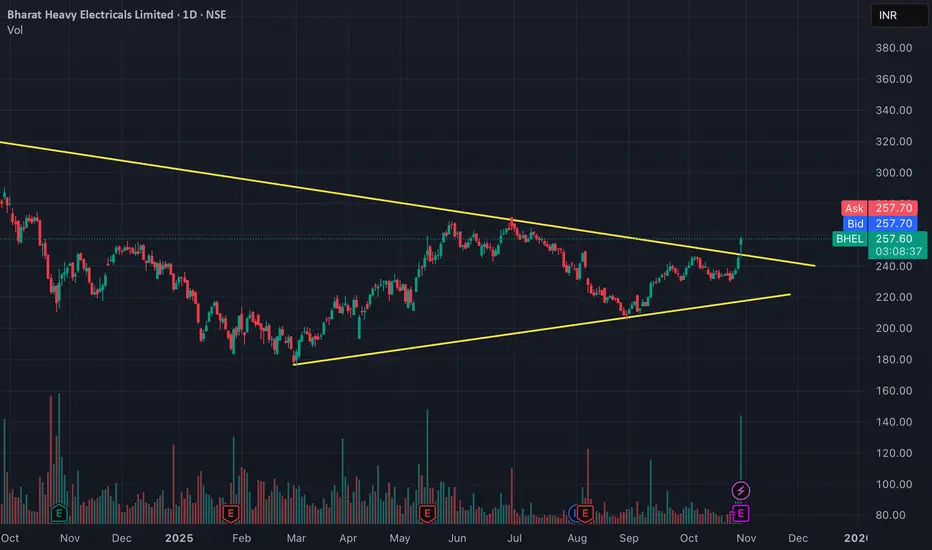
Breakout - BHELThere is a breakout in triangle pattern in BHEL with a strong volume. It is expected to give minimum 5% returns.
Disclaimer: Make you own analysis before investment
MRPL Triangle BreakoutMRPL has given a Breakout after forming a Triangle Pattern on 1D timeframe with very high volumes. The stock is also trading above its 200EMA.

Is Wave 5 About to Lift Indian Bond Yields Higher?After a strong impulsive rise from 6.13% to 6.65%, the India 10-Year Government Bond Yield appears to be consolidating in a textbook Wave 4 contracting triangle . Each leg within the pattern—(a) through (e)—shows the typical compression seen before the final thrust in yields.
If this interpretation holds, a Wave 5 breakout may soon lift yields higher toward or beyond the 6.7% region, completing the larger five-wave structure.
Market Implication:
A rise in bond yields usually reflects tightening liquidity and can act as a short-term headwind for equity indices such as the Nifty. Traders may want to watch this triangle’s resolution closely—an upside break in yields could coincide with a cooling phase in the broader market, while a failed breakout would favor continued equity strength.
Chart Note:
Contracting Wave 4 Triangle – Prepping for the Final Yield Thrust (Wave 5)
Disclaimer: This analysis is for educational purposes only and does not constitute investment advice. Please do your own research (DYOR) before making any trading decisions.
