Is Wave 5 About to Lift Indian Bond Yields Higher?After a strong impulsive rise from 6.13% to 6.65%, the India 10-Year Government Bond Yield appears to be consolidating in a textbook Wave 4 contracting triangle . Each leg within the pattern—(a) through (e)—shows the typical compression seen before the final thrust in yields.
If this interpretation holds, a Wave 5 breakout may soon lift yields higher toward or beyond the 6.7% region, completing the larger five-wave structure.
Market Implication:
A rise in bond yields usually reflects tightening liquidity and can act as a short-term headwind for equity indices such as the Nifty. Traders may want to watch this triangle’s resolution closely—an upside break in yields could coincide with a cooling phase in the broader market, while a failed breakout would favor continued equity strength.
Chart Note:
Contracting Wave 4 Triangle – Prepping for the Final Yield Thrust (Wave 5)
Disclaimer: This analysis is for educational purposes only and does not constitute investment advice. Please do your own research (DYOR) before making any trading decisions.
Triangle

Supply-Demand Squeeze: Symmetrical Triangle at the Flip zoneWitness a textbook supply-demand play on the monthly chart of Bharat Wire Ropes Ltd. as price contracts above a major zone conversion! The chart highlights a high-probability symmetrical triangle pattern—marked with a red counter trendline (lower highs) and a green trendline (higher lows).
This powerful squeeze forms right at the intersection of key supply and demand zones.
- Both supply (resistance) and demand (support) have been mapped for clear zone analysis.
- The symmetrical triangle shows classic price contraction
- Red line: Counter trendline connecting lower highs.
- Green line: Trendline connecting higher lows.
Disclaimer:
This Observation / Post is for educational purposes only and does not constitute investment advice. Please do your own research and consult with a financial advisor before making any trading decisions.

XAUUSD Analysis - Levels and Pridiction#Gold (XAU/USD) Technical Analysis - October 27, 2025
Current Market Status: Retracement on Higher Time Frame,
Lower Timeframe Bearish Breakdown⚠️
Gold is trading at 4,033.67, having broken down from the previous #consolidation zone. The market has violated key support levels and is now showing clear bearish momentum with multiple technical confirmations.
Critical Technical Developments:
1️⃣ Triangle Pattern Breakdown (1H Chart)
The 1-hour chart reveals a confirmed triangle #pattern breakout to the downside. After breaking below the triangle support, price attempted a retest of the breakdown level around 4,093-4,144 but was rejected, confirming the pattern's validity. This is a classic bearish continuation signal.
2️⃣ Demand Zone Invalidation
A crucial demand level that previously held multiple tests has now been completely invalidated. The chart explicitly notes: "Demand Level to be invalidated to move the Price Further Down" - this condition has been met, opening the path for deeper downside movement.
3️⃣ Minor Trend Shift Level Breach
Price has broken below the **Minor Trend Shift Level** at approximately 4,093, confirming a shift from bullish to bearish short-term structure. This level now acts as resistance.
Target Zones (High Probability):
🎯 Immediate Targets:
- 3,945 - Next support cluster (current proximity)
- 3,845 - 0.5 Fibonacci retracement level (PRIMARY TARGET)
- 3,719 - 0.618 Fibonacci retracement level (EXTENDED TARGET)
The Fibonacci levels in green boxes, are the key magnetic zones for price action.
📉 Bearish Continuation (70% Probability)
Price continues lower toward 3,845, potentially extending to 3,719 if selling pressure intensifies. This move would represent a healthy correction within the broader uptrend from the yearly lows.
📈 Bullish Reversal (30% Probability)
Requires reclaiming 4,144 with strong momentum AND holding above it on daily timeframe. Only then would the bearish structure be invalidated.
Conclusion:
Gold remains in a confirmed downtrend on lower timeframes with clear downside targets visible. The invalidation of demand zones and triangle breakdown provide strong bearish confirmation. Traders should focus on the 3,845-3,719 zone as the primary area of interest for potential reversal setups. Until price reclaims 4,150+, the path of least resistance remains **DOWN**.
Risk Management: Use proper position sizing as volatility remains elevated. The 3,845 level will be crucial - watch for buyer reaction there.

Triangle breakout in EdelweissEdelweiss is showing good triangular breakout on monthly.
Also it has taken support at monthly 20ma
Good risk reward trade is possible.
Target SL on chart.
Since it is monthly breakout target will take 4~6 months.

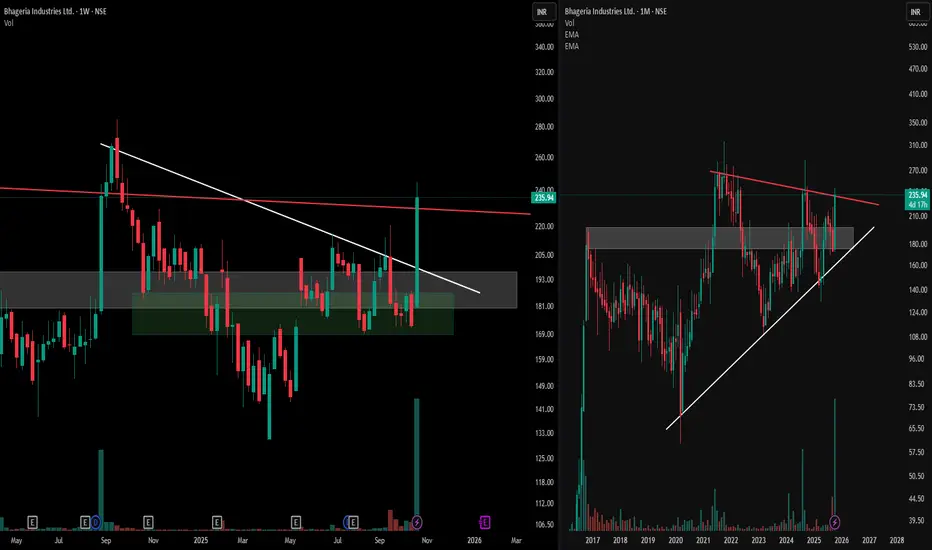
Mastering MTFA Charts : Symmetrical & Descending PatternsObserve the synergy of multiple time frames with this detailed analysis of Bhageria Industries Ltd.
Target Points -
1) The right panel displays a monthly chart, highlighting a broad symmetrical triangle formation within a prominent supply-demand zone—notice how the structure showcases the interplay of lower highs and higher lows, reflecting a period of equilibrium and market compression.
2) The left panel brings the focus to the weekly time frame, where a descending triangle pattern unfolds, providing additional insight into the ongoing price structure.
3) This multi-time frame approach emphasizes how patterns from broader time frames interact with shorter-term consolidations, enhancing our ability to spot critical decision areas on the charts.
4) Using both the monthly and weekly perspectives together, traders and learners can deepen their understanding of structural price action, pattern development, and the relevance of context provided by supply and demand zones. Dissecting these formations side by side promotes disciplined, informed chart reading without bias towards anticipating outcomes.
This analysis is for educational purposes only and does not constitute financial advice.
HFCL Cmp 77.74 Ascending Triangle PatternHFCL Cmp 77.74 Dated 24-10-2025
1. Ascending Triangle Pattern BO @ 79
Buy @ Cmp for riskers trades
Safe traders buy above 79 SL 75 target 80-81-83-84-85-87-88-89
It is just a view, please trade at your own risk.

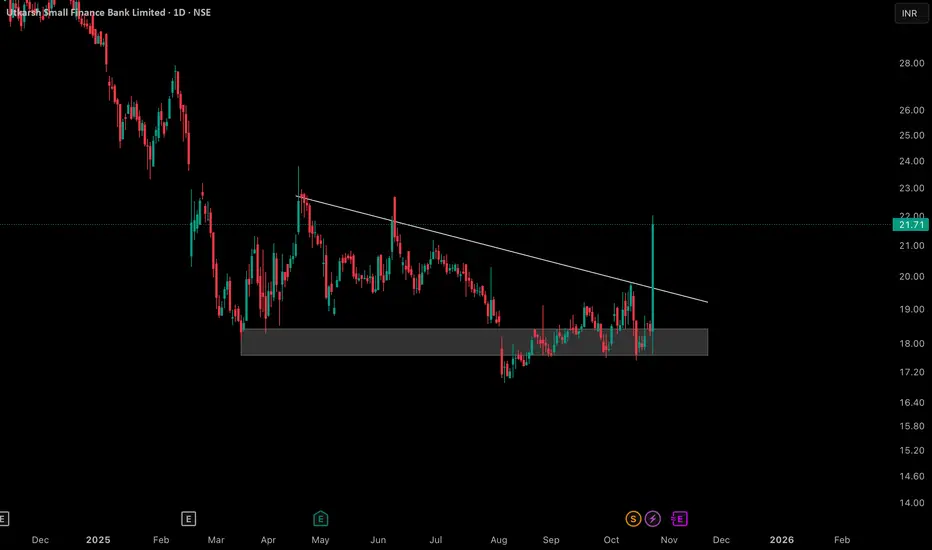
Descending Triangle fake breakdowns explainedThe daily chart for Utkarsh Small Finance Bank Limited displays a well-defined descending triangle, marked by a consistent supply trendline and an established horizontal support zone. During the recent price action, there was a temporary dip below the support, which was quickly retraced as price action returned within the range and formed a distinct lower wick rejection candle at the base.
This chart highlights the role of false moves and re-entries within important technical zones, as well as the reaction to a descending trendline. No trading advice or forecast is implied—this is for educational and analytical purposes, providing an example of how certain classical patterns and market behaviors may unfold within price structure.
ASCENDING TRIANGLE BREAKOUT IN RBL BANK-EDUCATIONAL PURPOSEBreakout seen on weekly chart after 5 years of consolidation
Long position can be initiated on little correction till 300 levels with the investment horizon of around 5 years
Target : 660 (121%)
Stoploss : Weekly closing below 242 (-21%)(recent swing low)
Risk Reward Ratio = 1:6
Investment horizon : 55-60 months (till October 2030)
Only for investment -- Not for short term trading

Tata Steel - Shorting - Going Against The Trend - Rising WedgeChances are to come down but only 60 - 65 % and can break the below trendline and move further below.

XAUUSD, Whats the Trend? If Pattern Breaks out?#Gold (#XAU/USD) Technical Analysis - October 24, 2025
Current Market Bias: **BEARISH**
Gold is currently trading at 4,109.12, positioned within a critical decision zone. The price action shows a developing #Descendingtriangle pattern with a clear resistance trendline connecting the recent highs around 4,150-4,200.
Key Observations:
The market has failed to break above the dynamic resistance multiple times, indicating weakening bullish momentum. Price is currently hovering near the 0.618 Fibonacci retracement level (4,153.81) but struggling to maintain above it. The horizontal support around 4,015 has been tested multiple times, forming the base of this triangle pattern.
#Breakout Scenarios:
📉 Bearish Breakdown (Higher Probability)
If the horizontal support at 4,015 breaks decisively:
- First Target: 3,918 (1.272 Fibonacci extension)
- Second Target: 3,865 (1.414 Fibonacci extension)
- Extended Target: 3,791 (1.618 Fibonacci extension)
- Major Support: 3,652 (2.0 Fibonacci extension)
This breakdown would represent a continuation of the corrective move from the all-time highs, potentially triggering significant selling pressure as stop-losses are triggered below 4,000.
📈 #Bullish Breakout (Alternative Scenario)
If price breaks above the descending resistance trendline AND reclaims 4,150-4,200:
- First Target: 4,250
- Extended Target: 4,300 (previous highs)
This would invalidate the bearish triangle pattern and could trigger a rally back toward recent highs.
#Risk Management
The pattern suggests a #risk-reward favoring short positions on breakdown confirmation. Traders should wait for a decisive close below 4,015 with increased volume before entering bearish positions. Stop-loss above 4,150 would be prudent for short positions.
Current stance: Monitor the 4,015 support closely - a break here opens the door to significant downside.

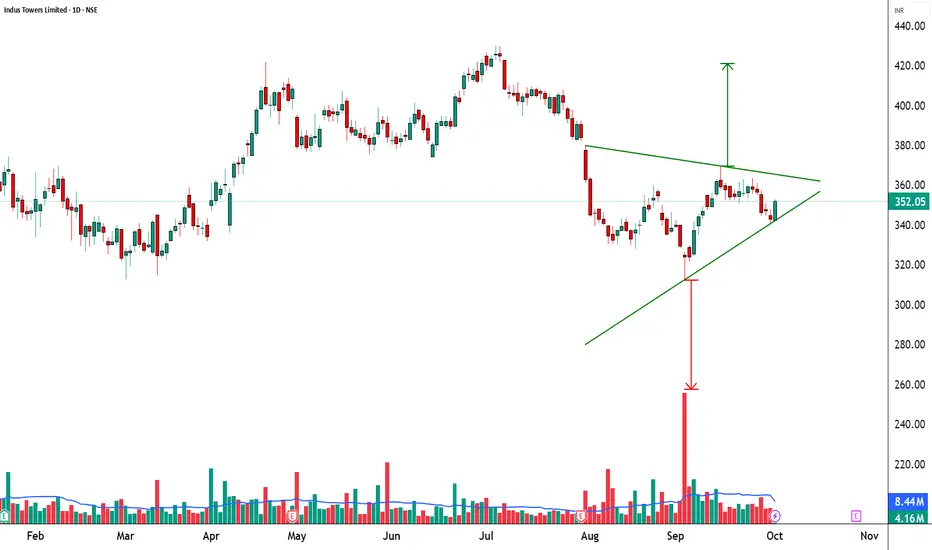
INDUSTOWER - Symmetrical Triangle Breakout Watch🚀 Indus Towers Ltd (NSE: INDUSTOWER) | Symmetrical Triangle Breakout Watch
________________________________________
🏢 Company Overview
Indus Towers Ltd is one of India’s largest telecom tower companies, providing critical passive infrastructure for the country’s telecom operators. The stock recently stabilized after a sharp fall and is now moving into a consolidation pattern that could signal the next big move.
________________________________________
📊 Current Market Snapshot
CMP: ₹352.05
Sector: Telecom Infrastructure
Pattern Observed: 🔺 Symmetrical Triangle
Candlestick Signal: Strong Bullish Candle on support
Strength Rating: ⭐⭐⭐ (Neutral → Bullish Watch)
________________________________________
📈 Price Action & Chart Pattern
The stock is trading inside a symmetrical triangle, formed by higher lows and lower highs. Today’s session shows a strong bounce from the support trendline, hinting at potential momentum buildup.
Support Trendline: ₹340 – ₹342
Resistance Trendline: ₹360 – ₹365
Breakout Zone: Above ₹360 with strong volume
Breakdown Zone: Below ₹340 may trigger fresh weakness
🔍 Why Important? Symmetrical triangles usually lead to explosive breakouts once price exits the structure with volume confirmation.
________________________________________
🔎 Technical Indicators
RSI (14): 50.35 → Neutral, ready for directional expansion.
EMA Support: Price reclaiming short-term EMAs, showing recovery signs.
Volume: Current rally backed by above-average volumes; a 1.5x spike would confirm strength.
The stock shows multiple bullish signals – Bullish Marubozu + Engulfing candle, strong buyer dominance with open = low, and alignment above VWAP suggesting institutional support. A BB squeeze indicates breakout potential, but traders should stay alert for a fake breakdown/liquidity sweep before the real move.
________________________________________
📍 Key Levels to Watch
Immediate Support: ₹340 – ₹342
Immediate Resistance: ₹360 – ₹365
Upside Target (if breakout): ₹390 – ₹400
Downside Target (if breakdown): ₹320 – ₹310
________________________________________
🔮 Bullish & Bearish Scenarios
✅ Bullish Case: A decisive close above ₹360 with heavy volume could trigger a sharp rally towards ₹390+.
⚠️ Bearish Case: Failure to cross ₹360 and a slip below ₹340 could drag the stock back to ₹320 or lower.
________________________________________
📝 STWP Trade Analysis
Entry: ₹352.05
Stop-loss: ₹340.45 (just below trendline)
Risk: 11.60 points
Strength: ⚡ Average but improving with momentum
Demand Zone: ₹350.85 – ₹340.90 | SL: 340.45
📌 Note: Risk-Reward is attractive if played with discipline & volume confirmation.
________________________________________
🎯 Final Outlook
Indus Towers is at a make-or-break stage. Traders should watch the ₹360 breakout level closely. A confirmed breakout can trigger a quick upward move, while failure may resume the prior downtrend. Patience and volume confirmation are key before committing to bigger trades.
________________________________________
💡 Learning Note: Symmetrical triangles often serve as launchpads for trend continuation. Combining price action + volume + risk management helps traders filter false signals and ride genuine breakouts effectively.
________________________________________
⚠️ Disclosure & Disclaimer – Please Read Carefully
The information shared here is meant purely for learning and awareness. It is not a buy or sell recommendation and should not be taken as investment advice. I am not a SEBI-registered investment adviser, and all views expressed are based on personal study, chart patterns, and publicly available market data.
Trading—whether in stocks or options—carries risk. Markets can move unexpectedly, and losses can sometimes exceed the money you have invested. Past performance or past setups do not guarantee future results.
If you are a beginner, treat this as a guide to understand how the market works and practice on paper trades before risking real money. If you are experienced, always assess your own risk, position sizing, and strategy suitability before entering trades.
Consult a SEBI-registered financial adviser before making any real trading decision. By engaging with this content, you acknowledge full responsibility for your trades and investments.
💬 Found this useful?
🔼 Give this post a Boost to help more traders discover clean, structured learning.
✍️ Drop your thoughts, questions, or setups in the comments — let’s grow together!
🔁 Share with fellow traders and beginners to spread awareness.
👉 “If you liked this breakdown, follow for more clean, structured setups with discipline at the core.”
🚀 Stay Calm. Stay Clean. Trade With Patience.
Trade Smart | Learn Zones | Be Self-Reliant 📊
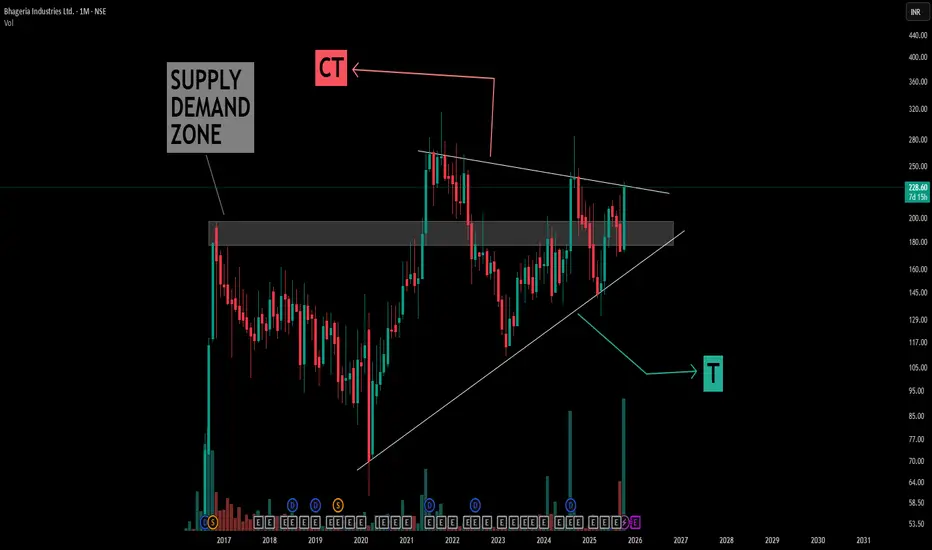
Understanding Symmetrical Triangle Patterns in depthThis chart illustrates a classic example of a symmetrical triangle pattern formed over several years, with simple compression trendline (CT) and trigger (T) lines drawn in white for clarity.
Key learning points from the structure:
- Symmetrical Triangle Formation: The pattern is defined by converging trendlines representing successive lower highs and higher lows, indicating a period of price consolidation and market indecision
- Supply Converts to Demand: The boxed area initially acted as supply, where price faced resistance repeatedly. Over time, after multiple interactions and a structural shift, this area began to act as demand, offering support to subsequent price movements. This showcases how prior resistance can evolve into a support zone as market dynamics shift.
- Pattern Context: A large symmetrical triangle is forming above this zone, highlighting sustained equilibrium between buyers and sellers, and price compressing within clearly defined boundaries.
- Educational Note: Patterns like these offer valuable case studies for understanding consolidation phases, the role of supply and demand flipping, and how market structure can evolve. They can be identified and studied without making directional assumptions, serving as an excellent foundation for technical analysis practice.
This post is aimed purely at technical education, emphasizing the process of chart marking, pattern recognition, and structural interpretation, without making market predictions or outcome forecasts.
Bharat Forge (BHARATFORG)Pattern: Symmetrical Triangle
Breakout Zone: Above ₹1,272
Structure: Higher-low formation inside triangle; RSI > 55, MACD crossover supportive
Volume: Expansion seen near breakout candle
Plan:
Buy Trigger: Close above ₹1,272
Stoploss: ATR-based (~₹1,230)
Targets: ₹1,380 → ₹1,450
View: Momentum-supported breakout; auto-ancillary sector showing rotation strength.

Supriya Lifescience Swing TradeDecent opportunity for a swing trade idea in Supriya Lifesciences.
Lets see how it goes.

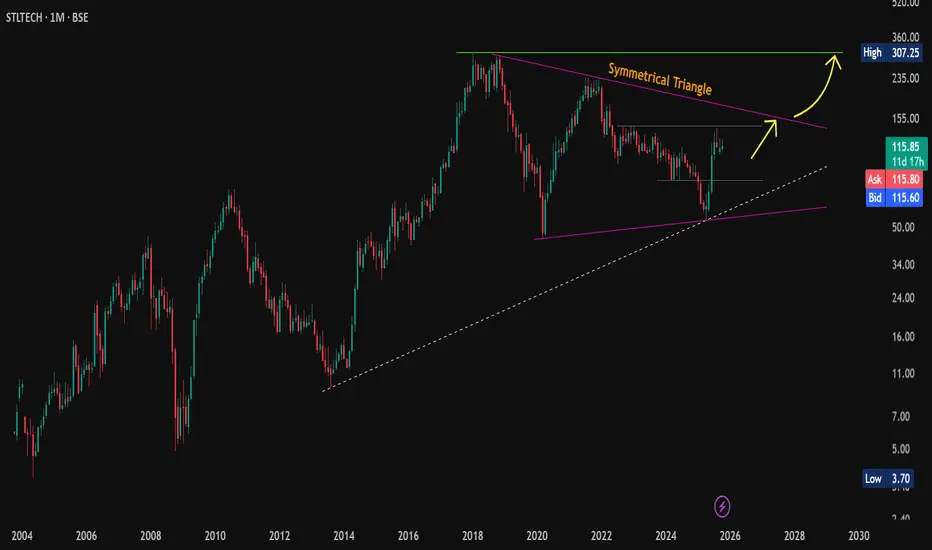
#STLTECH: Sleeping Giant in Fibre Space?✨ #MuhuratPick 🪔
CMP: 115.85
📐 Pattern: Symmetrical Triangle on Monthly Chart
🔼 Immediate Resistance: 143 (breakout zone)
🔽 Support Levels: 105 / 95 | Strong support: 82
❌ Pattern Invalidation: 61.80 (MCB)
🎯 Pattern Target:
Triangle height ≈ 251 points from trendline → Potential target = ATH 307+
🚀 Can Go Big in the Long-Term
#DiwaliPick | #STLTECH | #SterliteTech | #DataCentreTheme | #OpticalFibre | #ChartSetup | #LongTerm | #SymmetricalTriangle | #ChartPatterns | #TurnAroundPotential
📌 Disclaimer: This analysis is shared for educational purposes only. It is not a buy/sell recommendation. Please do your own research before making any trading decisions.
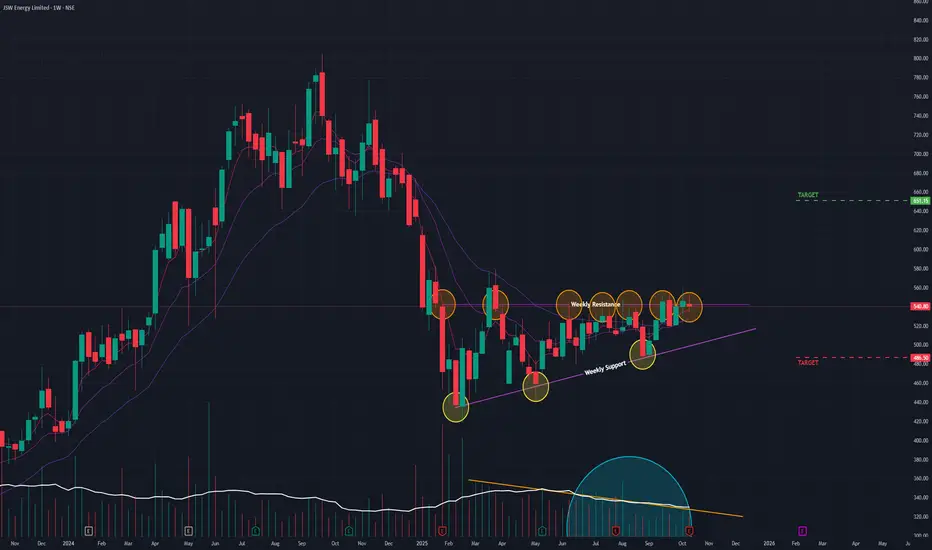
JSW Energy (W) - Coils in Bullish Triangle, Awaiting BreakoutAfter a prolonged downtrend from its September 2024 peak, JSW Energy is showing clear signs of a potential trend reversal, as it meticulously forms a classic bullish pattern. The stock is now approaching a critical decision point.
The Setup: An Ascending Triangle
Since February 2025, the stock has been forming a classic Ascending Triangle . This bullish pattern is characterized by:
- A series of Higher Lows , indicating that buyers are becoming more aggressive on each pullback.
- A flat horizontal resistance of Equal Highs , which has rejected several breakout attempts in recent weeks.
Crucially, as is typical for this type of consolidation pattern, trading volume has been noticeably drying up . This suggests that selling pressure is diminishing and energy is being stored for a potential significant move.
A Nuanced Technical Picture
The technical indicators suggest a trend that is in the process of turning bullish but has not yet received full confirmation across all timeframes:
- EMA: The short-term Exponential Moving Averages (EMAs) show a bullish crossover on the Weekly chart, but the longer-term Monthly chart is still awaiting this signal.
- RSI: The Monthly RSI is already rising (a positive long-term sign), but the Weekly RSI has yet to follow suit with a definitive upward trend.
This mix indicates that while medium-term strength is building, a decisive breakout is needed to align all timeframes and confirm a new, sustained uptrend.
Outlook and Key Triggers to Watch
The resolution of this triangle will likely dictate the stock's next major move.
- Bullish Breakout Scenario: A decisive close above the horizontal resistance on a surge of volume would confirm the breakout. This would signal the start of a new uptrend, with a potential next target of ₹650 .
- Bearish Scenario: If the stock loses momentum and fails to break out, it could fall back to test the rising support trendline of the triangle. The key support level to watch in this case is ₹485 .
The price action in the coming week will be critical. The focus should be on whether the bulls can finally generate the momentum needed to break through the overhead resistance and complete this bullish reversal pattern.
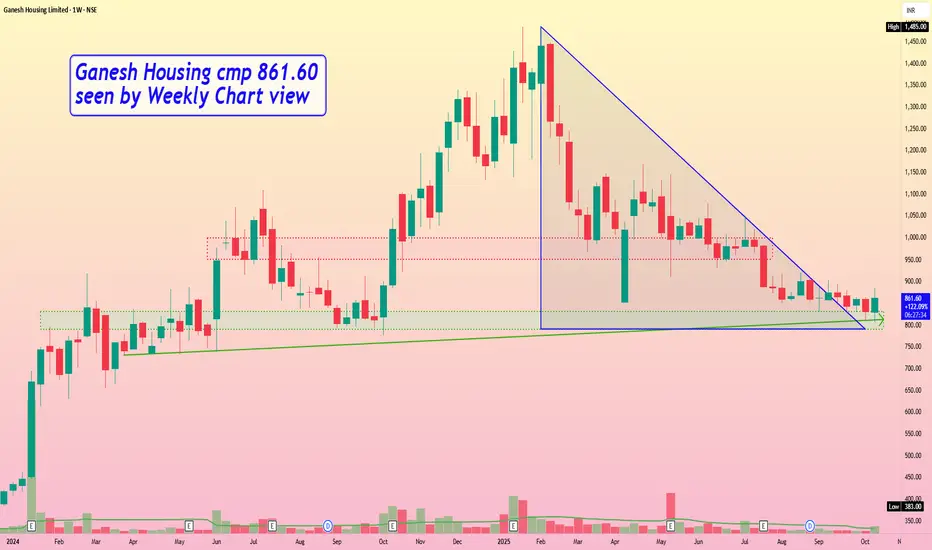
Ganesh Housing cmp 861.60 by Weekly Chart viewGanesh Housing cmp 861.60 by Weekly Chart view
- Support Zone 790 to 830 Price Band
- Resistance Zone 950 to 1000 Price Band
- Descending Triangle Breakout in the making process
- Support Zone seems tested retested over the past few weeks
- Volumes are flat, need to increase for fresh upside price movement
Persistent (D) - Surges 7% But Stalls at Key ResistancePersistent Systems showed significant bullish intent today with a powerful, high-volume surge. However, it was ultimately rejected at a key resistance trendline, placing the stock at a critical juncture where a breakout is being fiercely contested.
The Consolidation Pattern: A Triangle
Since reaching its All-Time High (ATH) in December 2024, the stock has been consolidating within a large Triangle Pattern . The upper boundary of this pattern is a descending (angular) resistance trendline that has successfully capped all rally attempts so far.
Today's session (Wednesday, October 15, 2025) was a clear attempt to break this pattern:
- The stock opened with a gap-up and surged by as much as 7.24% .
- The move was supported by huge trading volume .
- Despite this strength, the stock failed to break out and closed below the angular resistance, indicating that sellers are still actively defending this level.
Underlying Bullish Momentum
While the breakout was unsuccessful today, the underlying technical picture remains strong and suggests the bulls may try again. Key momentum indicators, including the short-term Exponential Moving Averages (EMAs) and the Relative Strength Index (RSI), are in a bullish state across the Monthly, Weekly, and Daily timeframes. This indicates that strong momentum is building up just below the point of resistance.
Outlook and Key Levels to Watch
The stock is currently in a "coiled spring" scenario, with building pressure meeting strong resistance.
- Bullish Breakout Trigger: A decisive close above the angular resistance trendline on high volume is needed to confirm a breakout. This would signal a continuation of the uptrend with a potential next target of ₹6,225 .
- Potential Rejection Scenario: If the stock is again rejected from this resistance and is unable to sustain its momentum, it could pull back to find support. The most immediate and significant support level to watch in this case would be ₹5,205 .
In conclusion, the battle at this key trendline is the most critical event to watch in the coming days. The outcome will likely determine the stock's next major directional move.

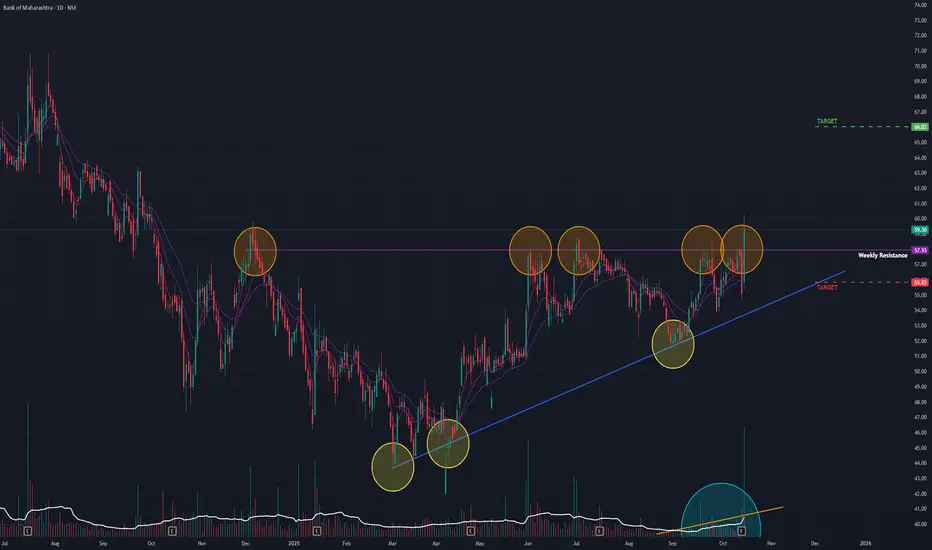
Bank of Maharashtra (D) - Breaks Out of Bullish Triangle PatternBank of Maharashtra has delivered a powerful bullish signal today, breaking out of a classic Ascending Triangle pattern on high volume. This decisive move suggests that its consolidation phase is over and a new uptrend is likely beginning.
The Setup: An Ascending Triangle
Following a prior downtrend, the stock meticulously formed an Ascending Triangle pattern. This is a classic bullish structure characterized by a series of Higher Lows consistently pushing up against a flat horizontal resistance level, which in this case, has been in place since December 2024. This pattern indicates a gradual build-up of buying pressure.
Today's Decisive Breakout
Today's session (Wednesday, October 15, 2025) confirmed the bullish outlook with authority:
- Strong Price Surge: The stock rallied by an impressive +7.60% .
- Confirmed Breakout: The price decisively broke out and, importantly, closed above the key horizontal resistance of the triangle.
- Huge Volume: The breakout occurred on huge trading volume , which provides strong confirmation and indicates significant buyer participation.
Adding to the conviction, as you noted, trading volume has been steadily increasing over the past few days, suggesting smart money was accumulating shares in anticipation of this move.
Underlying Technical Strength
The breakout is well-supported by key momentum indicators. The short-term Exponential Moving Averages (EMAs) and the Relative Strength Index (RSI) are both in a strong bullish state across the Monthly, Weekly, and Daily timeframes, indicating broad-based strength.
Outlook and Key Levels
With the bullish pattern now confirmed, the path of least resistance has shifted firmly upwards.
- Bullish Target: If the stock sustains this breakout momentum, the next logical area of resistance and potential price target is the ₹65 level.
- Bearish Target: If the stock fails the breakout momentum, it could pull back to the support level around ₹54
In conclusion, today's high-volume breakout from a classic bullish pattern is a very strong technical signal. The key now is for the price to remain above the ₹58 support level to validate the start of a new, sustained uptrend.
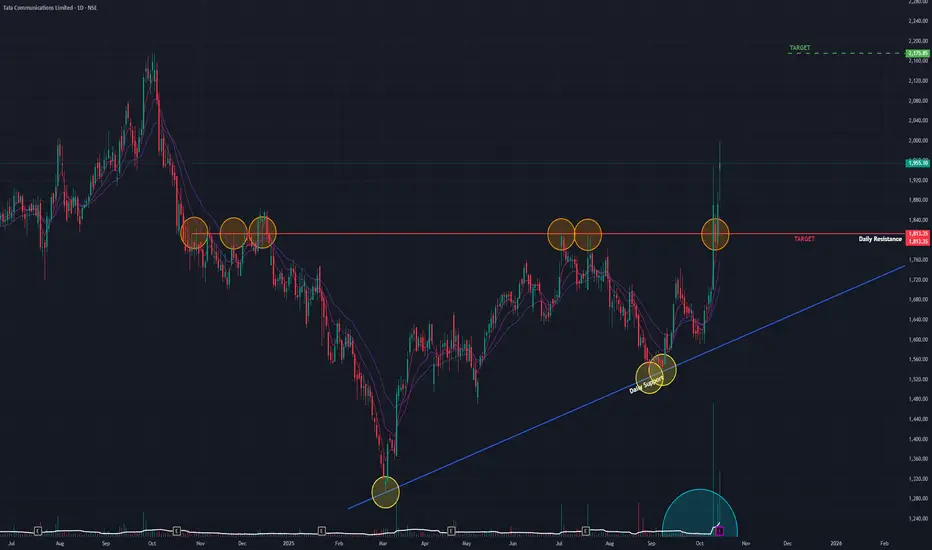
TATA Comm (D) - Breakout Confirmed, But Indecision Pauses RallyTata Communications has completed all the phases of a classic bullish breakout, but today's trading action suggests a brief pause or indecision before a potential new leg up. The overall technical posture remains strong as long as the stock holds above its newly established support.
The Setup: An Ascending Triangle
Following a brief downtrend from its September 2024 All-Time High, the stock began forming a solid base. This took the shape of a classic Ascending Triangle , characterized by a series of Higher Lows pushing up against a flat horizontal resistance of Equal Highs . This is a powerful bullish pattern that indicates building pressure.
Last week, the stock successfully broke out of this pattern. More importantly, during the current week, it performed a successful retest of the breakout level, with the old resistance now acting as new support—a strong sign of a valid breakout.
Today's Indecisive Action
Today's session (Wednesday, October 15, 2025) started with strong bullish intent:
- The stock opened with a gap-up on good volume.
- However, by the end of the day, it formed a neutral candle (like a Doji or Spinning Top).
This indicates that despite the initial buying pressure, neither bulls nor bears could gain control, resulting in a stalemate for the session. This suggests a momentary pause or indecision.
Underlying Technical Strength
Despite today's pause, the broader technical picture remains firmly bullish. Key momentum indicators, including the short-term Exponential Moving Averages (EMAs) and the Relative Strength Index (RSI), are in a bullish state across the Monthly, Weekly, and Daily timeframes.
Outlook and Key Levels
With a confirmed breakout and retest, the path of least resistance has shifted upwards.
- Bullish Target: If the bullish momentum resumes after this brief pause, the next logical area of resistance and potential target is the ₹2,175 level.
- Critical Support: The breakout point, around ₹1,813 , is now the most critical support level to watch. As long as the stock remains above this "line in the sand," the bullish outlook remains intact. A close below this level would negate the breakout.
In conclusion, while today's action signals a short-term pause, the overall technical evidence is bullish. The key is for the stock to hold the critical ₹1,813 support level before continuing its uptrend.
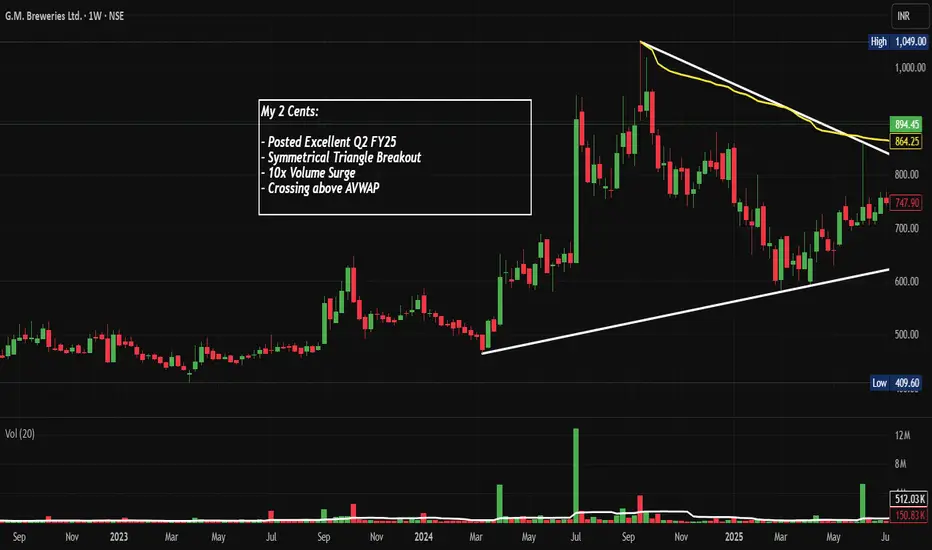
GMBREW: Broke Out Post Q2 FY26 with 10x Vol, Chart of the WeekA Small-Cap Brewery Stock NSE:GMBREW Broke Out With 10x Volume and Posted 61% Profit Growth in Q2 FY26. Let's Analyse in the "Chart of the Week"
As per the Latest SEBI Mandate, this isn't a Trading/Investment RECOMMENDATION nor for Educational Purposes; it is just for Informational purposes only. The chart data used is 3 Months old, as Showing Live Chart Data is not allowed according to the New SEBI Mandate.
Disclaimer: "I am not a SEBI REGISTERED RESEARCH ANALYST AND INVESTMENT ADVISER."
This analysis is intended solely for informational purposes and should not be interpreted as financial advice. It is advisable to consult a qualified financial advisor or conduct thorough research before making investment decisions.
Price Action Analysis:
Trend Structure:
- The stock has been trading in a well-defined ascending triangle pattern from March 2023 to September 2025
- Lower trendline support starts around 500 levels and has been holding consistently
- Upper resistance formed a symmetrical descending trendline from the August 2024 peak near 1,049
- The consolidation phase between 650-750 lasted approximately 12-14 months, indicating strong accumulation
Recent Breakout Dynamics:
- On October 9, 2025, the stock witnessed a powerful breakout above the descending resistance trendline
- The breakout candle closed at 894.45, representing a gain of 22% in a Week
- Price crossed above the Volume Weighted Average Price (VWAP) with conviction
- The breakout occurred exactly at the apex of the symmetrical triangle, a textbook technical setup
Base Formation:
- A solid base was formed between 650-750 levels from June 2024 to September 2025
- This 15-month consolidation created a strong platform for the next leg up
- The base shows higher lows, indicating persistent buying interest
- Multiple tests of the 700 level without breaking down confirmed strong institutional support
Volume Spread Analysis:
Volume Surge Characteristics:
- The breakout day witnessed volume of 11.88 million shares, representing approximately 10x the average Weekly volume
- Prior peak volume was recorded in July 2024 at around 11 million shares during a similar rally
- The volume spike confirms genuine institutional participation rather than retail speculation
- Volume during the consolidation phase remained subdued, typical of healthy base-building
Volume-Price Correlation:
- The recent volume expansion coincided with the Q2 FY25 earnings announcement
- Volume preceded the price breakout, suggesting informed accumulation
- Absence of distribution volume during the decline from 1,049 to 650 indicates strong hands holding positions
Support and Resistance Levels:
Key Support Zones:
- Immediate support: 850-860 (breakout point and previous resistance turned support)
- Secondary support: 780-800 (VWAP zone)
- Major support: 700-720 (top of the consolidation base)
- Critical support: 650 (lower boundary of the triangle pattern)
Key Resistance Levels:
- Immediate resistance: 900-920 (psychological level and minor supply zone)
- Major resistance: 1,000-1,049 (previous 52-week high from August 2024)
- Extended resistance: 1,150-1,200 (measured move from triangle breakout)
- Long-term resistance: 1,300-1,350 (Fibonacci extension based on prior rally)
Technical Pattern Recognition:
Symmetrical Triangle Breakout:
- The pattern took 18 months to form, indicating a significant accumulation phase
- Pattern reliability is high, given the strong volume confirmation
- The apex breakout timing increases the probability of follow-through momentum
Volume Price Analysis (VPA):
- The breakout exhibits classic VPA characteristics: rising prices on expanding volume
- No signs of climactic selling during the base formation
- Professional money accumulation is evident from the volume footprint
- Current setup suggests continuation rather than exhaustion
Sectoral Backdrop and Industry Analysis:
Indian Alcohol Sector Overview:
- The Indian alcohol market is estimated at USD 60.11 billion in 2025 and expected to reach USD 101.10 billion by 2032, exhibiting a CAGR of 7.7%
- India's growing middle class is becoming more affluent, driving increased alcohol consumption as disposable incomes rise
- India's total alcoholic beverage sector is the world's third largest, with yearly sales of $44 billion
- In India, beverage alcohol volumes rose 4% in the first half of 2024, driven by strong demand for premium-plus spirits
Growth Drivers:
- Premiumization trend as consumers upgrade to higher-quality spirits and beer
- Expanding retail distribution channels, including modern trade and e-commerce
- Rising disposable incomes and urbanization are creating a larger addressable market
- Changing social attitudes toward moderate alcohol consumption, especially among younger demographics
- Tourism and hospitality sector recovery post-pandemic, boosting on-premise consumption
Sector Risks and Challenges:
- Heavy regulatory environment with varying state-level policies on alcohol sales
- High taxation is impacting margins and affordability
- Licensing complexities and distribution restrictions in certain states
- Raw material price volatility affecting input costs
- Social stigma and health concerns are potentially limiting market expansion
Fundamental Analysis:
Recent Financial Performance:
- In Q2 FY26, net profit rose 61% year-on-year, with revenue growing 20% to ₹718 crore, while EBITDA margin expanded to 6.25% from 4.62%
- For H1 FY26, total revenue reached ₹1,356 crore, marking 13% growth, with net profit rising 30% to ₹61 crore
- Margins saw healthy growth at 24.9% compared to 18.9% last year
- The strong Q2 results were the primary catalyst for the recent breakout
Company Fundamentals:
- Market capitalization stands at approximately 2,042 crore with annual revenue of 679 crore and profit of 143 crore
- Promoter holding is strong at 74.4%, indicating management confidence
- The company has delivered moderate sales growth of 6.32% over the past five years
- GM Breweries operates with no debt and demonstrates good profit growth
Valuation Metrics:
- As of October 9, 2025, GM Breweries is trading at a discount of 16% based on median intrinsic value estimates
- The stock trades in the small-cap segment with relatively lower liquidity compared to large-cap peers
- Recent earnings surprise has likely re-rated the stock, but valuation remains reasonable relative to growth
- P/E multiple expansion likely as margins improve and profitability accelerates
Competitive Positioning:
- Compared to industry leaders, GM Breweries lacks strong brand value and has limited market coverage
- The company operates primarily in select states, providing regional focus but limiting nationwide presence
- Opportunity exists to expand distribution footprint and invest in brand building
- Focus on operational efficiency and margin expansion differentiates from competitors
Bull Case Arguments:
- Strong earnings momentum with 61% profit growth, indicating operational leverage
- Technical breakout from 18-month base supported by exceptional volume confirms institutional interest
- Favourable industry tailwinds with 7.7% sector CAGR supporting long-term growth
- Debt-free balance sheet provides financial flexibility for expansion
- High promoter holding at 74.4% aligns management interests with shareholders
- Current valuation at 16% discount to intrinsic value offers a margin of safety
Bear Case Considerations:
- Limited brand recognition compared to established industry players
- Restricted geographic presence limits growth potential
- Heavy regulatory oversight and taxation pose ongoing challenges
- Small-cap liquidity concerns may lead to higher volatility
- Dependence on discretionary consumer spending makes business cyclical
- Historical revenue growth of 6.32% over five years is modest
Monitoring and Review Parameters:
Key Metrics to Track:
- Quarterly revenue and profit growth rates versus expectations
- Margin expansion, sustainability and operating leverage
- Volume growth in key markets and product categories
- Market share gains or losses relative to competitors
- Any changes in promoter holding or institutional ownership patterns
Technical Review Points:
- Weekly closing price relative to the breakout level of 850
- Volume sustainability above 3-4 million shares daily average
- Formation of higher highs and higher lows to confirm an uptrend
- Any breakdown below 780 would invalidate the bullish thesis
- RSI and momentum indicators for early signs of exhaustion
Risk Triggers:
- Fundamental: Any quarterly earnings miss or margin compression
- Technical: Weekly close below 780 or breach of major support zones
- Sectoral: Adverse regulatory changes or significant tax increases
- Market: Broader market correction below key support levels affecting risk appetite
- Time-based: If the stock underperforms the sector or broader market for two consecutive quarters
Full Coverage on my Newsletter this Week
Keep in the Watchlist and DOYR.
NO RECO. For Buy/Sell.
📌Thank you for exploring my idea! I hope you found it valuable.
🙏FOLLOW for more
👍BOOST if you found it useful.
✍️COMMENT below with your views.
Meanwhile, check out my other stock ideas on the right side until this trade is activated. I would love your feedback.
As per the Latest SEBI Mandate, this isn't a Trading/Investment RECOMMENDATION nor for Educational Purposes; it is just for Informational purposes only. The chart data used is 3 Months old, as Showing Live Chart Data is not allowed according to the New SEBI Mandate.
Disclaimer: "I am not a SEBI REGISTERED RESEARCH ANALYST AND INVESTMENT ADVISER."
This analysis is intended solely for informational purposes and should not be interpreted as financial advice. It is advisable to consult a qualified financial advisor or conduct thorough research before making investment decisions.
GNFC - BreakoutGNFC - Looks like bottom at strong support.
Once above the trendline and give breakout, we will see big rally on upside.
Keep buying and hold for the long term.
Targets are 540-600-650-700++++

Don’t Miss This Rare MCX Setup Breakout + Retest= Big Move AheadHello Traders!
Today’s analysis is on MCX Ltd., where we just spotted a powerful Descending Triangle Breakout . After weeks of consolidation, the price has finally broken the falling resistance and even retested the breakout zone. This setup often leads to a strong trending move.
Why this setup is special?
Price respected support multiple times, showing heavy demand from lower levels.
Breakout + Retest makes it one of the most reliable continuation patterns.
Risk–Reward is highly favorable for both short-term and positional traders.
Levels to Track:
Currently, the best accumulation zone lies between 8000–8155 , which gives a low-risk entry point. On the upside, the immediate short-term target is around 8446 , while the medium-term level aligns with the previous ATH near 9115 . If momentum sustains, the stock even has potential to reach the positional target of 9774 . For risk management, traders can keep a short to medium-term stop loss at 7788 , while positional traders may consider a wider SL at 7522 .
Rahul’s Tip:
Such breakouts don’t come often. Once the retest is done, the real rally usually begins. Traders who wait too long often end up chasing the move at much higher prices.
If you want to catch these setups before they take off, make sure you follow closely — (Analysis By @TraderRahulPal, TradingView Moderator). More analysis & educational content is shared regularly on my profile. Sometimes one breakout can change your trading month completely. If this helped you, don’t forget to like and follow for regular updates.
Disclaimer:
This analysis is for educational purposes only and should not be taken as financial advice. Please do your own research or consult your financial advisor before investing.
