Adaniports - Breaking the resistancePrice is taking the trend line support and moving up. Now it is testing the resistance at the 1380 zone. Sustaining above this is important, as the daily chart shows resistance at 1380.
Buy above 1380 with the stop loss of 1364 for the targets 1394, 1410, 1426, and 1448.
Always do your analysis before taking any trade.
Triangle

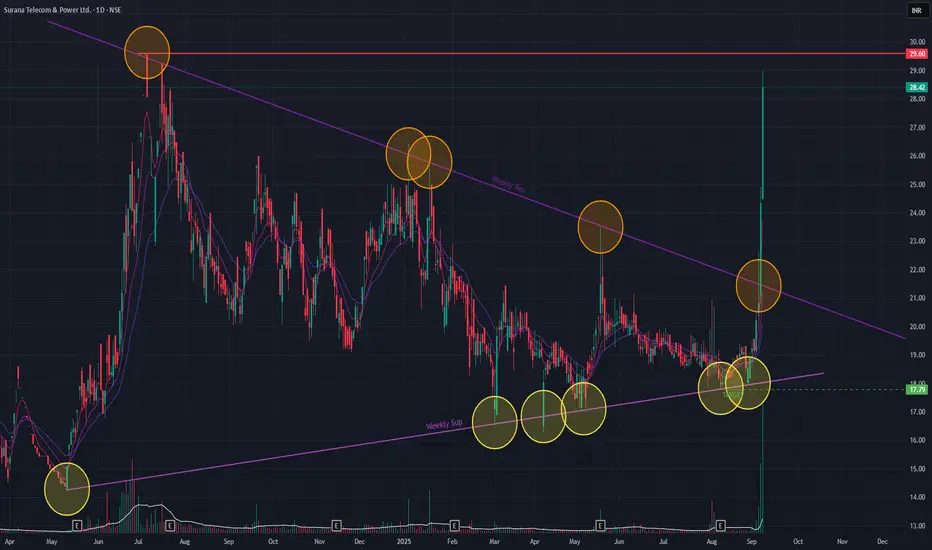
Surana T&P (Daily Timeframe) - Will it make new ATH?Surana has formed a Triangle formation which it Broke-Out last week confirming a bullish momentum. Short-term EMAs are in a PCO state. Today the stock opened Gap-up and formed a strong bullish candle (16.86%) with huge volume. A Golden Cross-over in both EMAs and DMAs may form in the coming days, which is a bullish signal, confirming the momentum.
On upside the stock may reach 37 levels if the momentum continues. If the stock is unable to sustain momentum, then we may see the levels of 17 on the downside.
Price-action is what we need to keep monitoring!!
BSE Ltd Cmp 2320 Triangle BOBSE Ltd Cmp 2320 dated 5-9-2025
1. Bullish Candle
2. RSI rise
3. Triangle BO @ 2350
Buy above 2325 SL 2220 target 2350-2360-2375-
2400-2420-2450-2475-2500-2525-2550
It is just a view please trade at your own risk.

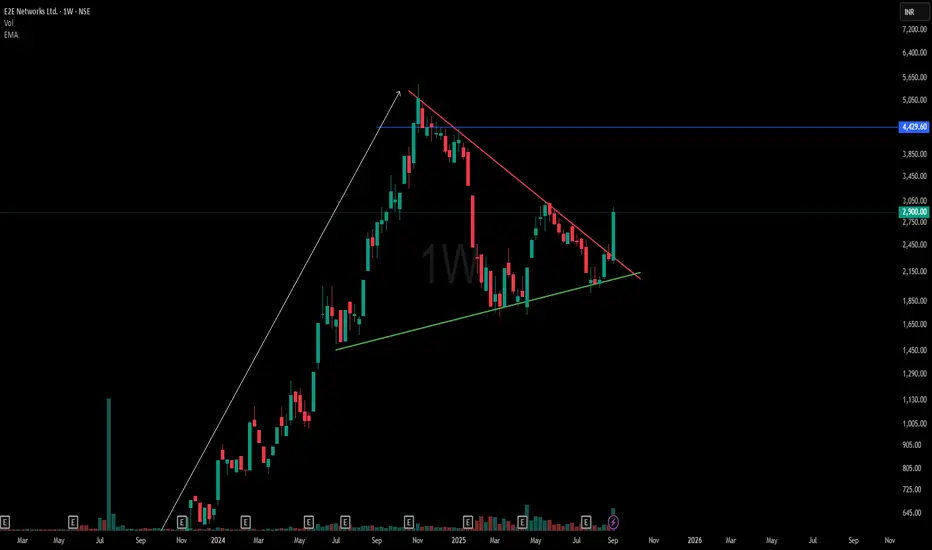
Perfect Symmetrical Triangle Chart Pattern💡 Chart Pattern Education
Symmetrical triangles are powerful continuation patterns that form when buyers and sellers reach equilibrium. The converging trendlines create a coiling effect, building pressure for the next major directional move. Studies show 68-75% success rate when traded with proper volume confirmation.
⚡ Matching the Chart shown and the above definition
✅ Higher lows trend intact on support trendline
✅ Lower highs forming clean resistance line
✅ Consolidation phase showing market indecision
✅ Volume declining as expected in triangle patterns
✅ Multiple timeframe confirmation visible
Disclaimer:
This analysis is for educational and informational purposes only and does not constitute financial advice or a recommendation to buy or sell any security. Trading involves risk, and past performance is not indicative of future results. Traders should conduct their own due diligence and consider their risk tolerance before making any trading decisions
Viviana Power Tech – Where Fundamentals Fuel the Breakout?Viviana Power Tech Ltd, based in Gujarat, operates in the power transmission and distribution EPC space, offering services like EHV substations, underground cabling, and testing/commissioning. The company has shown rapid expansion in revenue and profitability, riding on India’s growing power infrastructure demand.
Fundamental Analysis
Financial Performance
Revenue Growth: From ₹66 crore (FY24) to ~₹235 crore TTM, reflecting a 250%+ YoY growth.
Net Profit: Jumped from ₹7 crore (FY24) to ~₹22 crore TTM.
EPS (TTM): ~₹28–35 depending on consolidation basis.
Key Ratios
P/E Ratio: ~34–36× (slightly expensive compared to sector peers).
P/B Ratio: ~12.5× (stretched valuations).
ROE / ROCE: Strong at ~28–31%, respectively.
Debt-to-Equity: Moderate at ~0.48.
Promoter Holding: ~70.3% (indicating strong skin in the game).
Outlook
Strengths: Explosive revenue and profit growth, high return ratios, strong order book visibility.
Risks: Expensive valuations, thin dividend track record, seasonal volatility in September.
Technical Analysis
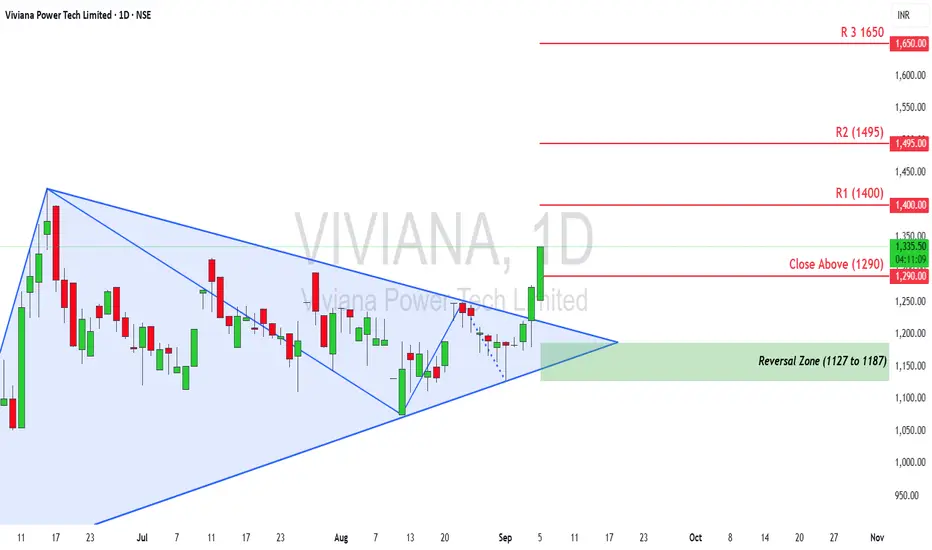
Pattern Formation:
The stock has been consolidating inside a symmetrical triangle since June, and has now given a breakout with strong bullish candles.
Key Levels:
Close Above Zone: ₹1,290 – A decisive breakout level.
Immediate Resistances:
R1: ₹1,400
R2: ₹1,495
R3: ₹1,650
Support/Reversal Zone: ₹1,127 – ₹1,187
Momentum: The breakout with a ~4.7% surge on above-average volumes suggests the beginning of a fresh upward trend.
Trend Outlook:
If the stock sustains above ₹1,290, momentum traders can eye ₹1,400–₹1,495 in the near term, with ₹1,650 as a medium-term target. A fall below ₹1,187 may invalidate the bullish view.
Techno-Fundamental Verdict
Viviana Power Tech stands out as a high-growth mid-cap in the power EPC sector with strong fundamentals, backed by robust ROE and revenue expansion. The recent technical breakout from consolidation adds a bullish confirmation, suggesting renewed investor interest.
For Investors: Attractive for long-term growth seekers, but valuation is expensive—advisable to accumulate on dips near support zones.
For Traders: Sustaining above ₹1,290 opens the door for a rally toward ₹1,400–₹1,495 in the short term. Stop-loss should be placed below ₹1,180 for risk management.
Conclusion:
Viviana is a growth-driven, high-potential, but richly valued stock. Fundamentals indicate strength, and the technical chart signals bullish continuation. A balanced approach—combining staggered investment with tactical trading entries—may offer the best risk-reward.
Disclaimer: lnkd.in
Breaking Out of Falling Wedge and Symmetrical TriangleNSE:SYRMA is breaking out of Falling Wedge and Symmetrical Triangle Breakout on Weekly TF. With 2nd Best Weekly Volumes.
NSE:SYRMA is a Chennai-based engineering and design company engaged in electronics manufacturing services (EMS). The company provides integrated services and solutions to original equipment manufacturers (OEMs) from the initial product concept stage to volume production through concept co-creation and product realization.
Recently it posted good Q2 FY 24-25 Results, posting a 30% Y/Y rise in Q2 consol profit after tax. The auto and healthcare businesses led growth in Q2 and will drive future growth further ahead. Also, expect a recovery in margins fuelled by higher exports and design and manufacturing businesses. NSE:SYRMA faces margin challenges as the consumer segment, which comprises 35%—38% of topline, operates with lower margins, and they are aiming to lower the segment's share further.
One can wait for a retracement or ride the momentum with the current week candle as stop loss.
🙋♀️🙋♂️If you have any questions about this stock, feel free to reach out to me.
📌Thank you for exploring my idea! I hope you found it valuable.
🙏FLLOW for more
👍BOOST if useful
✍️COMMENT Below your views.
Meanwhile, check out my other stock ideas below until this trade is activated. I would love your feedback.
Disclaimer: This analysis is intended solely for informational and educational purposes and should not be interpreted as financial advice. It is advisable to consult a qualified financial advisor or conduct thorough research before making investment decisions.

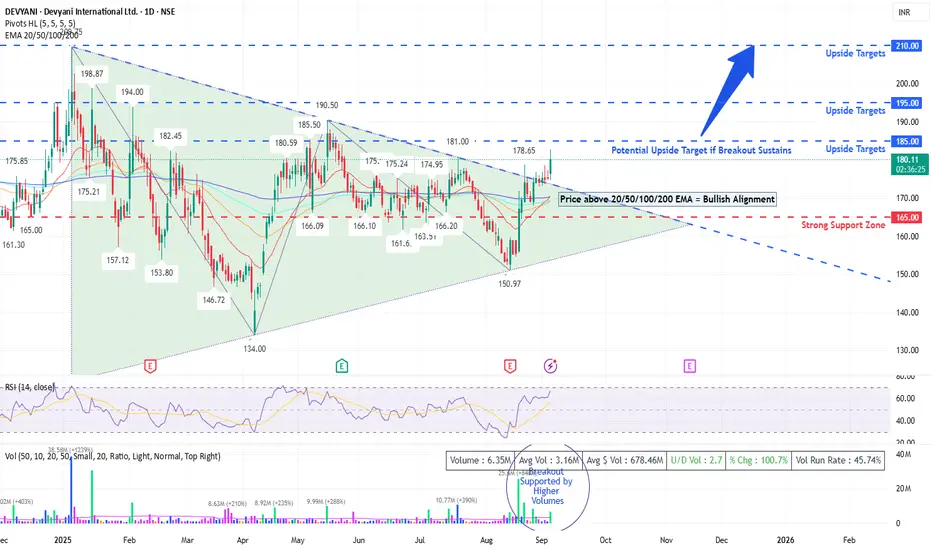
DEVYANI - TRINGLE BREAKOUTDevyani Intl – Triangle Breakout Loading? 🚀
📊 Stock Analysis: Devyani International Ltd (NSE: DEYANI)
🔹 Technical Overview
Pattern: Symmetrical Triangle breakout attempt visible on daily charts. Price has tested the upper resistance trendline multiple times (₹190–₹195 zone) and is now trading above short-term EMAs.
Key Support Levels : ₹165, ₹150
Immediate Resistance Levels: ₹185, ₹195 (major breakout zone)
Indicators:
RSI (14): 66.5 → Positive momentum, but near overbought levels.
EMA Cluster (20/50/100/200): Price trading above all key EMAs – strong short-term bullish signal.
Volume: Breakout supported with above-average volumes (5.3M vs 3.1M avg).
➡️ A sustained close above ₹185–₹190 could trigger a rally towards ₹200–₹210.
🔹 Fundamental Snapshot
Business Model: Devyani International Ltd is the largest franchisee of Yum! Brands in India, operating KFC, Pizza Hut, and Costa Coffee.
Growth Drivers:
Rapid store expansions (targeting Tier II/III cities).
Rising QSR demand in India with improving urban disposable income.
Long-term industry tailwinds in organized food retail.
Risks:
Margin pressures due to inflation in raw materials.
Intense competition in QSR space (Domino’s, McDonald’s, Burger King).
High dependence on discretionary consumer spending.
🔹 Trading Strategy
Short-Term (1–3 weeks): Buy on dips near ₹170–₹175, SL below ₹165. Target: ₹190 / ₹200.
Medium-Term (2–3 months): If breakout above ₹195 holds with volume, positional target can be ₹220+.
Risk Management: Keep SL below triangle support (₹160) for positional trades.
🔹 Sentiment & Outlook
📈 With improving consumer demand and strong expansion plans, Devyani remains a long-term growth story in India’s QSR sector. Current technical setup indicates a potential breakout rally if momentum sustains above ₹185–₹190.
⚡ Conclusion:
👉 Stock is at a make-or-break zone. Sustained move above ₹190 could unlock fresh highs, while failure may keep it in consolidation within the triangle.
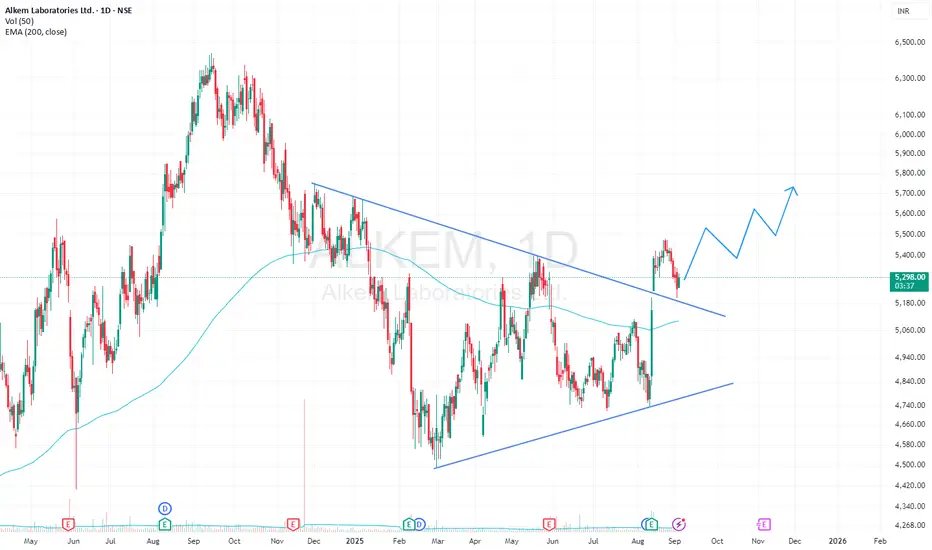
ALKEM Triangle BreakOutAlkem labs has given a breakout from Triangle pattern on 1D timeframe with high volumes. It is apparently retesting the resistance trendline. The stock is also trading above its 200 EMA.
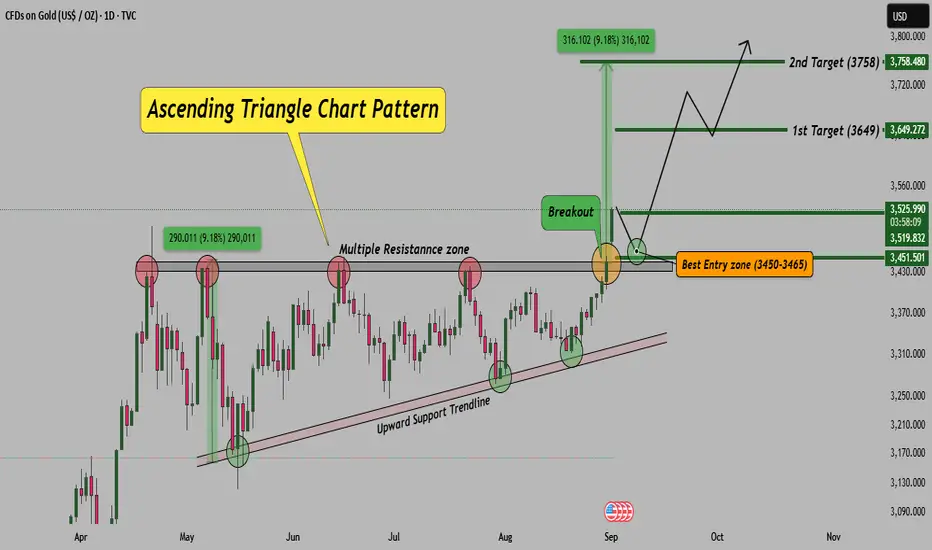
Gold Daily Chart – Ascending Triangle Breakout!Gold has formed a strong ascending triangle pattern on the daily timeframe. The price has successfully broken above the resistance zone, confirming bullish momentum. Such patterns generally indicate continuation of the uptrend, especially when supported by volume and strong price action.
Chart Observation:
As long as price holds above 3,450, the bullish setup remains valid.
A retest of the breakout zone can provide the best risk-to-reward entry opportunity.
Traders should keep an eye on volume confirmation while entering trades.
Note: If levels sustain and setup remains intact, I will share live trade updates in real time. Stay tuned.
Disclaimer: This analysis is for educational purposes only. Please do your own research or consult your financial advisor before taking trades.
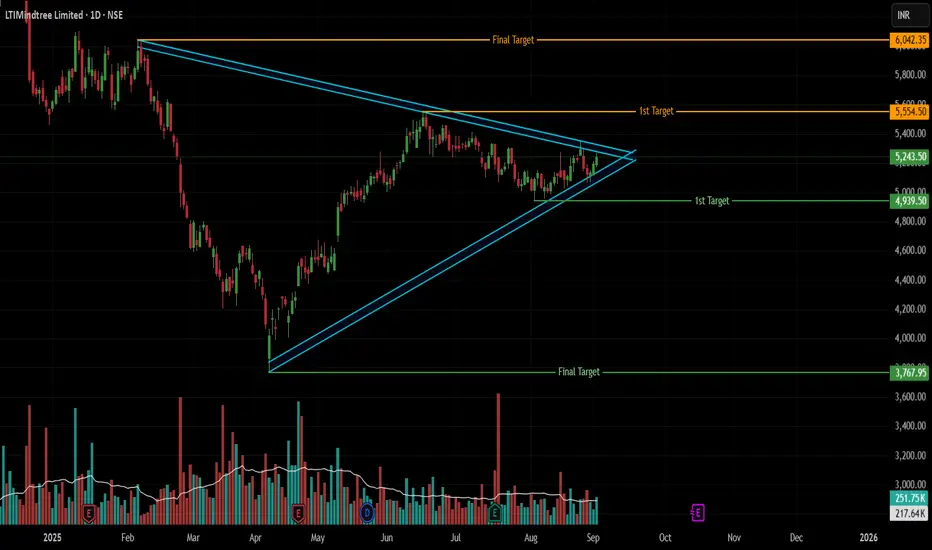
LTIM: The Final Squeeze – Breakout or Breakdown?LTIMINDTREE: The Big Squeeze! ⚡ Which Way? 🐂🐻
Timeframe: Daily
Trade Type: Swing/Positional
Pure Price Action Setup: LTIMINDTREE is compressing into a textbook Symmetrical Triangle on the daily chart. This is a classic consolidation pattern where the market is building energy for a significant breakout. Volatility is collapsing into a tight apex!
Key Decision Levels:
Bullish Trigger: A decisive daily close above 5350 (the recent upper trendline resistance).
Bearish Trigger: A decisive daily close below 5067 (the rising lower trendline support).
The Trade Plan:
👉 BULLISH BREAKOUT Scenario 🐂
Entry: On a close above 5350.
Confirmation: A significant increase in volume on the breakout candle should confirm buyer commitment.
Target 1: 5554 (Previous major high)
Final Target: 6042 (All-Time High & Pattern Confluence)
SL: Below the breakout candle or the lower trendline.
👉 BEARISH BREAKDOWN Scenario 🐻
Entry: On a close below 5067.
Confirmation: A noticeable spike in volume on the breakdown would validate seller dominance.
Target 1: 4939 (Initial support zone)
Final Target: 3767 (Major Swing Low & Pattern Confluence)
SL: Above the breakdown candle or the upper trendline.
Pattern Depth & Significance:
The triangle's maximum depth is measured from its origin: the high of 6042 (Feb 5) to the low of 3767 (Apr 7).
This is a 2,275-point range.
In percentage terms, that's a ~60.3% move from high to low.
Why this matters: The energy stored in a pattern of this scale suggests the resulting breakout could be powerful and sustained. Always trail your stop loss after Target 1 is hit! 🔒
Risk Management is NON-NEGOTIABLE!
This is a high-risk, high-reward setup. Your stop loss is your best friend.
📜 Disclaimer: This is an educational example of technical analysis and NOT financial advice. Trading carries a high level of risk. You should consider whether you can afford to take the risk of loss. Perform your own research before making any trade decisions.
Like & Boost if this clear analysis helps you! ✅
Follow for more pure price action trade ideas! 😊
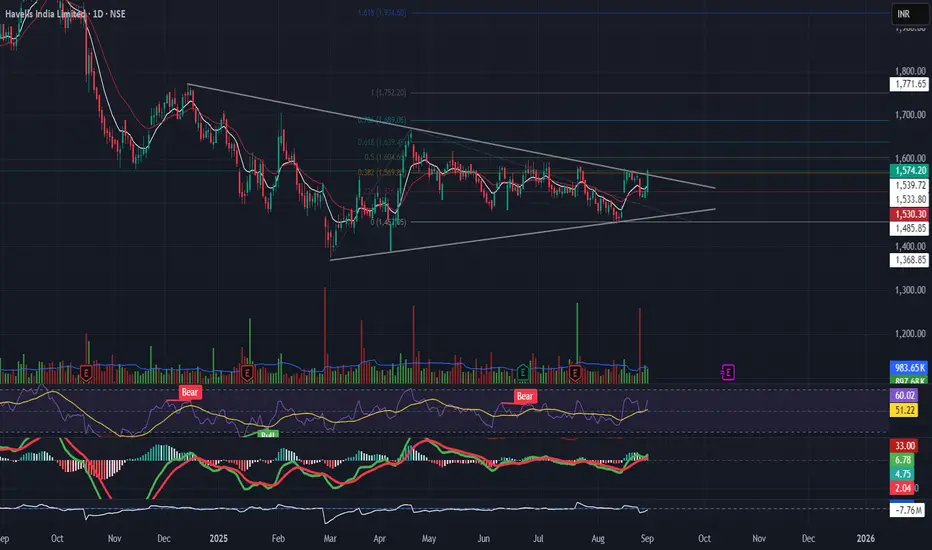
Havells breakout from symmetrical triangle patternHavells had Breakout from symmetrical triangle at the ₹1,570 descending resistance. RSI near 60, MACD recovering and moving up. Watch for volume-backed breakout.
Breakout above can fuel a move to ₹1,690–₹1,750.
Stop near ₹1,485.
🔌 Electrical sector needs confirmation for momentum entry."
GOOG📊 NASDAQ:GOOG Weekly Chart | CMP: $180
🔺 Triangle breakout still pending
🕵️♂️ Watching closely near key levels
📈 Range:
▪️High: $206.56 (Feb 2025)
▪️Low: $140.36 (Apr 2025)
📉 Stop Loss: $150
🎯 Target: $300 in 12–18 months
Breakout confirmation could open strong upside potential.
#GOOG #Alphabet #Stocks #TechnicalAnalysis #Investing

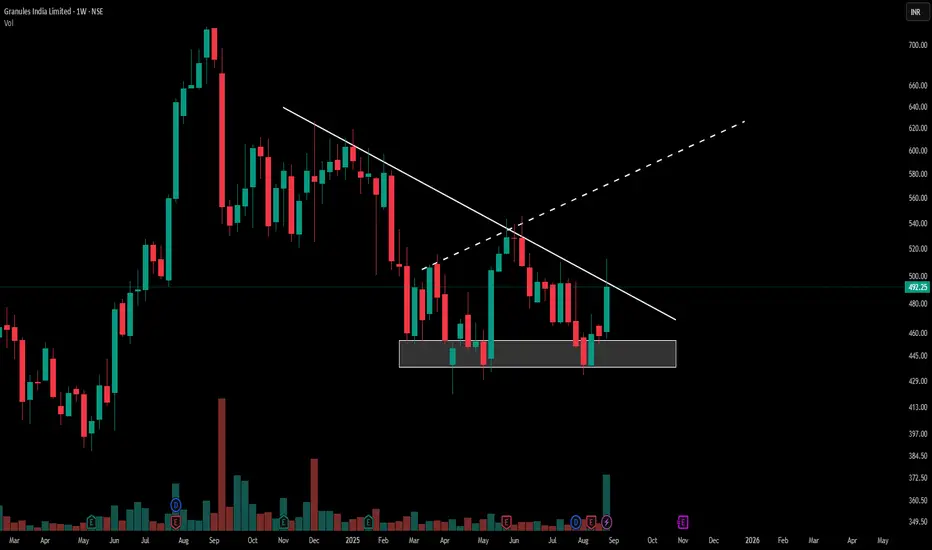
Granules India: Critical Descending TriangleGranules India Limited presents a descending triangle pattern on the weekly chart. The price has moved from the established support zone near ₹440-450 and is currently challenging the resistance trendline around ₹492.25. This movement appears with a marked increase in trading volume, highlighting the level where buyers and sellers are most active.
Pattern Character
A descending triangle pattern is identified by a series of lower highs against a stable support base. Granules India’s recent action displays persistence at support and upward momentum toward resistance. The volume expansion indicates notable participation during the current move.
Chart Observation
Price action above the triangle’s resistance can indicate a change in the prevailing sentiment if confirmed by continued volume. The current structure and market activity are being closely watched by participants for further development. No forecast or recommendation is made within this post.
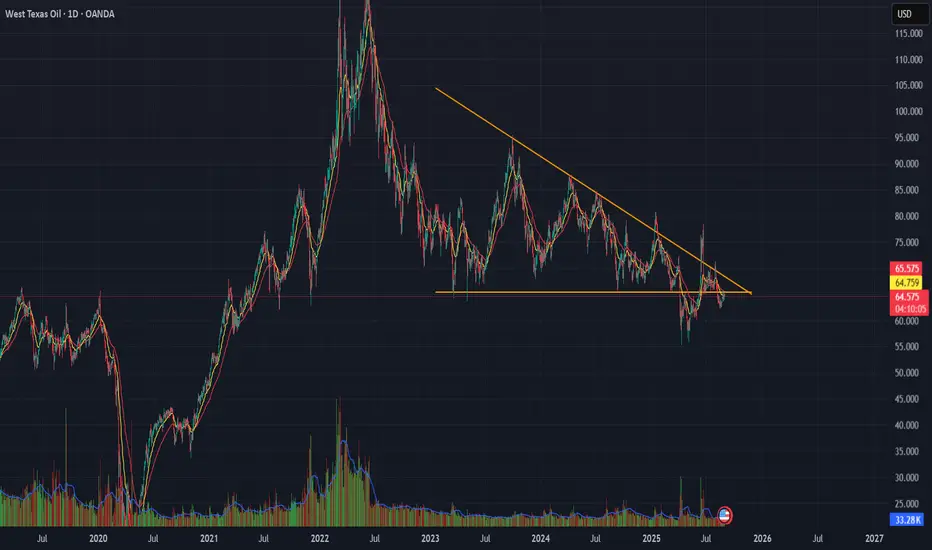
WTI Crude Oil Descending Triangle Pattern
WTI is forming a Descending Triangle pattern near recent support.
📊 Technicals : Flat base with lower highs compressing price action.
🔎 Key Levels: Breakdown below support 65 Leads To bearish continuation;
bounce above resistance 71 Leads To reversal setup.
⚠ Risk View: Energy fundamentals remain mixed — confirmation with volume is essential.
👉 Tactical takeaway: Wait for a breakout from the triangle before committing directionally.
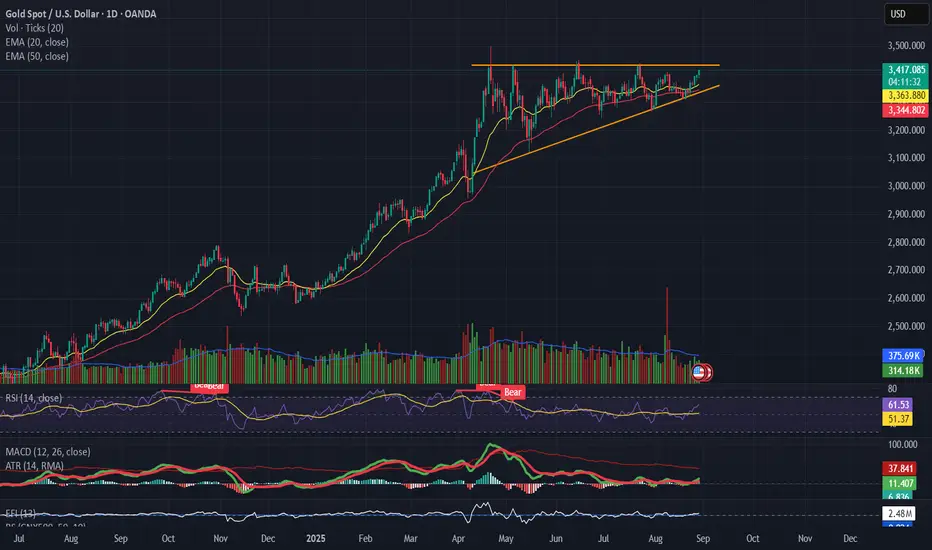
GOLD(XAUUSD) Forming a pennant / ascending triangle 📌 Gold (XAUUSD)
Forming a pennant / ascending triangle with strong resistance near $3,390 – 3,400.
Volume is declining, suggesting indecision.
RSI holding above 50 but not powering higher → momentum is slowing.
MACD flatlining, no fresh bullish impulse yet.
👉 Breakout above $3,400 needed for continuation. Breakdown below $3,340 risks correction.
DLFThe price fall for the first 30 minutes and then it was consolidating in a narrow range, forming a descending triangle. As long as the price is below 760, it is bearish.
Resistance: 760
Pattern: bearish
Pattern name: Descending triangle.
Sell below 750 with the stop loss of 756 for the targets 744, 736, 730, and 724.
Always do your analysis before taking any trade.

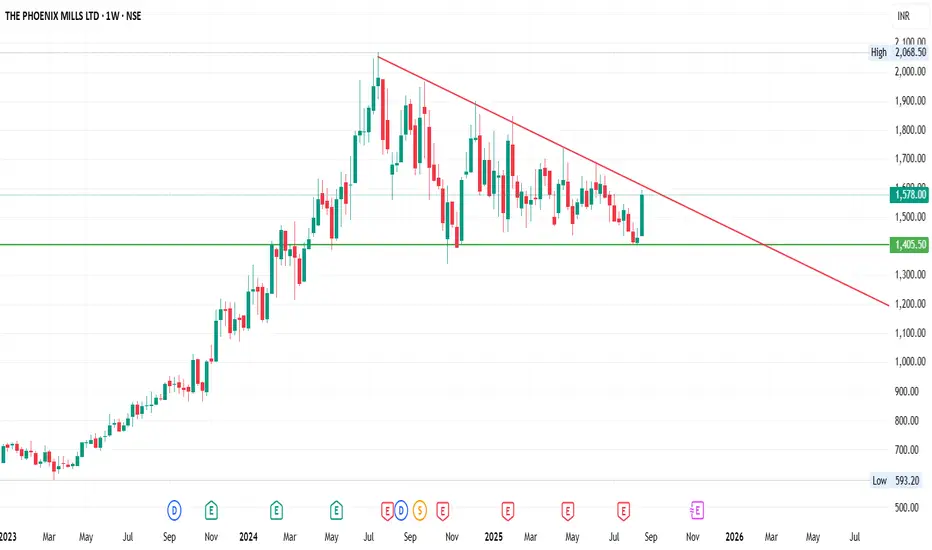
PHOENIXLTD: Symmetrical Triangle at Weekly Support ₹1400Chart Pattern: On the weekly chart, Phoenix Ltd. is forming a triangle consolidation pattern after a strong prior uptrend.
The descending trendline (red) is acting as resistance.
A strong horizontal support zone near ₹1400 (green) has been tested multiple times, showing buyers’ interest at this level.
Price action is currently squeezing inside the triangle , indicating that a big breakout move may be near.
Technical View
Support Zone : ₹1400 (strong base, tested multiple times).
Resistance Trendline : Descending resistance capping the upside.
Volume : Watch for a surge in volume to confirm breakout direction.
Breakout Levels :
Bullish breakout above the descending trendline could open up targets towards ₹1600–₹1700.
Be
arish breakdown below ₹1400 may lead to downside towards ₹1280–₹1250.
What do you think? Will Phoenix Ltd. break upwards or downwards? Drop your views below!
Disclaimer : This analysis is for educational purposes only, not financial advice. Please do your own research before investing.
Kaynes Technology is at a crucial breakout zone:
Setup: Price consolidating within a symmetrical triangle, now testing the upper trendline.
Indicators:
RSI ~58, just entering bullish zone, but not overbought.
MACD turning positive → momentum aligning with trend.
EMAs: 20 & 50 EMA aligned upward; price holding above 6,000.
Levels:
Targets: ₹6846 , ₹7,203, ₹7711
Stoploss: ₹6190
👉 Outlook: Break and sustain above ₹6,500 can trigger fresh momentum towards ₹7,000+. Support at ₹6190 is critical.

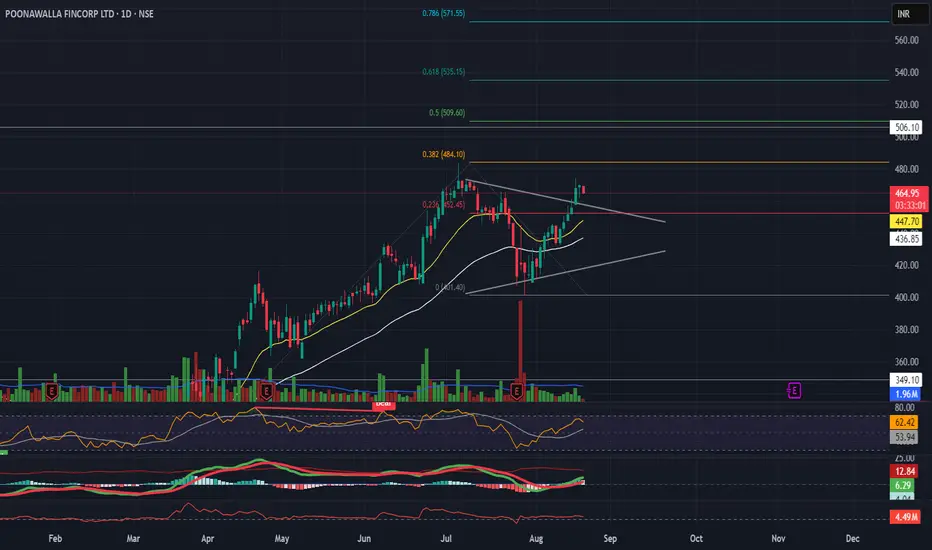
Poonawalla Fincorp showing a symmetrical triangle breakout:
Setup: Clear breakout above trendline resistance on daily chart.
Indicators:
RSI at 62 → momentum strong, near overbought but not overheated.
MACD bullish crossover with positive histogram.
EMAs: 20 & 50 EMA slope positive; price sustaining above both.
Levels:
Stoploss: ₹445
Targets: ₹509 immediate, then ₹535
👉 Outlook: Strong bullish bias. Sustaining above ₹473 opens path towards ₹500–506 zone. Support at ₹445.
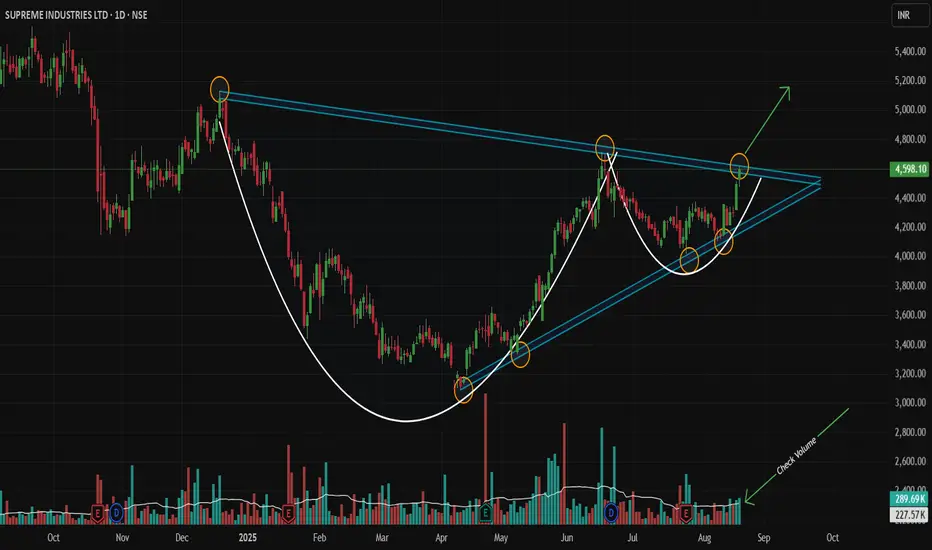
Nested Bullish Patterns Signal Major Breakout!Script: NSE:SUPREMEIND | Timeframe: Daily | Analysis Type: Technical (Pure Price Action) | Patterns: Symmetrical Triangle + Cup & Handle
Idea Summary 💡
A powerful, nested pattern setup is concluding on the daily chart! A large Symmetrical Triangle contains a secondary Cup and Handle (Bullish) pattern. This rare confluence signals strong accumulation and suggests an imminent, powerful upside breakout is likely!
Chart Pattern Logic 🔍
Primary Pattern (Symmetrical Triangle): Characterized by descending resistance (highs: Dec-18-2024, Jun-17-2025) and ascending support (lows: Apr-9-2025, May-9-2025, Jul-24-2025).
Secondary Pattern (Cup & Handle): Formed entirely within the triangle, adding a potent layer of bullish confirmation.
Confluence: This pattern-within-a-pattern setup significantly amplifies the potential for a strong upward resolution.
Trade Thesis 📈
Price is coiling at the triangle's apex under immense pressure. A decisive break above the upper trendline could ignite the next major bullish impulse phase.
Trade Setup ⚡
Direction: LONG 🟢
Entry Trigger: WAIT for a strong Marubozu green candle 🕯️ to close above the triangle's trendline on high volume (min. 1.5x average).
Stop Loss: Below the low of the breakout candle. 🛑
Profit Targets: 4700 🎯 | 4800 🎯 | 5125 🎯
Long-Term Target: 6000+ (Extended Target Based on Pattern Confluence & Momentum) 🚀
Risk Management: Trail stops aggressively after Target 1.
Got another stock you want me to break down? 📊
Drop the ticker in the comments below! If you found this idea useful, like and follow for more pure price action analysis.
Disclaimer: This post/information is solely for educational purposes and should not be construed as a recommendation or financial advice. Trading carries a risk of loss. Please conduct your own research or consult a financial advisor before making any investment decisions. The author and TradingView are not liable for any financial losses incurred based on this content.
Sensex - Expiry day analysis Aug 19Today price opened gap up and faced resistance at the 81800 zone and fell down. The 81800 zone is a strong resistance, and the 80700 zone is strong support. Price can move within this range if it does not gain strength.
Price has formed a descending triangle pattern and also looks bearish.
Buy above 81500 with the stop loss of 81380 for the targets 81600, 81720, 81880, 81980, 82100, and 82240.
Sell below 81180 with the stop loss of 81320 for the targets 81060, 80920, 80840, 80700 and 80580.
Always do your analysis before taking any trade.

Nifty 50 Intraday Expiry for 14/08/25 ⚡ Trade Setups with Precise Stop Loss Rules
A) BULLISH BREAKOUT (PREFERRED):
✅ Trigger: Hourly candle CLOSE > 24,700 (breakout confirmation).
🎯 Targets:
T1: 24,800
T2: 24,950 (triangle high)
❌ STOP LOSS: Below the LOW of breakout candle (e.g., if breakout candle low = 24,685, SL = 24,684).
B) BEARISH BREAKDOWN:
✅ Trigger: Hourly candle CLOSE < 24,465 (breakdown confirmation).
🎯 Targets:
T1: 24,350
❌ STOP LOSS: Above the HIGH of breakdown candle
🚫 STRICT NO-TRADE ZONES (NTZ):
Upper NTZ: 24,535 – 24,700
→ Avoid longs/shorts. Wait for confirmed breakout/breakdown.
Lower NTZ: 24,535 – 24,465
→ Avoid premature shorts. Only trade on confirmed close < 24,465.
Price Bias: Bullish Edge: Repeated tests of 24,700 suggest weakening resistance. Breakout likely if volumes surge.
Bearish Caution: Failure below 24,535 may accelerate selling toward 24,350.
📅 Critical Notes:
Expiry + Holiday Risk:
15th Aug (Fri): Weekly Expiry + Independence Day Holiday (Market Closed).
16th–17th Aug (Sat–Sun): Weekend closure.
🛑 NO BTST: Square off all positions by day’s close (14th Aug). Holding overnight into expiry + 3-day break = unacceptable risk!
Disclaimer:
This idea is for educational purposes only. The market outlook involves substantial risk, especially during expiry and holidays. Do NOT hold positions overnight. Trade with strict stop losses, and adjust position sizes to volatility. Consult a financial advisor if needed. Jai Hind! 🇮🇳"
Happy Independence Day! Celebrate freedom, trade disciplined.
Key Tip: Trail SL to breakeven at T1 to protect profits.

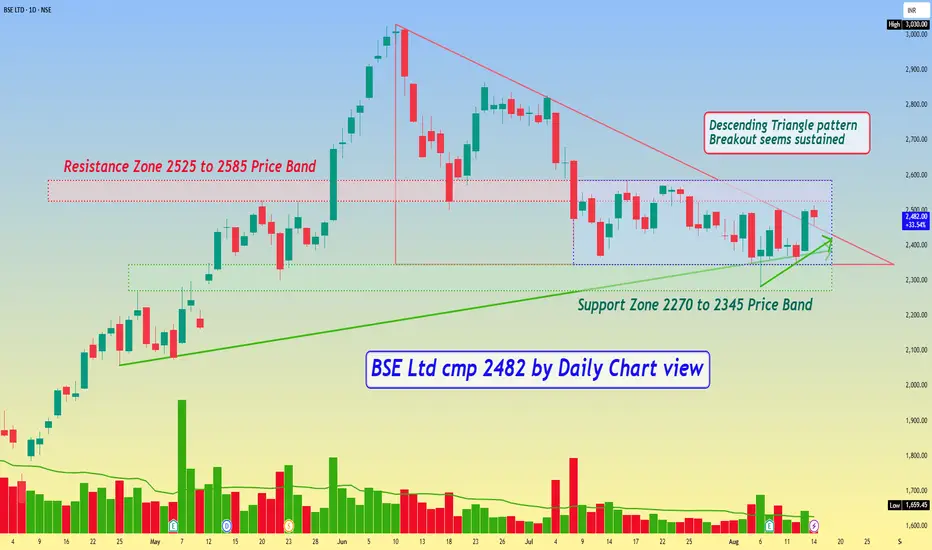
BSE Ltd cmp 2482 by Daily Chart viewBSE Ltd cmp 2482 by Daily Chart view
- Support Zone 2270 to 2345 Price Band
- Resistance Zone 2525 to 2585 Price Band
- Descending Triangle pattern Breakout seems sustained
- Stock seems trading within price range indicating Darvas Box setup
- Volumes seen gradually syncing closely with the average traded quantity
- Most known Technical Indicators BB, EMA, MACD, RSI, SAR seem trending positively