BLUE STAR LTD - Technical Analysis | Triangle Pattern ________________________________________
📊 BLUE STAR LTD – Beginner-Friendly Technical & Fundamental Snapshot
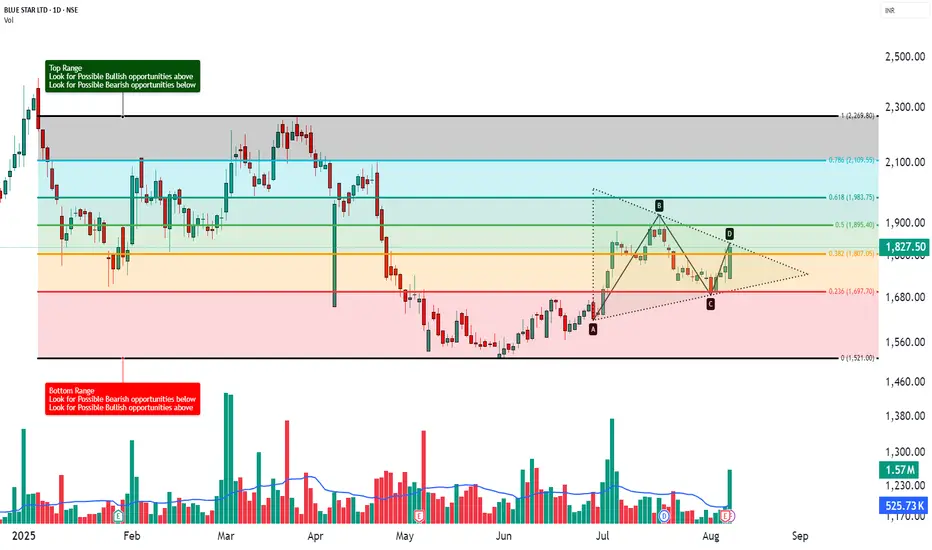
Ticker: NSE:BLUESTARCO | Sector: Consumer Durables
CMP: ₹1,827.50 ▲ (+3.23%) (as of August 7, 2025)
Chart Pattern: Symmetrical Triangle
Technical View: ⭐⭐⭐⭐ Neutral-to-Positive (Educational Purpose Only)
________________________________________
🔍 What’s Happening on the Chart?
BLUE STAR has formed a Symmetrical Triangle – a pattern where price moves within narrowing highs and lows 📉📈
This indicates consolidation and usually results in a strong breakout or breakdown.
📦 Triangle Range: ~₹1,616 to ₹1,922
👉 Current price is testing the upper edge — a breakout could be brewing!
________________________________________
🕯️ Candle & Indicator Analysis (Simplified)
Here’s what the chart and indicators show:
EMA 200 Crossover:
✅ Bullish signal – price is trading above its 200 EMA
RSI (~60):
🔼 Showing strength – not yet overbought
Stochastic (~92):
🚀 Near overbought – buyers in control
MACD:
⚠️ Still bearish – momentum confirmation is pending
VWAP:
✅ Aligned with bullish bias — suggests institutional support
📊 Volume Breakout:
🔺 Volume surged to 1.57 million, almost 3x the average of ~525.73k — a strong sign that big players may be stepping in as price nears breakout levels.
🧠 Trading Insight:
The chart looks bullish but still needs confirmation. Watch for a proper breakout above the triangle with volume.
________________________________________
📰 Recent News & Sentiment Update
Q1 FY26 Results (as of June 30, 2025):
📈 Total Income: ₹2,998.32 Cr (↑ 3.8% YoY)
💰 Net Profit: ₹122.23 Cr
(Source: Company Filings & Analyst Coverage)
Sentiment:
✅ Positive: Modest earnings growth, analyst support
⚠️ Caution: Target cut by some analysts — signals mixed expectations
________________________________________
🧭 Support & Resistance Levels
📌 Resistance Zones (Upside watch):
R1: ₹1,866
R2: ₹1,904
R3: ₹2,112 (measured move target)
📌 Support Zones (Downside watch):
S1: ₹1,750
S2: ₹1,680
S3: ₹1,616 (triangle base)
________________________________________
🔍 How to Trade a Symmetrical Triangle
A symmetrical triangle is a neutral pattern.
The breakout confirms direction:
– Above = potential upside 🟢
– Below = potential downside 🔴
📈 If Bullish Breakout Happens (above ₹1,860):
✅ Wait for a candle close above ₹1,860 with volume
🎯 Possible Price Zones: ₹2,000 → ₹2,165
🛑 Stop Loss: ₹1,750 (below triangle support)
📉 If Bearish Breakdown Happens (below ₹1,680):
✅ Wait for close below ₹1,680
🎯 Possible Price Zones: ₹1,500 → ₹1,375
🛑 Stop Loss: ₹1,750 (above triangle resistance)
________________________________________
🧠 STWP’s Educational Trade Idea (Not a Recommendation)
🎯 Long watch above: ₹1,839
🛑 Stop Loss: ₹1,719.50
📈 Risk-Reward Idea: Minimum 1:1; ideally aim for 1:2+
________________________________________
🔰 Trading Notes
✅ Always use stop losses
⏳ Be patient — wait for confirmation, not assumption
🚫 Don’t chase green candles or panic in red ones
📚 Trade based on structure, not emotions
💼 Risk only 1–2% of your capital per trade
🎯 Target minimum 1:1.5 Risk-to-Reward ratio
________________________________________
⚠️ Disclaimer (Read Carefully)
This post is for educational and informational purposes only.
The author is not a SEBI-registered investment advisor. No buy or sell recommendations are being made.
All views are based on chart patterns, publicly available data, and personal learning experience.
Trading involves risk. Losses can exceed your investment. Always consult a SEBI-registered advisor before making financial decisions.
By engaging with this content, you agree to these terms.
________________________________________
💬 Was this useful?
Drop your thoughts, questions, or setups in the comments below ⬇️ — let’s grow together!
🔁 Share this post with fellow traders and beginners to spread clean, structure-based learning.
✅ Follow simpletradewithpatience for beginner-friendly setups, price action insights, and disciplined trading content.
🚀 Stay Calm. Stay Clean. Trade With Patience.
Trade Smart | Learn Zones | Be Self-Reliant 📊
________________________________________
Triangle
NVDAPrice is consolidating in the form of a symmetrical triangle. 180 is an important zone. Sustaining above this is important to be bullish.
Buy above 180.5 with the stop loss of 179 for the targets 182, 183.5, 185, and 187.5
A symmetrical triangle can give a breakout in any direction. Price will become bearish below 177.
Always do your analysis before taking any trade.

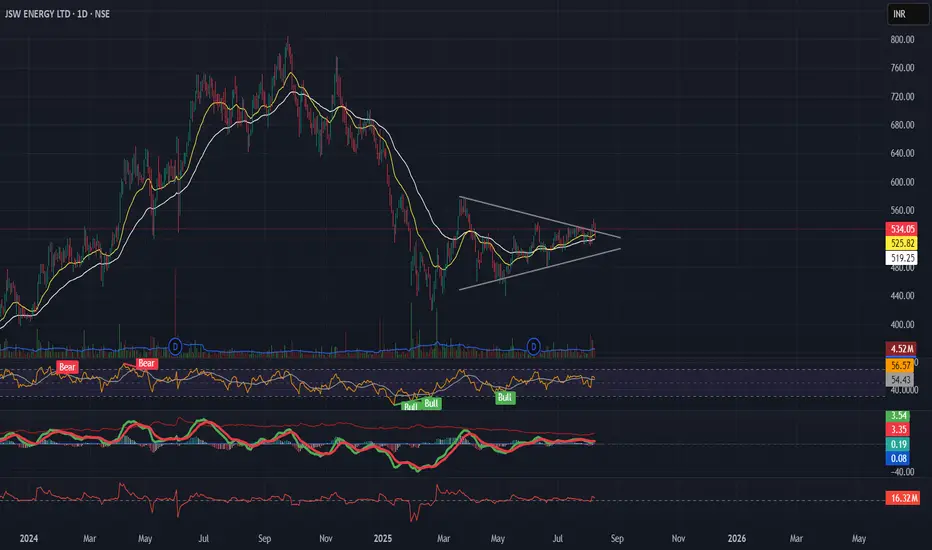
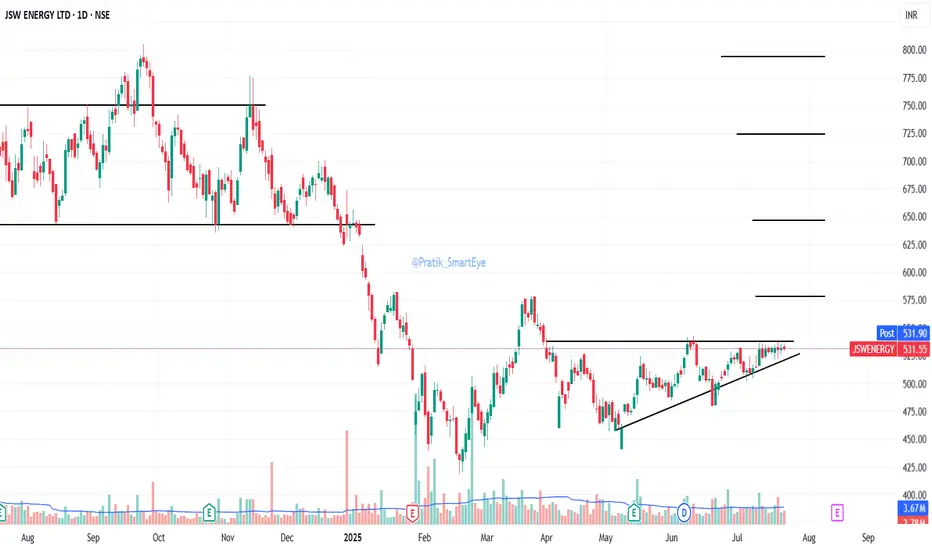
JSWENERGY | Symmetrical Triangle Breakout in Progress?Description:
JSW Energy is forming a symmetrical triangle on the daily chart after a downtrend — resembling a potential bearish pennant, but price structure, sloping EMAs, rising momentum, and positive EFI hint at bullish strength.
📌 Breakout Level: ₹534
📉 Stoploss: ₹519 (ATR-based)
🎯 Targets: ₹563 → ₹597 → ₹694 (as per Fib projections)
🧭 Macro Context:
- Infra & Energy sectors improving
- Govt push for renewables
- Dollar weakening, risk-on tone aiding sentiment
Structure, volume, and macro are aligned — tracking this breakout closely.
MAXHEALTH – Symmetrical Triangle Breakout________________________________________________________________________________
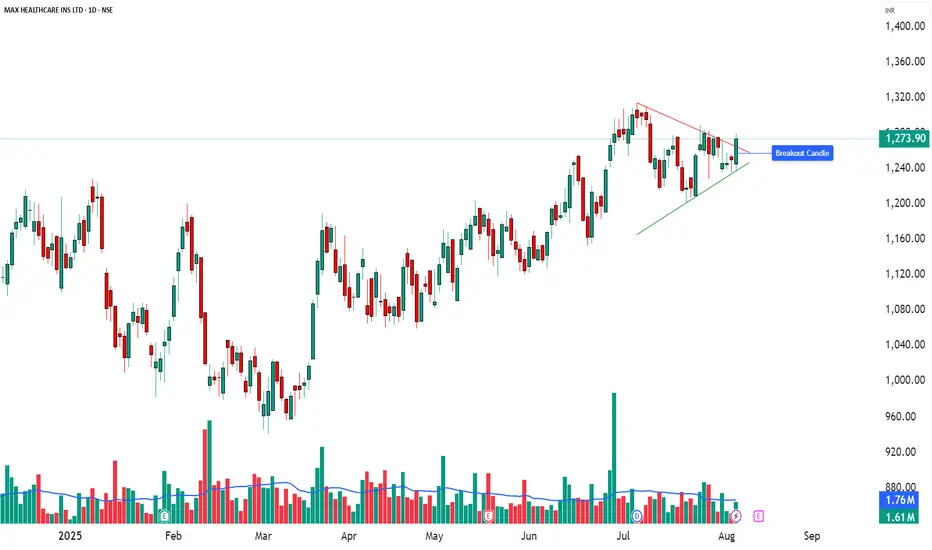
🧠 MAXHEALTH – Symmetrical Triangle Breakout
📌 Chart Overview
Symbol: `MAXHEALTH` (NSE)
Timeframe: 1D (Daily)
Pattern Identified: 🔺 Symmetrical Triangle
Breakout Confirmation: ✅ Bullish Engulfing
Volume on Breakout: 1.61M (above average)
________________________________________________________________________________
📊 Technical Breakdown (For Educational Use Only)
🔹 Between June and August, MAXHEALTH consolidated into a symmetrical triangle, a classic pattern suggesting price compression.
🔹 A bullish breakout occurred with a strong engulfing candle on above average volume — a potential early signal of trend continuation.
🔹 The breakout occurred near the apex of the triangle, increasing its validity.
💡 Such breakouts are commonly followed by retests or follow through moves. This post is intended to help learners spot and study such setups.
________________________________________________________________________________
📌 Key Reference Levels (Not Trade Levels)
As per the current chart structure, key reference levels for MAXHEALTH include resistance zones at ₹1,290.1, ₹1,306.3, and ₹1,332.6, which may act as potential supply areas in case of continued upward momentum. On the downside, important support zones are observed near ₹1,247.6, ₹1,221.3, and ₹1,205.1, where price could find buying interest if a pullback occurs. These levels are shared purely for technical context and educational study, not as trade recommendations.
________________________________________________________________________________
🧠 Learning Takeaways
✅ Symmetrical Triangle: Indicates indecision and tightening price range. Breakout direction often sets near term tone.
✅ Bullish Engulfing Candle: A strong reversal pattern when formed post consolidation or at trendline breaks.
✅ Volume Confirmation: Adds credibility to breakout strength — look for rising volume on breakouts.
🔍 Always watch for follow up candles, possible pullbacks (retest entries), or invalidation zones to study trade structure in real world setups.
________________________________________________________________________________
⚠️ Disclaimer & Educational Note
This content is strictly for educational and research purposes only. I am not a SEBI-registered advisor, and no buy/sell recommendations are being provided. All insights are based on personal analysis and experience and are not financial advice.
📘 This setup illustrates how combining price action (candlesticks), support/resistance zones, volume, and indicators like RSI or MACD can help build conviction in trades. However, trading—especially in derivatives like options—involves high risk, and losses can exceed the initial investment.
👉 Always do your own research and consult a SEBI-registered advisor before taking any position.
👉 Use strict risk management and only trade with capital you can afford to lose.
The author assumes no liability for any losses incurred.
By engaging with this content, you agree to these terms.
________________________________________________________________________________
💬 Found this helpful?
Drop your thoughts, questions, or insights in the comments below ⬇️ — let’s learn together!
🔁 Share this post with your trading friends and community — help them discover clean charts, structured setups, and zone-based learning.
✅ Follow simpletradewithpatience for clear setups, educational content, and a no-nonsense approach to price action, supply-demand zones, and risk-managed trades.
🚀 Trade with patience. Trust your charts. Stay clear-headed.
Because the goal is not just to trade — it's to trade better.
Be Self-Reliant | Trade with Patience | Learn with Charts & Zones 📊
JSW ENERGY - SwingJSW Energy is transitioning aggressively toward renewables, with investments in solar, wind, energy storage, and green hydrogen.
P/E ratio stands at 46.36, indicating a premium valuation compared to the sector average of 32. While growth is underwhelming, the company maintains good asset quality. Debt levels are manageable, and promoter holding remains strong.
The stock recently showed consolidation between 510 - 530, with support near ₹500 and strong resistance around 540. Technical indicators suggest a bullish bias, with MACD showing early signs of upward momentum. Traders may consider swing opportunities if the stock breaks above ₹542 with volume confirmation.

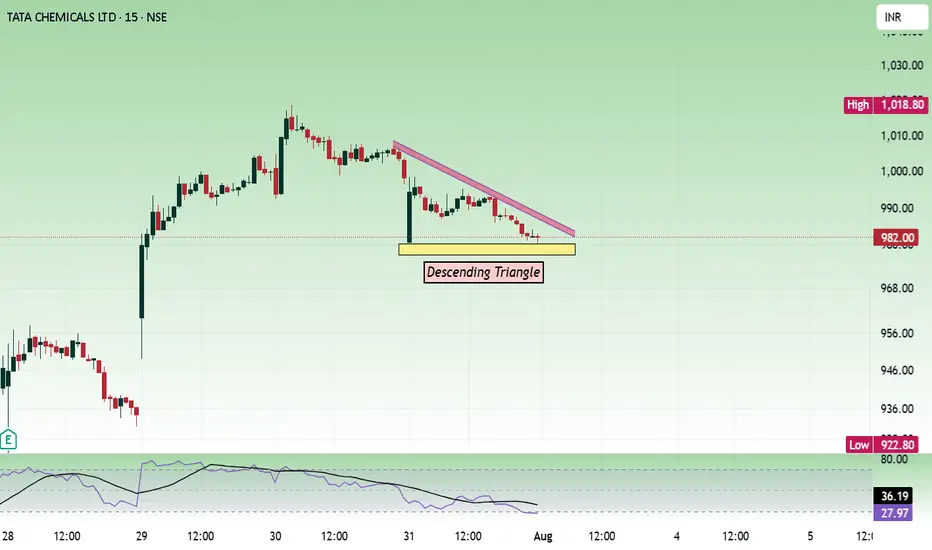
TatchemicalsPrice is consolidating in a narrow range and forming a triangle. 980 is a support zone and price can move up.
Buy above 980 with the stop loss of 972 for the targets 988, 996, 1004 and 1016.
Sell below 958 with the stop loss of 966 for the targets 950, 942, 936 and 928.
Always do your own analysis before taking any trade.
Nifty - Monthly Expiry Analysis July 31Price is facing resistance at 24900 zone. If price sustains above it, the next resistance is at 25000 psychological zone. 24900 to 25000 can be choppy if price can not gain strength to move up.
Buy above 24920 with the stop loss of 24870 for the targets 24960, 25000, 25060, 25120 and 25200.
Sell below 24800 with the stop loss of 24850 for the targets 24760, 24720, 24660, 24620 and 24560.
Always do your own analysis before taking any trade.

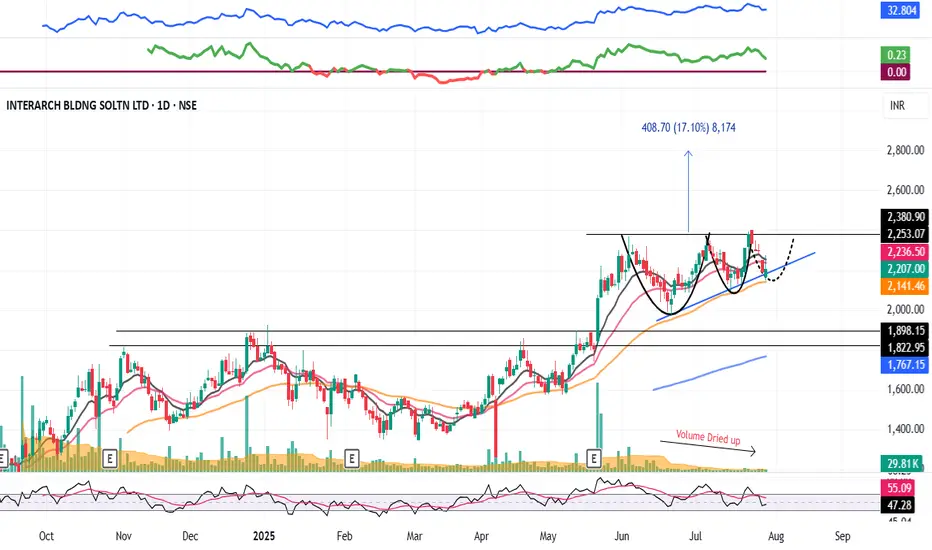
INTERARCH : Swing Pick (1-3 Months)#INTERARCH #vcppattern #chartpattern #ascendingtrianglepattern #breakoutstock #patterntrading #Swingtrading
INTERARCH : This will test Patience
>> VCP formation in process
>> Ascending Triangle forming
>> Breakout candidate
>> Good Strength & Volumes Dried up
>> Trending Stock in consolidation
Swing Traders can lock profits at 10% & Keep Trailing
Pls Comment , Boost and Follow for more such Analysis
Disc : Charts shared are for Learning Purpose and not a Trade recommendation, Consult your Financial advisor or a SEBI Registered Advisor before taking position in it.
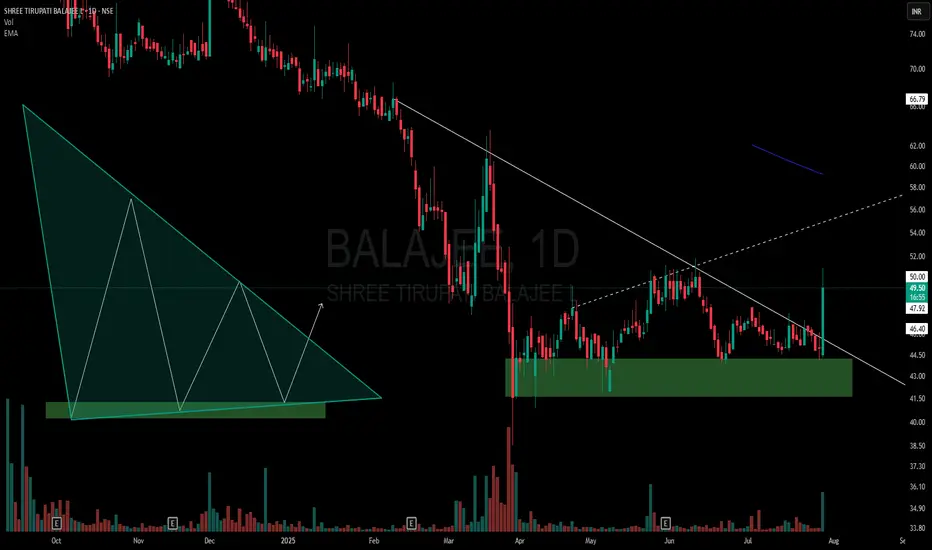
BALAJEE - Descending Triangle Meets Multi-Pattern ConfluenceOn the daily chart of Balajee, price action has formed a descending triangle right at the lower end of the trend:
🔻 Lower highs consistently pressuring horizontal support.
🟩 Price sitting within a clear demand zone, adding significance to the structure.
📊 Volume tapering off through consolidation, a classic triangle trait.
📐 Presence of a hidden counter-trend line (dotted) hinting at a potential broadening formation — showing a rare multi-pattern overlap.
Such setups are important not for predicting price, but for understanding how multiple structures can interact.
⚠️ Purely educational observation — no buy/sell advice.
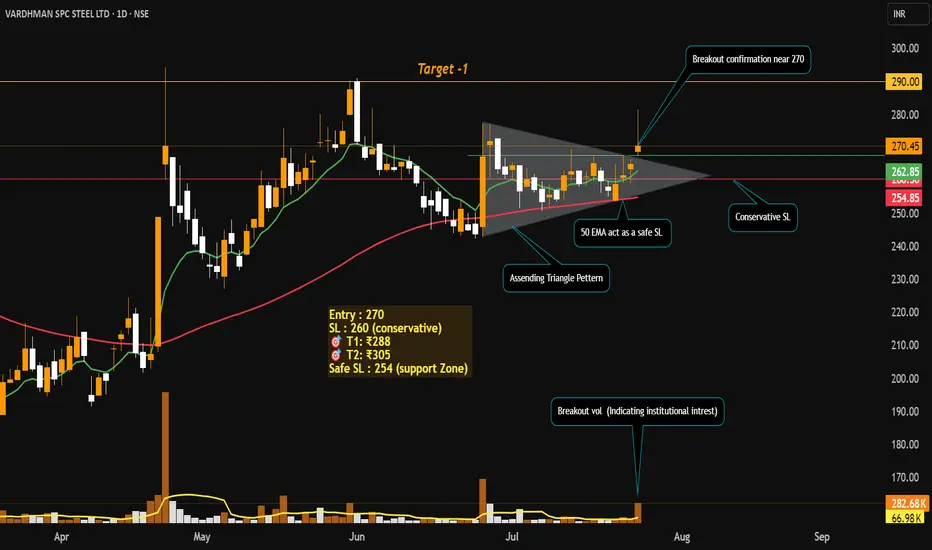
Swing Trade Idea: Vardhman Special Steels Ltd (NSE: VSSL)Technical Setup
Ascending Triangle Breakout on Daily Timeframe
Volume Spike 4x average volume on breakout day — strong institutional confirmation.
both the EMAs Bullish crossover (Price trading above both the EMAs).
RSI showing bullish momentum (60-65).
Price Action Strategy
Price broke out from resistance zone with strong bullish candle and closed near the high.
Previous resistance of ₹270 now acts as support.
Fundamentals
Promoter Holding: High, backed by Aichi Steel (Toyota Group).
Debt/Equity: Low (~0.12) → Strong solvency.
Strong financials: ROE / ROCE ~12.4% / ~17.8%
Revenue Growth: Consistent YoY
Valuation: Reasonable P/E (~18–20x)
My View: Entered at breakout with strong confirmation. Trail SL and book profits step-by-step. Holding for higher targets as long as price respects 9 EMA.
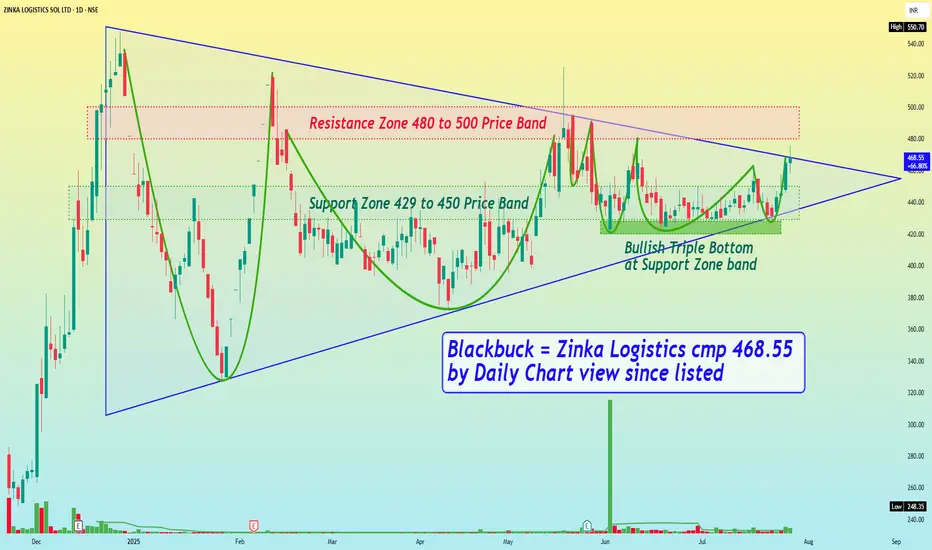
Blackbuck = Zinka Logistics cmp 468.55 by Daily Chart view sinceBlackbuck = Zinka Logistics cmp 468.55 by Daily Chart view since listed
- Support Zone 429 to 450 Price Band
- Resistance Zone 480 to 500 Price Band
- Symmetrical Triangle Breakout been attempted
- Closely considerate VCP pattern formation seems done
- Volumes are in close sync with the average traded quantity
- Technical Indicators BB, EMA, MACD, RSI, SAR showing positive trend
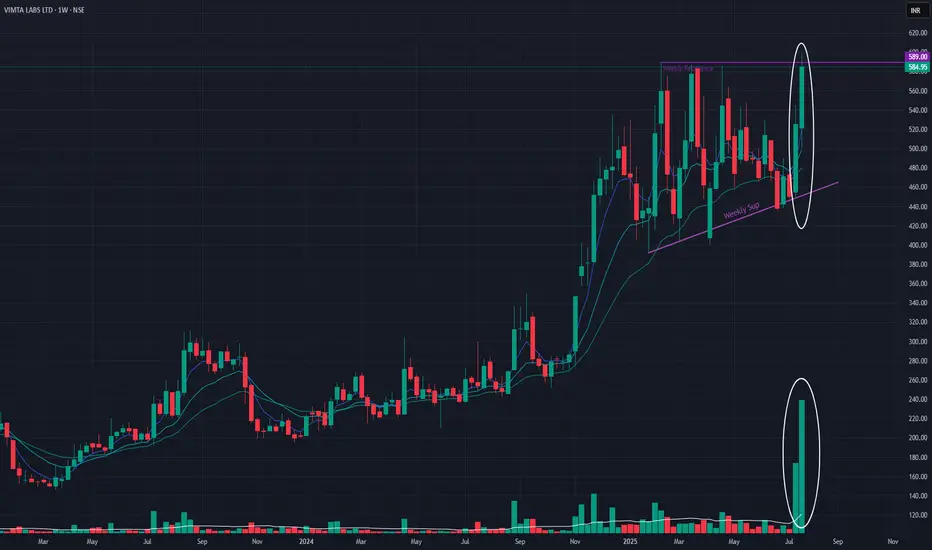
Vimta Labs Ltd (Weekly Timeframe) - Potential BreakoutThis week, the stock has breached the resistance zone and made a new All Time High with huge volume. In Daily Timeframe, the stock has clearly been forming an Ascending Triangle Pattern which is a Bullish pattern. If the stock breaches the resistance zone with good volume, then it may reach new All Time Highs of 780 range.
Awaiting further Price Action.

AT&T Inc BREAKOUTAT&T Inc Share has broken its previous pattern after a strong bullish move. It increased by 100% in two years, from 14 to 27, and now it’s breaking out with a big bullish monthly candle. Due to this strong upward momentum over the past few years, the stock might consolidate for a while before moving higher. This means the upward move could take some time or even a year, so we should keep that in mind when swing trading or investing.
The target and stoploss levels depend on each person’s risk appetite. A minimum risk-reward ratio of 1:1 is always good for swing trades. For example, if our target is around 32 or 33, we could set the stoploss below 25, like at 24.5. This would give a risk-reward ratio of approximately 1.77.
This is just an analysis based on the chart pattern. We can't always expect the share to move exactly as we want. That's why we always put a stoploss. Because many different people are trading based on their own thoughts and decisions. So, never feel bad if a share doesn’t move the way you expect. There’s always an opportunity somewhere else to grab.

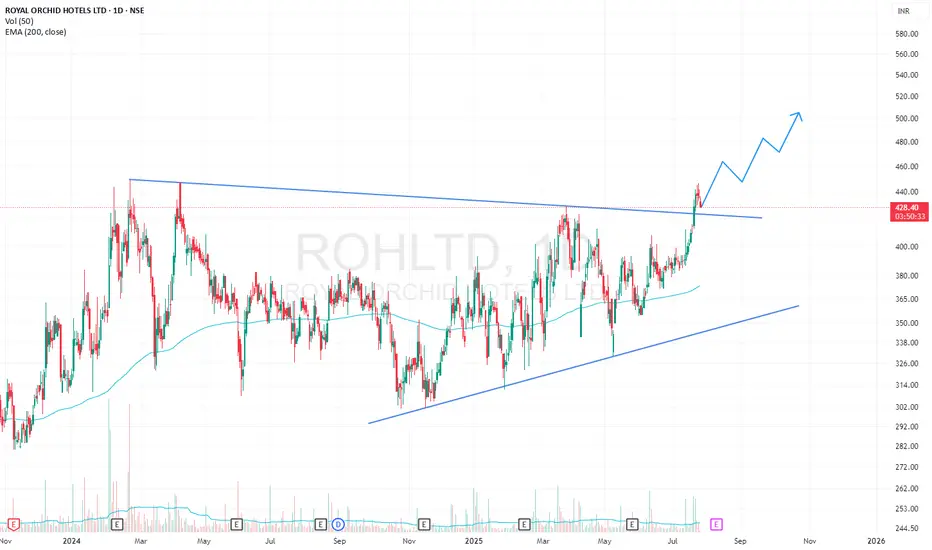
ROHLTD Triangle BreakOut 1DRoyal Orchid Hotels has given a breakout from triangle pattern on 1D timeframe. It has given a breakout with high volumes. It is currently trying to retest its breakout resistance.

JSW Energy: forming a ascending triangleJSW Energy: forming a ascending triangle. CMP 531.
Breakout at sustained close above 540.
Resistance 578/646/724/794
Support 515/508
Earnings expected on 14Aug25
UPL LTD BREAKOUTUPL LTD has broken through its weekly trend line and is now showing bullish momentum after a short period of consolidation. The next target is the all-time high, which traders may aim for. A suitable stop-loss could be placed at either 650 or 600, depending on individual risk appetite.
On the financial front, UPL's latest quarterly results for the period ending March 2025 show solid performance. The company reported a revenue of Rs 15,573 crore, along with a net profit of Rs 1,106 crore. Its Earnings Per Share (EPS) for the quarter stood at Rs 11.42.

Bajaj Auto Ascending Triangle Breakout: ₹8,650 → ₹9,700🔎 Study: This analysis is based on the daily timeframe, focusing purely on price action and chart patterns—no indicators, no news.
📈 Pattern: Symmetrical triangle formed since May 2025.
🔹 Breakout Signal: Today’s daily candle closed decisively above the upper trendline, confirming the triangle breakout.
🔹 Entry:
• Buy around ₹8,420–8,450 once price sustains above the broken trendline.
🔹 Stop‑Loss:
• Place at ₹8,306 (today’s low) to invalidate the breakout on a downside close.
🔹 Profit Targets & Trailing:
Short‑Term: ₹8,650 → book partial & trail stop to ₹8,770
Mid‑Term: ₹8,770 → trail stop toward ₹9,000 as price clears each resistance
Long‑Term: ~₹9,700 (triangle height projection) over 2–3 months+
🔹 Risk Management:
• Expect minor pullbacks at interim resistances—healthy for continuation.
• Adjust position size and stop distances to match your risk tolerance.
⚠️ For educational discussion only; not financial advice.
🔍 Always do your own research and manage risk with proper stops.
👍 Boost if you find this useful, drop a 🚀 in the comments, and share your ideas below!

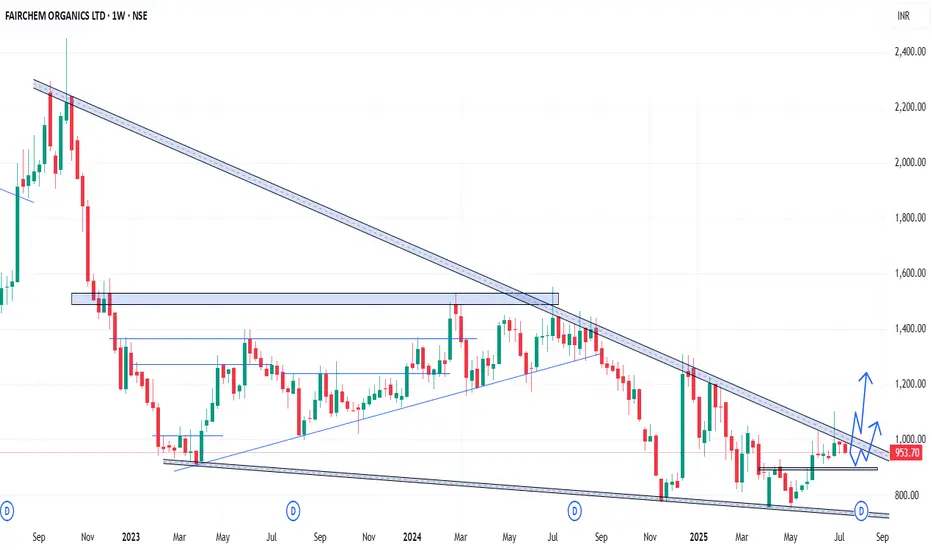
FAIRCHEMOR - Weekly AnalysisIn the Weekly Chart of FAIRCHEMOR ,
we can see that, it is shrinking from the Top. Soon, we will se momentum in it.
Possible momentums are shown in chart.
GOLD (XAUUSD) 4H Analysis – Breakout Imminent from Rising Wedge!Gold is currently trading at 3353.39 after completing a well-defined ABCDE rising wedge structure on the 4H chart. The market is showing signs of exhaustion near the 3353–3373 resistance zone, with a potential bearish rejection likely to follow.
🔍 Key Highlights:
Pattern: Rising Wedge (ABCDE complete) – a classic bearish reversal setup.
Sell Zone: 3353.88 to 3371.62 – Expect high volatility and sharp rejection.
Target: 3296.36 – Marked as the first major support zone.
Risk Management: Strong R:R setup with invalidation above 3373.93.
Heikin Ashi candles show weakening bullish momentum near the top.
📉 What to Watch: If price confirms rejection below 3353 with bearish pressure, a sharp fall toward the 3296 level could follow. Breakout traders and swing traders should stay alert – this could be a textbook move.
📌 Professional Insight: This setup is not just a pattern – it's a psychological battlefield between bulls pushing exhaustion and bears waiting to strike. The next few candles could define the mid-term gold trend.
🚨 Don’t miss this potential opportunity. Mark your levels. Stay disciplined.
#GoldAnalysis #XAUUSD #ForexTrading #SwingTrade #TechnicalAnalysis #HeikinAshi #BreakoutSetup #SmartTrading #RiskReward #TradingEdge

Solana Long-Term Cup & Handle | +300% Potential🔍 #OnRadar | #Crypto
#SOLUSD (#Solana)
Solana Long-Term Cup & Handle | +300% Potential
CMP: $174
Support Zone: $123.00 – $100.00
Pattern Invalidation Level: $95 (MCB - Monthly Closing Basis)
📊 Technical Overview:
Solana (SOLUSD) is showing signs of a long-term Cup & Handle pattern forming on the higher timeframes.
☕️ Cup formation appears complete.
📐 Handle is likely developing within an Ascending Triangle .
🔄 Neckline Resistance: ~$305
🎯 Potential Target on Breakout: ~$560
🚀 Upside Potential: Approx. +300% from CMP
While it's early to confirm a breakout, this structure is worth keeping on the radar for long-term trend traders and pattern watchers.
⚠️ Disclaimer:
This is a technical analysis observation shared for educational purposes only.
Not a buy/sell recommendation.
Please do your own research ( #DYOR ) and consult your financial advisor before making any investment decisions.
#Crypto | #Solana | #SOL | #TechnicalAnalysis | #ChartPatterns | #CupAndHandle | #AscendingTriangle | #LongTermView

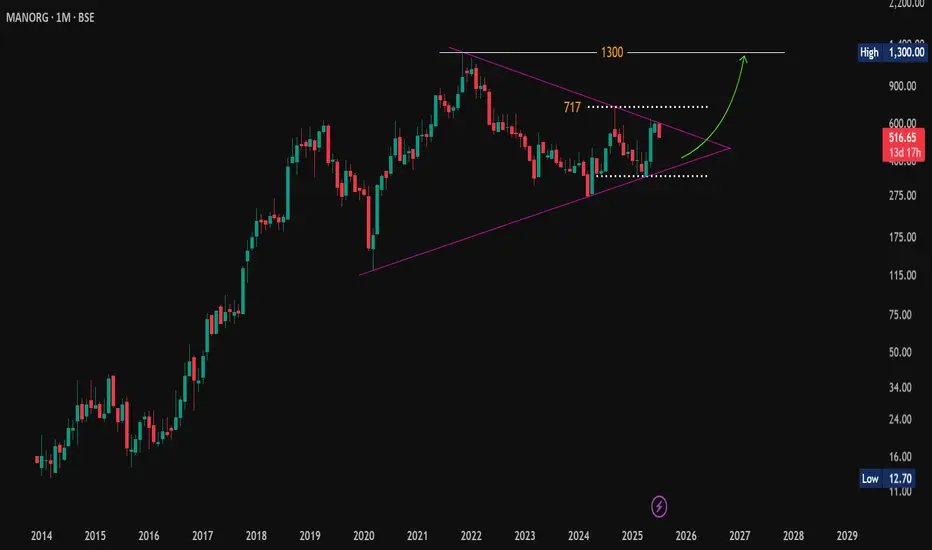
ManOrg: Symmetrical Triangle Tightens – Big Move Ahead?🔎 #OnRadar
#ManOrg (Mangalam Organics Ltd.)
Symmetrical Triangle Tightens – Big Move Ahead?
CMP: 516.65
📈 Technical Outlook (Monthly Chart | For Educational Purpose Only):
#SymmetricalTriangle pattern appears to be forming on the monthly timeframe.
The price has faced repeated resistance near the falling trendline around 629 and is currently showing signs of a possible retracement towards the lower end of the triangle. The key support zone lies between 473–378 .
If this zone holds, price may attempt another move up toward the falling trendline resistance. A monthly close above the trendline could indicate a potential breakout from this long-term structure. If sustained, the stock may gradually head toward its all-time high zone near 1,300 .
⚠️ Disclaimer: This post is shared only for educational purposes. It is not a buy/sell recommendation. Please consult a financial advisor before making any investment decisions.
#TechnicalAnalysis | #SymmetricalTriangle | #ChartPatterns | #PriceAction | #LongTerm