GOLD BULLISH TRIANGLE PATTERN | BULLISH BREAKOUT Gold is currently consolidating within a tight symmetrical triangle following a corrective pullback, indicating a period of compression ahead of a potential expansion move. Price action continues to hold above the key demand zone around 5030, which remains a critical structural support.
Multiple rejections from the upper boundary of the consolidation suggest building bullish pressure. A decisive breakout and sustained acceptance above the 5045–5048 resistance zone would confirm bullish continuation and signal the next leg higher.
On confirmation, upside momentum is expected to target 5055, followed by an extension toward 5065, aligning with projected measured-move objectives from the triangle breakout.
A failure to hold above 5030 would invalidate the bullish bias and expose price to deeper downside correction, negating the current setup.
Trianglebreak

BEL Triangle & Flag BreakoutBEL is attempting breakout from Triangle and Bull Flag Pattern on 1D timeframe. Watch for closing at End of the Day. Watch for Earnings because this stock carries earnings risk.

TRIANGLE BREAKOUT IN POLYMED!!DISCLAIMER : This idea is NOT a trade recommendation, but only my observation. Please take trades based on your own analysis
Following points to be noted:
1. Price broken out of a descending triangle.
2. Price has also taken support from a higher TF demand zone.
3. Triangle breakouts from such oversold zones have a higher probability of success.
4. Targets are the pattern height of the consolidation structure itself.
The following trade can be initiated:
Entry - CMP, Tgt- 2400, SL - 1790, RR - 1:2.2

CenturyPly | Out of Triangle Consolidation?DISCLAIMER: This idea is NOT a trade recommendation but only my observation. Please take your trades based on your own analysis.
Points to consider:
----------------------
1. Stock has been consolidating in a triangle since Sept of last year
2. Relative Volume has dried up significantly prior to breakout
3. Triangle Breakouts are some of the more probable ones amongst other consolidation breakouts.
4. The target for the breakout is the pattern height of the triangle, SL just below 710
----------------------

Gravita Triangle Breakout 1DGravita is attempting to breakout after forming a triangle pattern on 1D timeframe with high volumes. The stock is also trading above 200ema. Enter after bullish confirmation.

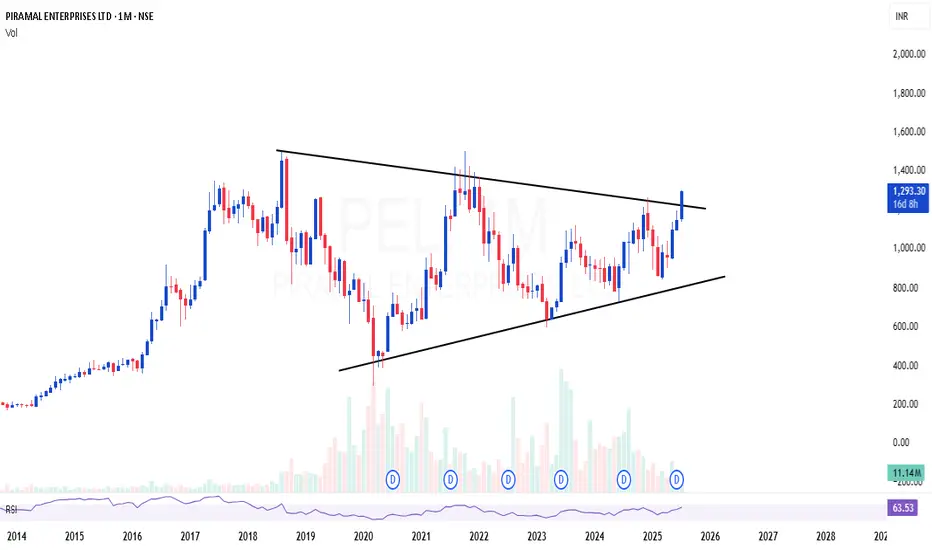
PEL | Triangle breakout after 7 years consolidationPEL | Triangle breakout after 7 years consolidation
CMP : 1293 (Dip : 1150)
SL : 1000
P
USDJPY – Weekly Triangle Near a Big Decision !!The pair has been stuck inside a large weekly triangle formation, compressing price action after years of volatility. These types of structures usually lead to powerful breakouts, and the direction will depend on how the BoJ policy stance and the Fed’s rate cut cycle unfold.
Chart validation:
Price is coiling between lower highs and higher lows the classic look of a triangle consolidation.
Resistance sits around 162, with the upper bound of the triangle capping rallies.
Support near 137–138 has been holding the downside so far.
The breakout path points to two extremes:
Upside projection: A clean break could open a run towards 175–176.
Downside projection: A bearish resolution could drag it back to 127, the lower long-term support.
Key takeaway:
For now, USDJPY is neutral but building energy.
The next decisive move will be sparked by central bank divergence if the Fed cuts faster than the BoJ tightens, the yen could strengthen and break lower; if the BoJ holds back and the Fed stays cautious, the pair could rip higher.
We should wait for confirmation outside this triangle before positioning for the next trend. Trade safe !

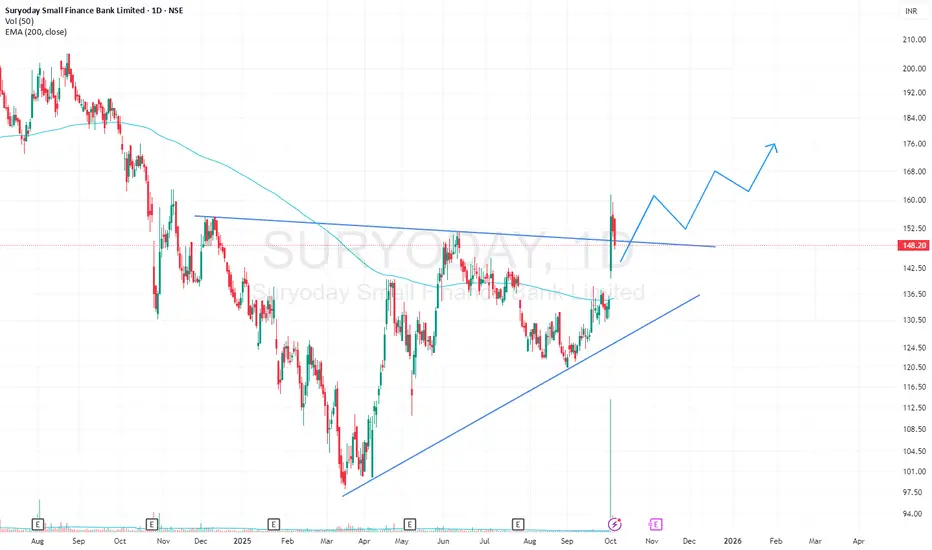
SURYODAY SFB Triangle BreakOutSuryoday SFB has given a breakout from a Triangle pattern with high volumes on 1D timeframe. The stock is apparently retesting its resistance trendline. The stock is also trading above its 200EMA.
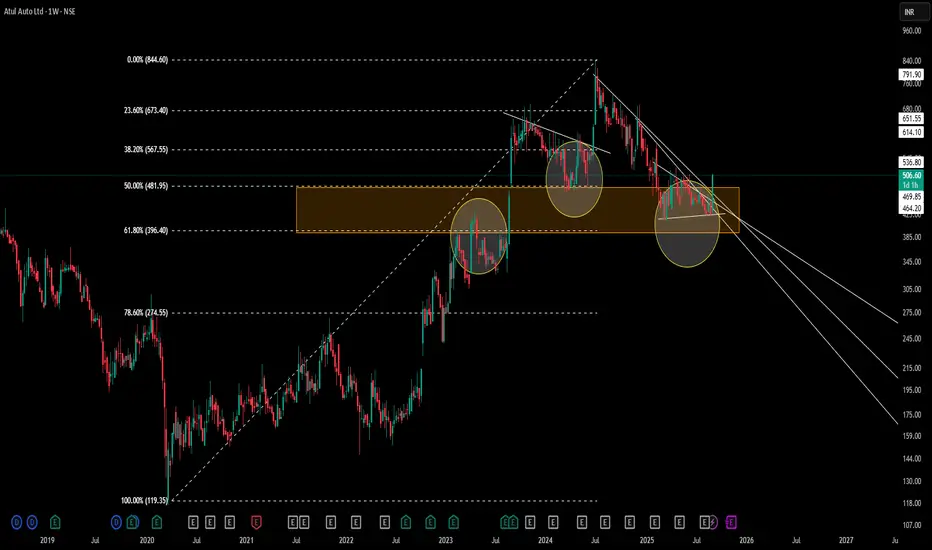
Atul Auto | MTF Fibonacci Confluence structuresWeekly Chart Analysis
– Drew a multi-timeframe Fibonacci from the 119.35 low (Mar ’20) to the 844.60 high (Oct ’24) on the Monthly time frame .
– Highlighted the 50–61.8% retracement zone (481.95–396.40) as an orange supply/demand area.
– Circles mark historical pivots where price reacted as support or resistance within this zone.
Key Observations
-Price consistently respected the 50–61.8% band during prior rallies and pullbacks.
-Recent price action formed a contracting triangle (CT) at the lower edge of the Fibonacci zone.
-Volume contraction noted inside the triangle, suggesting supply–demand equilibrium.
Disclaimer: This analysis is provided for educational and informational purposes only and does not constitute financial advice. Trading involves risk, and you should perform your own research and consider your risk tolerance before making any trading decisions.
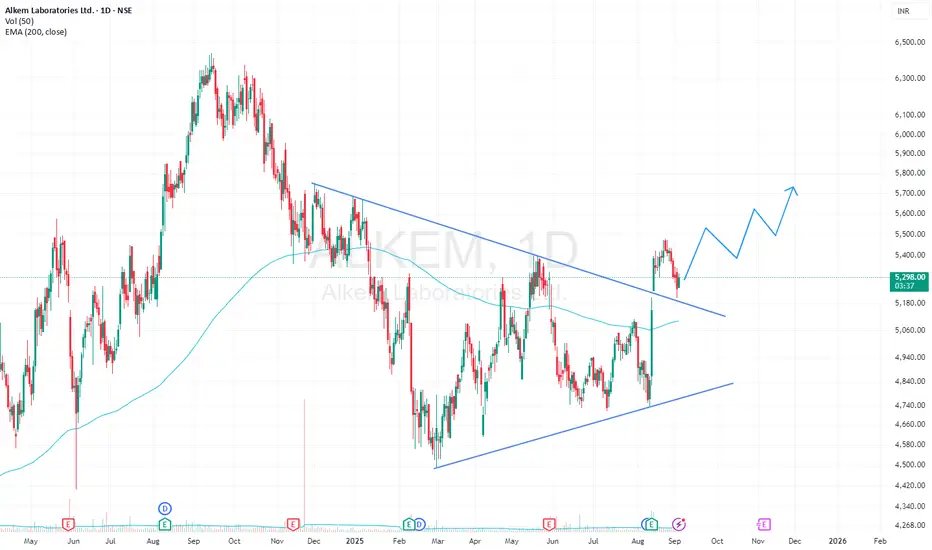
ALKEM Triangle BreakOutAlkem labs has given a breakout from Triangle pattern on 1D timeframe with high volumes. It is apparently retesting the resistance trendline. The stock is also trading above its 200 EMA.
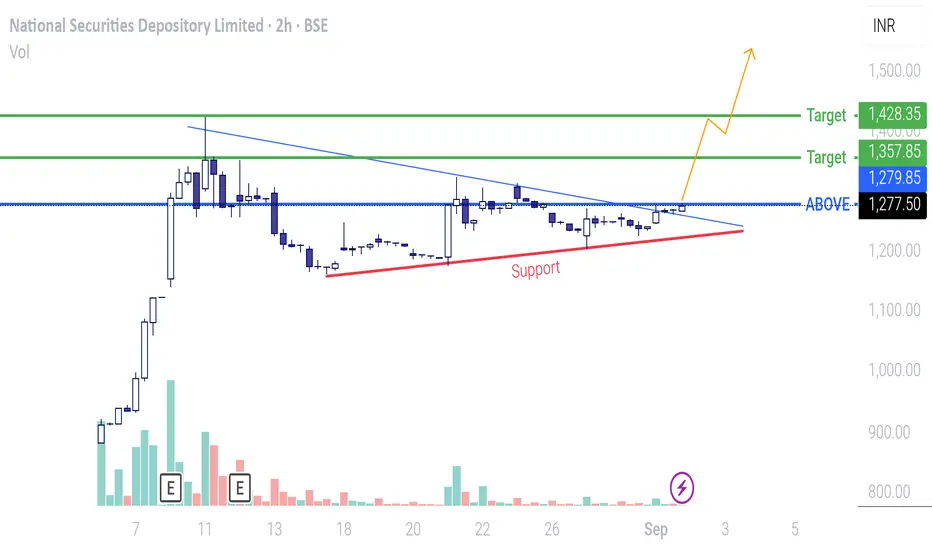
NSDL - TriangleAfter the initial IPO rally, it was time for some consolidation. Now that the triangle has been formed a break out is around the corner.
This is purely a swing trade. Kindly be noted that the valuation of the stock is on the higher side.
TSLATSLA
CMP: $340
After nearly 4.6 years of sideways consolidation , TSLA has broken out and looks positioned to enter a new trading zone.
Support Zone : $300–336
Supply Zone (near-term resistance) : $385–428
With a 3-year perspective , the setup indicates potential for ~60% upside .
Stop Loss : $280 (to manage risk on this early entry).
The recent weekly triangle breakout supports the bullish view, though this remains an early and relatively risky entry with a tight stop strategy.

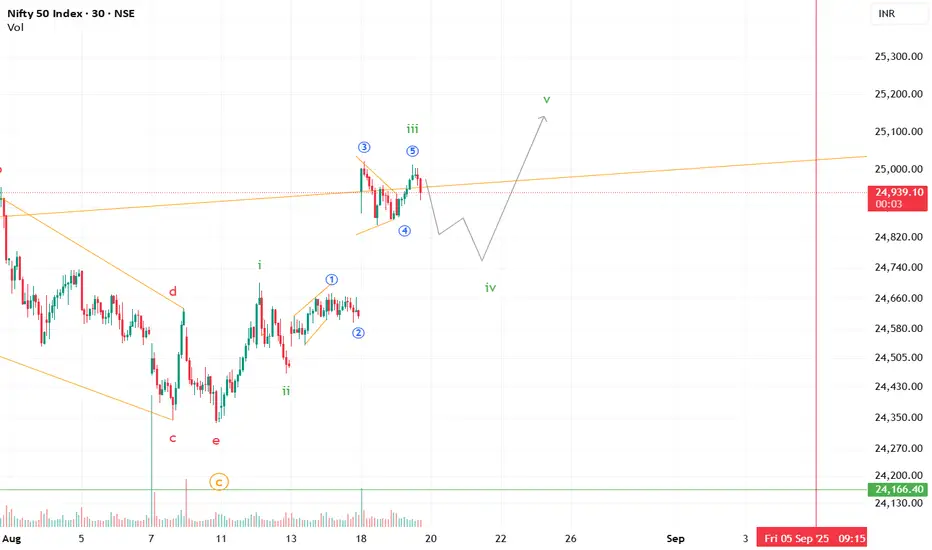
Nifty Entering Wave iv Pause Before Final Wave v Push?The current Wave structure indicates that Nifty has likely completed Wave iii, and is now expected to correct lower in Wave iv. This consolidation could provide a base before a final Wave v breakout toward new short-term highs.
**This is an educational market outlook, not investment advice. Please consult a SEBI-registered advisor before taking any investment decisions.**
ROHLTD Triangle BreakOut 1DRoyal Orchid Hotels has given a breakout from triangle pattern on 1D timeframe. It has given a breakout with high volumes. It is currently trying to retest its breakout resistance.
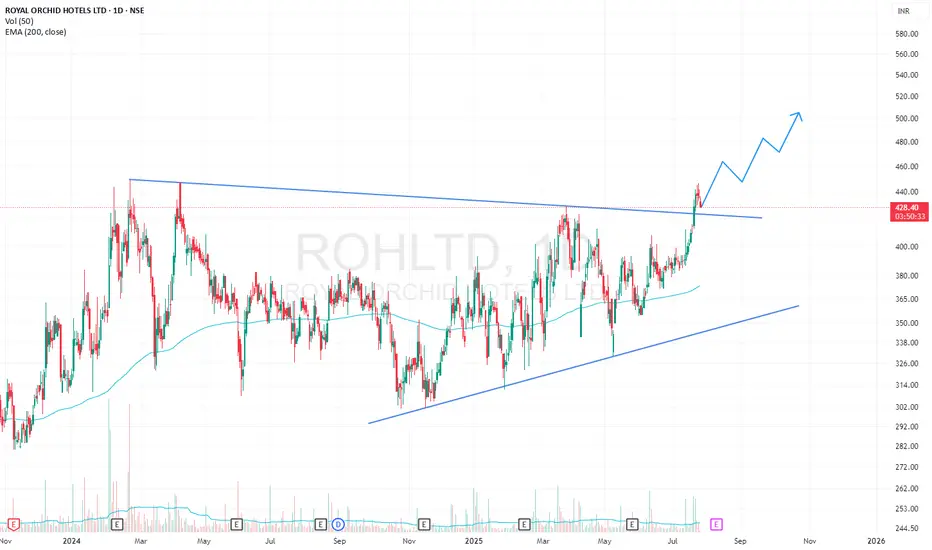
Chart Study for CoalIndiaChart Pattern
Ascending Triangle Formation:
The price is forming higher lows, indicating buyer strength.
Resistance is near the ₹412–₹414 zone, with multiple rejections in this region.
A breakout above this level could lead to a strong upward move.
Indicators
RSI (Relative Strength Index):
Value: ~57.18 → Neutral to slightly bullish.
No overbought condition yet (over 70 is overbought), so upside room remains.
MACD (Moving Average Convergence Divergence):
Blue MACD line is slightly above the signal line → Bullish crossover.
Histogram is flat to slightly positive.
Wait for confirmed breakout (candle close above resistance with good volume).
Avoid early entries unless using tight risk management.
For Study Only
No positions implied or advised.
Good example of a textbook triangle, RSI-MACD convergence, and pre-breakout structure.
Can be used to learn:
How to draw support/resistance
Use of volume + indicators
Pattern breakout anticipation and validation

Amber Enterprise - Symmetrical Triangle Breakout from a Symmetrical triangle on a weekly chart
Triangle Height : 2100 points
Breakout above 6650 (breakout done)
Target : 8740 (Return 31-32%)
#Medium Term Trade.
Indicators are also showing strength for upside.

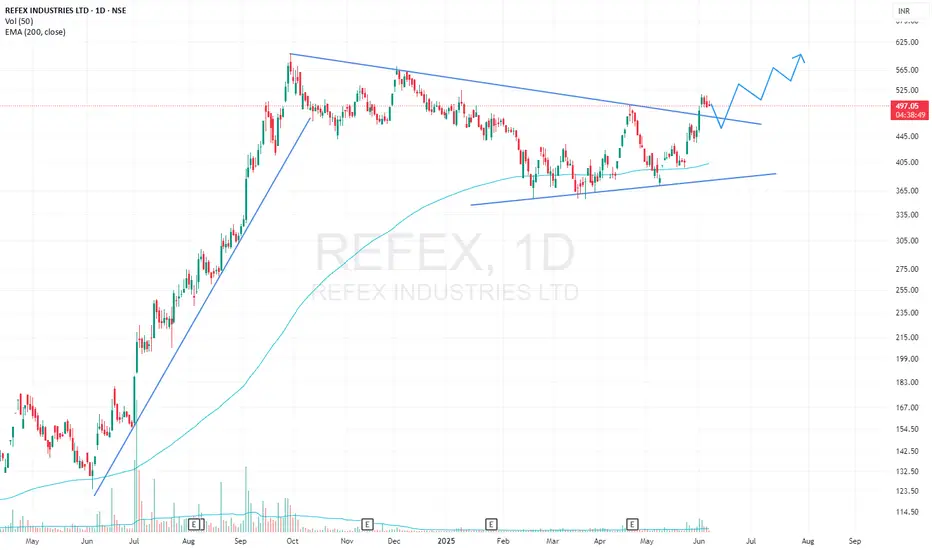
REFEX Triangle & Bull Flag BreakoutREFEX has given a breakout from Symmetrical Triangle and Bull Flag pattern on 1D timeframe with high volumes. Stock has also bounced several times from 200 EMA. Long Position can be initiated with proper risk management.
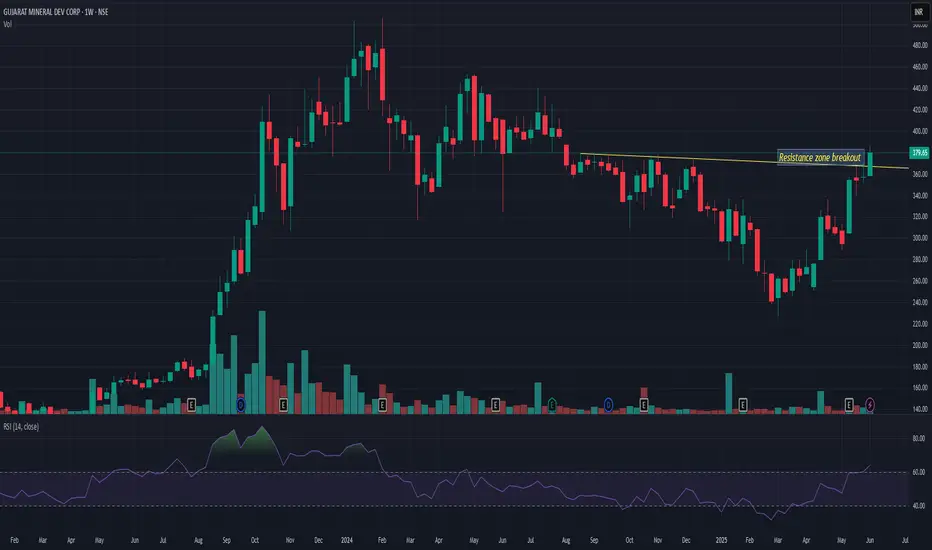
GMDCLTD GMDCLTD seems very strong on weekly charts. Shown strong momentum in recent trading days. And closing above 200 MA since last 5-7 sessions. Now if it closes above 385 then again it may resume its uptrend and may go up to 460 levels from here. 350 is very strong support. So closing below this may change my view
AKUMSAKUMS seems stronger and given triangle breakout. Volume is also very decent as its just 1st hour of trading and almost nr previous day volume. We may see momentum rally nearing 12-15% from here as long as its closing above this trendline it may continue to outperform. Risk reward is quite good. Result is on 26th may. Keep it on radar

Maruti: Bullish triangle breakoutA clean triangle breakout for MARUTI. The upside target is 13620, and the stop is below the upper triangle line.
The entry validates once it gives a breakout and tests the upper line in the lower timeframe, not less than 4 hours.
RSI also has space for this price to meet the projected level.

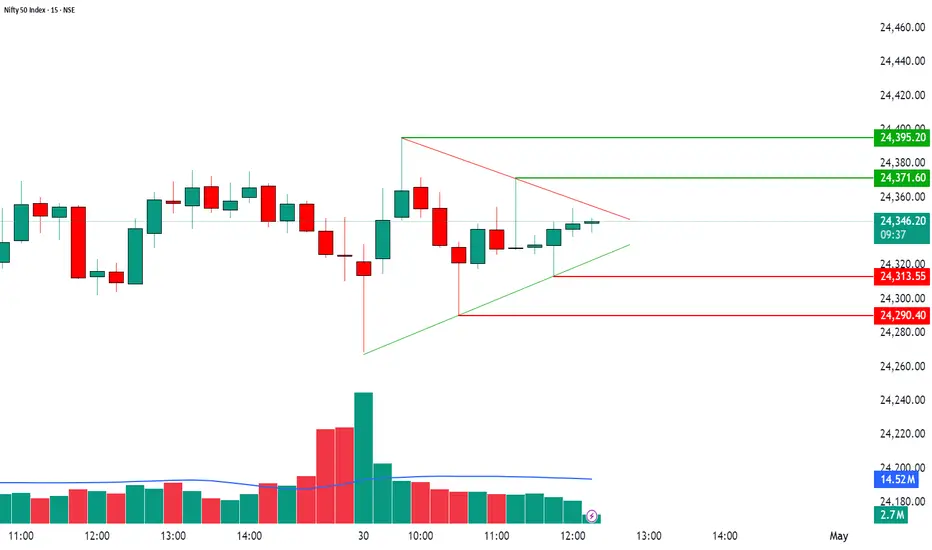
Setup – Watch This Triangle Breakout! 🔺 Nifty50 Triangle Breakout – Big Move Loading? 📊
📆 30th April | 15-Minute Chart
Nifty is tightly squeezed inside a symmetrical triangle, and a breakout or breakdown looks imminent!
🔍 Levels to Watch:
📈 Breakout Above: 24,371.60 → Possible Level: 24,395.20+
📉 Breakdown Below: 24,313.55 → Possible Level: 24,290.40-
📊 Volume is compressing – this usually signals a powerful move ahead.
Wait for clear candle confirmation with volume before entering. 🔔
💬 Patience pays. Trade the breakout, not the noise!
Let's talk about Patience !!This stock on the chart just looks flawless but in reality, it is a stock that will test your patience to at least get 50% returns. Price action wise it shows a very promising setup, in 2021 coming out of a 10 year consolidation and again consolidating for over 3.5 years. It has 50 MA support on monthly and currently looks good for a good returns.
CMP: 9.50
Target 1: 15
Target 2: 20+
Time frame: 0-2 years
Disclaimer: Trade at your own risk

HINDOILEXP - Triangle Breakout A short triangle pattern has been forming since October 2024, and today it broke out decisively with a strong bullish engulfing candle on the daily timeframe. Additionally, a morning star candlestick pattern is evident on the weekly timeframe, reinforcing the bullish outlook.
