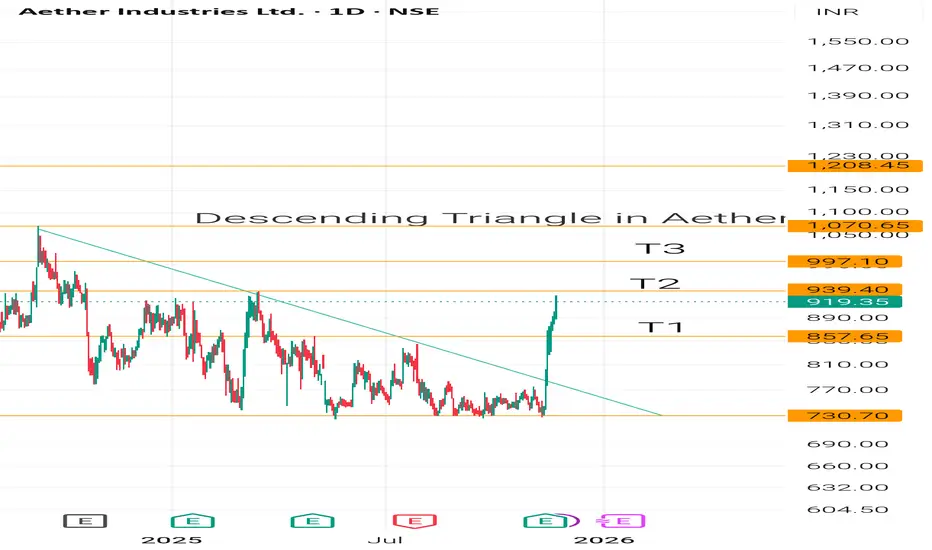
Descending Triangle Breakout Can't believe I missed this trade. I had been tracking this stock since August and the mokent I let it slip through my eyes it blasted off 🚀
Trianglebreaout
Silver Triangle BreakoutSilver is attempting breakout forming a ascending triangle pattern on 1h and 4h timeframe. It is also trading above 200ema.

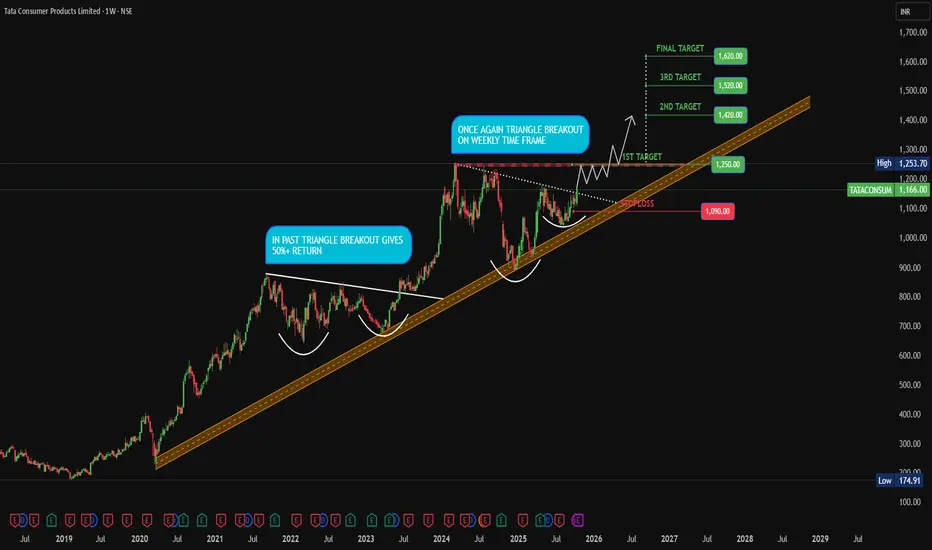
BUY TATA CONS HISTORICAL BREAKOUT in past TATA CONS stock make same triangle structure and gives a breakout than consolidated for 6 to 7 week for accumulation and than gives 52%++ return in a year. Last week its gives same breakout with strong support and good to consider for long term with good risk return. Do your own study and research before entering any position. No guarantee return.
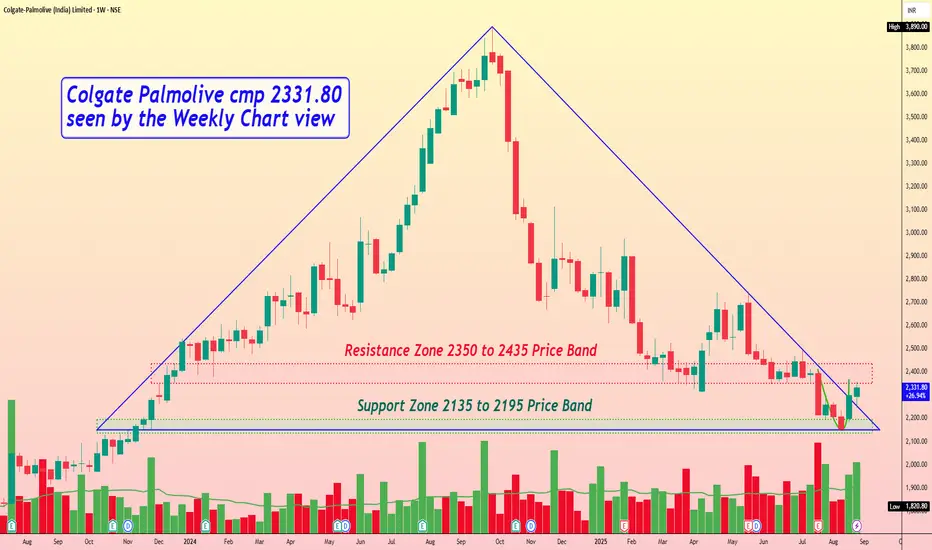
Colgate Palmolive cmp 2331.80 by Weekly Chart viewColgate Palmolive cmp 2331.80 by Weekly Chart view
- Support Zone 2135 to 2195 Price Band
- Resistance Zone 2350 to 2435 Price Band
- Triangle Breakout attempted by current stock chart technical setup
- Support Zone has been under testing retesting phase for the Support Zone
- Bullish Rounding Bottom on Weekly Chart and close Cup & Handle on Daily Chart
- Volumes are seen well in sync with the average quantity traded over the past few weeks
HERO MOTOCORP LTD – TECHNICAL ANALYSIS________________________________________
📈 HERO MOTOCORP LTD – TECHNICAL ANALYSIS
📆 Date: July 15, 2025 | ⏱ Timeframe: Daily Chart
🔍 Educational Breakdown – For Learning & Study Use Only
________________________________________
🔹 Price Action Zones
• 🔴 Top Range (Supply Zone / Resistance): ₹4,486.70
• 🟢 Bottom Range (Demand Zone / Support): ₹4,158.10
Price has recently broken out from a symmetrical triangle pattern, heading toward the marked supply zone. The demand zone at ₹4,158 has been tested multiple times and held firm, acting as the base for this breakout.
________________________________________
🔹 Chart Pattern: ✅
The stock formed a tight triangle consolidation, compressing between a rising support and horizontal resistance. Today’s breakout candle, backed by volume, confirms a bullish resolution of the pattern.
________________________________________
🔹 Reversal Candlestick Patterns
A large bullish engulfing candle has cleared recent highs with strength. Closing near the high, it signals conviction and opens the path for a continued up-move.
________________________________________
🔹 Technical Indicators
• RSI: Crossed above 60 — strength building
• MACD: Positive crossover confirming trend reversal
• VWAP: Price comfortably trading above — supports trend
• Bollinger Bands: Post-squeeze breakout with wide expansion
• Volume: Breakout supported by 20-day volume high — adds strong confirmation
________________________________________
📌 What’s Catching Our Eye:
The volume spike is significant — over 1.76M with breakout from both triangle resistance and VWAP. Add to that a BB Squeeze release, and the setup gets stronger technically.
________________________________________
👀 What We’re Watching For:
If price sustains above ₹4,454, it may move into the next resistance cluster: ₹4,525.97 → ₹4,599.93 → ₹4,730.87. On dips, ₹4,188 and ₹4,158 become important demand zones to monitor for re-entries.
________________________________________
⚠️ Risks to Watch:
A failed follow-up tomorrow or close below ₹4,405 could invalidate the momentum. Also, overbought conditions without volume expansion may lead to a false breakout near ₹4,486.
________________________________________
🔮 What to Expect Next:
If bullish momentum sustains, the stock may first target ₹4,599 and then ₹4,695. Resistance is expected near ₹4,525–₹4,599 range. A clean breakout above ₹4,486 could invite strong follow-up buying.
________________________________________
📊 Trade Plan (Based on Reason and Charts)
🔼 Bullish Trade Setup:
Entry Zone: ₹4,454 – ₹4,465
Stop-loss: ₹4,405.63
Risk–Reward: ~1:1 to 1:2
Reason: Triangle breakout + BB Squeeze + RSI/MACD confirmation + VWAP support
🔽 Bearish Trade Setup:
Only if the price rejects ₹4,486.7 and breaks below ₹4,405:
Entry: Below ₹4,405
SL: ₹4,465
Risk–Reward: ~1:1 to 1:2
Reason: Failed breakout + supply pressure at top range
________________________________________
⚠️ Disclaimer (Please Read):
• This chart is shared for educational purposes only and is not investment advice.
• I am not a SEBI-registered advisor.
• The information provided here is based on personal market observation.
• No buy/sell recommendations are being made.
• Please do your own research or consult a registered financial advisor before making any trading decisions.
• Trading involves risk. Always use proper risk management.
STWP is not responsible for trading decisions based on this post.
________________________________________
💬 Found this helpful?
Drop your thoughts or questions in the comments below ⬇️
🔁 Share this post with your trading community – let them benefit from clean charts, structured setups, and zone-based learning.
✅ Follow @simpletradewithpatience for chart-backed technical analysis that respects price action, demand & supply.
🚀 Trade with patience, trust your charts, and stay clear-headed!
Be Self-Reliant | Trade with Patience | Learn with Charts & Zones 📊
________________________________________

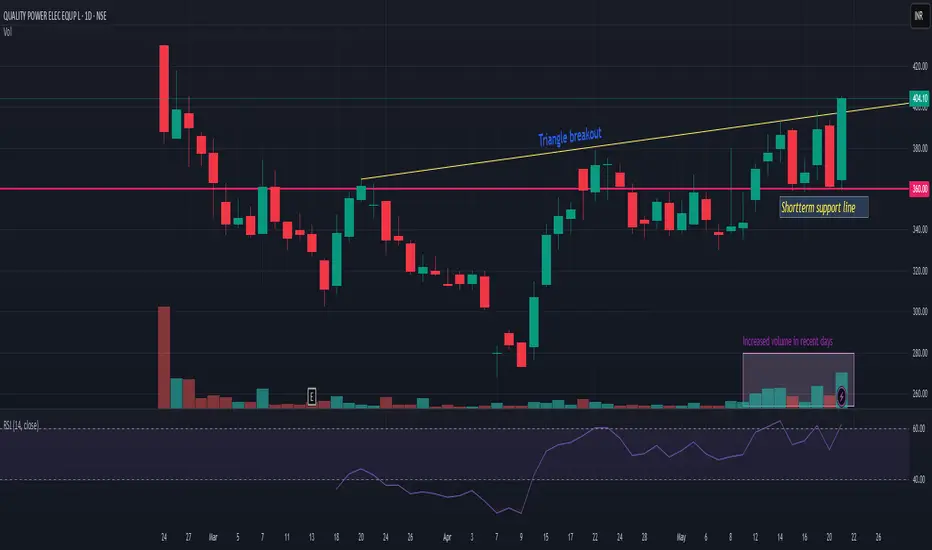
QPOWERQPOWER is recently listed IPO stock and now it has given triangle breakout with decent volume. 355-60 is very strong support. Closing below this may change my view. Upper side we may see momentum till 470-510. Risk reward is quite favorable. Another thing which i observed is today it is trading at all time high volume after listing day. So probability of holding and continuing momentum is quite high. keep it on radar.
ALIVUS - Breakout in Daily timeframeALIVUS (Alivus Life Sciences Limited, formerly Glenmark Life Sciences) - Breakout
Breakout observed in daily timeframe of Alivus, the company has a very good chart pattern and is in a good uptrend and recently broke out with good volumes. The breakout has also been retested and sustained. There could be a good upside in this stock. The company also has good fundamentals as written below.
Fundamentals.
MCap 14,299Cr
Stock P/E 32.4
Industry P/E 31.6
ROCE 28.1%
ROE 21.1%
NPM 20.6%
PEG Ratio 1.69
Debt 16Cr
Reserves 2,514Cr
EPS 36.05
Promoter holding 75%
API contribution 9MFY24
Chronic : 69%
Acute : 31%
Key Therapeutic areas contribution 9MFY24
Diabetes : 4%
CVS : 41%
CNS : 17%
Pain Management : 6%
Others : 32%
Business segments
The company has two key segments - Generics and Complex APIs (92% of FY23 revenue) and Contract Development and Manufacturing Operations (CDMO) (8% of FY23 revenue)

GOLD Triangle BreakoutGold has given a breakout from Triangle Pattern on 1D timeframe. It had been consolidating since November 2024.

A triangle breakout in MapmyindiaNSE:MAPMYINDIA Triangle breakout is about to happen after being in consolidation for 170 days.
A target of 2300-2600 can be achieved with the SL of the recent swing of 1970.

BOB | Trendline Bull Breakout ⭕️ Swing Trading opportunity: Price Action Analysis Alert !!!⭕️
💡✍️Technical Reasons to trade or Strategy applied :-
✅Triangle Chart Pattern Bull Breakout
✅Breakout confirmed
✅Rise in Volume
✅Good 3 touches Trendline Breakout with volume
✅Clear uptrend with HH & HLs sequence
✅ Order block as potential Target
✅Check out my TradingView profile to see how we analyze charts and execute trades.
🙋♀️🙋♂️If you have any questions about this stock, feel free to reach out to me.
📍📌Thank you for exploring our idea! We hope you found it valuable.
🙏FLLOW for more !
👍LIKE if useful !
✍️COMMENT Below your view !

JYOTIRES - Breakout with good volume JYOTIRES - Breakout in daily timeframe observed after one year. The stock has consolidated for a few weeks before a huge-volume breakout.
The company has FANTASTIC fundamentals and great growth potential. There is a good upside in this stock, both in the short-team (catch momentum) and in the long-term (strong growth potential).
Please do your own research before making a buying decision. These are my personal views.

VENKEYS Triangle BreakoutVenkeys has given a breakout from triangle pattern on 1D timeframe with strong volumes. It has broken its 2 year old resistance. It is apparently retesting its resistance.

AVANTIFEED - 6.5 Yeas Downtrend Breakout Avanti Feeds Ltd
1) Time Frame - Weekly.
2) The Stock has been in a Downtrend since (November, 2017). Now It has given a Downtrend breakout & Closed with good volume & good bullish momentum candle in weekly Time Frame.
3) The next resistance would be around the price (770 - 25.10% from the price 615.40). Followed by this, The stock may reach it's Previous Life Time High (980) in the long term.
5) Recommendation - Strong Buy

SJVN Analysis for Long Term!NSE:SJVN Analysis!
SJVN Analysis on a Daily Timeframe!
Triangle Pattern formation in SJVN!
Triangle Pattern Breakout in SJVN!
Analysis:
SJVN was trading in a Triangle pattern. Yesterday it gave a powerful breakout to its resistance line with significant amount of volume. Also consider the 20, 50, 100 period EMA as these are also acting as a Support and Resistance as the price is respecting them it is moving ahead with them. Rest of the Analysis is on the chart itself please study it thoroughly.
Trade Setup:
Entry = Current price level is good to Enter but always enter 0.50rs above the previous day high.
Target = 226.64
Stop Loss = Below 136.11 or as per your Risk to Reward
Disclaimer = Consider my analysis for Educational Purpose only.
Before entering into any trade -
1) Educate Yourself
2) Do your research and analysis
3) Define your Risk to Reward ratio
4) Don't trade with full capital

GTPL - Symmetrical Triangle Breakout with Retest - Bullish LongGTPL Hathway Ltd. (NSE: GTPL) has recently broken out of a symmetrical triangle pattern on the daily chart. The breakout has been followed by a successful retest, indicating a strong bullish signal.
A Symmetrical Triangle Breakout would indicate a continuation of prior trend, which is bullish in the long-term, as shown by the Monthly Chart below.
I have also given a possible long-term channel for GTPL. The support at the bottom of the channel has been tested multiple times, as shown. We'll have to see if the top also holds but that is a long time away.
On the Monthly time-frame, the RSI is also on an upward trajectory, as shown.
Please comment with your views on the set-up.
Disclaimer: This analysis is for educational purposes and should not be considered financial advice. Always conduct your own research before making any investment decisions.

COAL INDIA SWING TRADE | TRIANGLE BREKAOUTCOAL INDIA SWING TRADE | TRIANGLE BREKAOUT
Hi Traders,
This is Coal india Daily TF chart Triangle breakout .
Strong Buying will happen in upcoming session.
Note - Only for education purpose

Amar Raja Energy & Mob Ltd Analysis!NSE:ARE_M Daily Analysis!
Symmetrical Triangle Pattern formed in $NSE:ARE_M!
Symmetrical Triangle Pattern breakout in $NSE:ARE_M!
RSI Bounced Back from 50 Level
NSE:ARE_M formed a Symmetrical Triangle Pattern on the Daily time-frame. The stock is being in the uptrend by taking support on 50EMA. We can clearly see the breakout to the resistance trend-line with sufficient volume. RSI also bounced back from 50 Level. We can ride the rally with strict stop loss. Last candle has given a breakout we can enter either in the upcoming trading session or after retest. The important levels are on the chart itself, please have a look on it.
Trade Psychology and Setup:
Entry = Current price level is good to enter(865-870)
Target = 1052.15
Stop Loss = 809.90
Disclaimer = All my analysis is for Educational Purposes only.
Before entering into any trade -
1) Educate Yourself
2) Do your research and analysis
3) Define your Risk to Reward ratio
4) Don't trade with full capital

IOB Triangle Breakout | Swing TradeIOB Triangle Breakout still looking good
Note - Only for education Purpose

HINDPETRO Analysis(Symmetric Triangle)!Two methods to project the Targets while trading based on SYMMETRIC TRIANGLE PATTERN
HINDPETRO Analysis on Weekly Timeframe!
Symmetric Triangle formation in HINDPETRO on Weekly Timeframe
Symmetric Triangle Resistance Trendline Breakout
HINDPETRO has made symmetric Triangle pattern on Weekly Timeframe. HINDPETRO is forming Symmetric Triangle Pattern about 6 months. The price has given resistance trendline breakout with low volume which is a negative point but is has made successfully closed above it. On the chart I have illustrated, how to project targets based on SYMMETRIC TRIANGLE PATTERN in two ways. You can follow any method while dealing with Symmetric Triangle Pattern. Both ways are valid. I have referred John J Murphy's TECHNICAL ANALYSIS OF THE FINANCIAL MARKETS book for this Analysis. I hope you'll like it. One more important thing do Follow and share my ideas for support so I can post more and more ideas on daily basis.
Trade Psychology and Setup =
Entry = Aggressive Investors can enter at current levels, Conservative Investors can enter after retest between 239.80 - 243.15
Target = 505.30
Stop Loss = Below 220.10
Disclaimer = All my analysis are for Educational Purpose only. Before entering into any trade - 1) Educate Yourself 2) Do your own research and analysis 3) Define your Risk to Reward ratio 4)Don't trade with full capital

GABRIEL - Breakout in Daily timeframeGABRIEL - Breakout in the daily timeframe. The stock is in an uptrend in the higher timeframe and has taken a small dip, with this breakout - it looks like the uptrend is going to continue.
Fundamentally the company has strong numbers.

Dhani : Breakout Candidate#Dhani #Breakout #Trianglepattern #patterntrading #patternbreakout #momentumtrade
Dhani : Weekly (1-3 Months)
>> Momentum Trade
>> Breakout Soon
>> Triangle Pattern
>> Good Strength & Volume Build up
>> Low Risk High Reward Trade
I believe it can move towards 100 Ema (60 Levels)
Swing Traders Can lock thier profits at 10% and keep trailing
Disclaimer : Charts Shared are for Learning Purpose & not a Trade Recommendation. Consult your Financial Advisor before taking position in it.
DLong

#TTKPRESTIG Strong Buy Short Term Investment#Stock is in #Consolidation stage for a long time, and it made a very tight zone and now making HigherHigh.
Stock is making a #Triangle #Pattern and waiting for a Breakout.
Maintain Proper SL and Enter a trade for a short to long term investment.

HFCL (weekly) : Breakout Stock#Breakoutstock #stocktobuy #stocktotrade #stockinfocus
#HFCL (1-3 months) : Momentum Stock
>> Long Consolidation Triangle pattern Breakout
>> VCP Visible in Triangle pattern
>> Good Strength & Volume Breakout
Swing Traders can lock 10% profit & keep trailing
Please Like or comment if u r Liking the analysis & Learning from it. Keep showing ur Love
Disclaimer : This is not a Trade Recommendations & Charts/ stocks Mentioned are for Learning/Educational Purpose. Do your Own Analysis before Taking positions.
