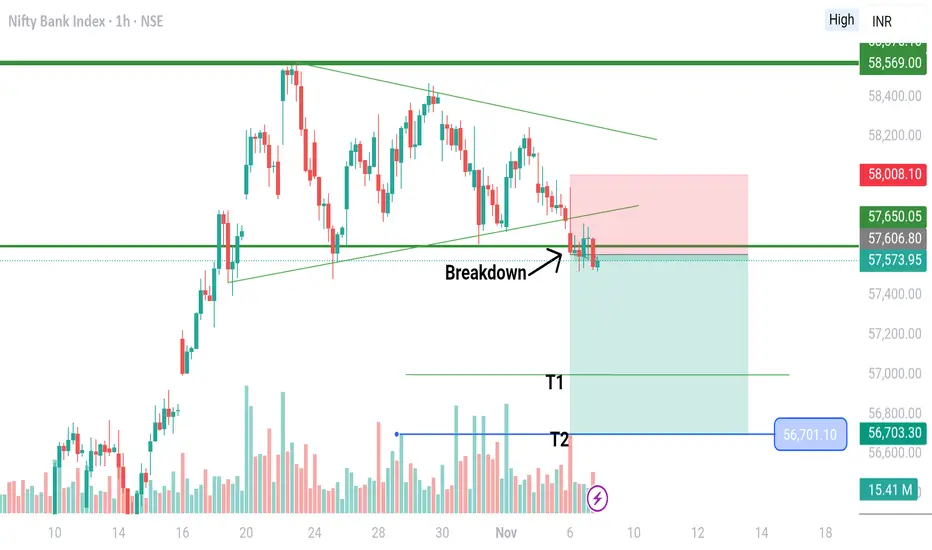
Breakdown of Triangle Pattern in BankniftyBanknifty has given breakdown out of the Triangle Pattern in 1 HR time frame.
Also, the Market seems to continue the sell on rise strategy.
Any retracement towards upside should be utilised in more selling.
SL should be put on sustaining basis rather than price just touch SL and come down rapidly (If happens).
Entry and Target are mentioned in the chart.
Also, Nifty and Sensex have already made classic M pattern supporting banknifty to go down. Same has already been discussed in my YouTube Video published on my channel "SMARTSTOCKINSIGHT" on 4th November.
Feel free to discuss any doubt in comment section.
Note: This analysis is for Educational Purpose Only. Please invest after consulting a professional financial advisor.
Trianglepatternbreakout
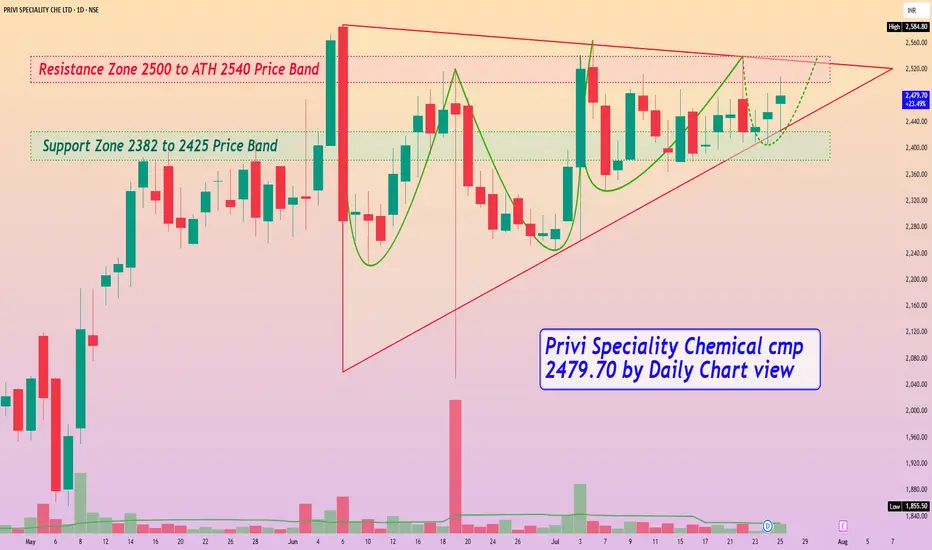
Privi Speciality Chemical cmp 2479.70 by Daily Chart viewPrivi Speciality Chemical cmp 2479.70 by Daily Chart view [/ b]
- Support Zone 2382 to 2425 Price Band
- Resistance Zone 2500 to ATH 2540 Price Band
- Ascending Triangle pattern Breakout in the making process
- Very considerate VCP pattern seems formed on the stock chart
- Volumes seen getting in close sync with the average traded quantity
triangle breakout Borosil Renewables has given a breakout through a falling trendline and also triangle.
the breakout is with good volume. we can see short term and long term momentum is good in the stock and buyers interest can be seen rising. With the R:R of 1:3 the trade seems good.

RECLTD - Breakout The price has been consolidating since September 2024 on the daily timeframe and has broken out of a short triangle pattern today. However, the stock faces resistance just above the breakout, highlighted by the yellow line.

SHILPA MEDICARE : Breakout Candidate - Swing Pick#SHILPAMED #breakout #chartpattern #vcppattern #trianglepattern #continuationpattern
SHILPAMED : Swing Trade
>> VCP pattern Visible
>> Ascending Triangle Pattern which is a Continuation pattern
>> Trending Setup
>> Good Strength & Volumes
>> Low Risk High Reward Trade
Swing Traders can lock profit @ 10% and keep trailing
Note : In the Current market scenario, Setup's can fail easily so Trade only best Setups with Good Risk Management and proper Position Sizing
Disclaimer : This is not a Trade Recommendation, Charts shared are for Learning Purpose. Do not take Positions without consulting ur Financial Advisor

SKP = Breakout but Low Volume StockPrice consolidate since August 2023 and it breakout the triangle today with good percentage. Only draw back is it is low volume stock and there is possibility for cicuit.

OCCL - Breakout and Retracement Stock price consolidates since 2016 and formed Symmetrical Triangle formation. Price breakout on July 2024 and rises (60%) which fall back near to breakout price range.
Now, price might come to 225 range or bounce back to All time High.
OLong

Triangle breakoutThe stock has made a Triangle pattern breakout and has been consolidating since 2 months. Buy at 720-750 levels for a Target of 925

SJVN Analysis for Long Term!NSE:SJVN Analysis!
SJVN Analysis on a Daily Timeframe!
Triangle Pattern formation in SJVN!
Triangle Pattern Breakout in SJVN!
Analysis:
SJVN was trading in a Triangle pattern. Yesterday it gave a powerful breakout to its resistance line with significant amount of volume. Also consider the 20, 50, 100 period EMA as these are also acting as a Support and Resistance as the price is respecting them it is moving ahead with them. Rest of the Analysis is on the chart itself please study it thoroughly.
Trade Setup:
Entry = Current price level is good to Enter but always enter 0.50rs above the previous day high.
Target = 226.64
Stop Loss = Below 136.11 or as per your Risk to Reward
Disclaimer = Consider my analysis for Educational Purpose only.
Before entering into any trade -
1) Educate Yourself
2) Do your research and analysis
3) Define your Risk to Reward ratio
4) Don't trade with full capital

Bullish Triangle Pattern Breakout seen in Garments mfg. stockHello Everyone, i hope you all be doing good. I have brought a stock which has given bullish triangle pattern breakout. Stock name is Cantabil Retail India Ltd and it was incorporated in 1989 and started its readymade garments manufacturing and retailing business in the year 2000.
Product Portfolio & Revenue Split 9MFY24
Men’s Wear (83%) - Formals, Casuals, Ultra Casuals, Woollen, Knitwear
Women’s Wear (10%) - Shirts, Tops, Leggings, Kurtas, Kurtis, Capri, Pants, Jeans
Kids Wear (3%) - Shirts, T-shirts, denim, trousers, Culottes, dresses, tops, jeggings, shorts
Accessories (4%) - Innerwear, Belts, Socks, Ties, Handkerchief, Deo, etc.
Technically stock has given neat and clean breakout of bullish Triangle pattern,
Indicators like MACD & RSI started giving bullish crossover on chart.
Price is above 200-DEMA.
NOTE:- (I have not placed any indicators on chart just to keep chart neat and clean, but certainly i have done my analysis with indicators)
Market Cap
₹ 2,450 Cr.
Current Price
₹ 293
High / Low
₹ 310 / 181
Stock P/E
40.1
Book Value
₹ 39.0
Dividend Yield
0.31 %
ROCE
18.0 %
ROE
22.3 %
Face Value
₹ 2.00
Industry PE
31.3
Debt
₹ 336 Cr.
EPS
₹ 7.44
Promoter holding
74.1 %
Intrinsic Value
₹ 131
Pledged percentage
0.00 %
EVEBITDA
16.4
Change in Prom Hold
0.81 %
Profit Var 5Yrs
37.4 %
Sales growth 5Years
16.4 %
Return over 5years
44.2 %
Debt to equity
1.03
Net profit
₹ 62.2 Cr.
ROE 5Yr
22.8 %
Profit growth
-9.09 %
Earnings yield
3.82 %
Disclaimer:- Please always do your own analysis or consult with your financial advisor before taking any kind of trades.
Dear traders, If you like my work then do not forget to hit like and follow me, and guy's let me know what do you think about this idea in comment box, i would be love to reply all of you guy's.
Thankyou.

Triangle pattern breakout seen in HBL POWER stock will blast nowHello everyone, i hope you all will be doing good. i have brought a stock which has given breakout of Triangle pattern. Stock name is HBL Power System Ltd and it manufactures and services different types of batteries, e-mobility, and other products.
Business Verticals:-
a) Electronics:
In Railway Electronics company has flagship products, TCAS (Train Collison Avoidance System) for safety and TMS (Train Management System) for efficient track utilization. In 2021, Indian government adopted TCAS as India’s national Automatic Train Protection and named it KAVACH.
b) Defense:
Company manufactures batteries for fighter aircraft, unmanned aerial vehicles, submarine propulsion systems, torpedoes, battle tanks, missiles, artillery fuses and supplies Type 1 batteries for kilo class submarines and Varunasthra torpedo and Type 4 batteries for Scorpene class submarines for the Indian Navy.
c) Batteries:
Company provides industrial batteries to Telecom, UPS, Railways, Solar, Oil and Gas and Power sectors.
Lead Acid Batteries -
Indian Army awarded a defense order in FY22 for 2V VRLA batteries for its Data Center application. Additionally, it received orders from OEs and EPCs for NCPP and VRLA batteries for a number of Metro Rail projects. Company gained traction in Africa with export of 12V UPS batteries and concentrated on commercial exports and provided batteries for other international projects.
Tubular Gel Batteries -
HBL received a purchase order for 312 communities' electrification using tubular gel batteries under a government initiative.
Pure Lead Thin Plate Batteries -
Company is a partner to STTelemedia for the supply of PLT batteries for existing and upcoming Data Centres. It also bagged an order from COLT, Data Centre for PLT batteries and positioned PLT as preferred batteries for Data Centres at Reliance. The Company has supplied PLT batteries for battle tank engine cranking application to the Indian Army
Market Cap
₹ 17,408 Cr.
Current Price
₹ 628
High / Low
₹ 628 / 165
Stock P/E
57.9
Book Value
₹ 44.0
Dividend Yield
0.08 %
ROCE
34.4 %
ROE
27.7 %
Face Value
₹ 1.00
Industry PE
37.0
Debt
₹ 67.5 Cr.
EPS
₹ 10.1
Promoter holding
59.1 %
Intrinsic Value
₹ 114
Pledged percentage
0.00 %
EVEBITDA
39.1
Change in Prom Hold
0.00 %
Profit Var 5Yrs
66.1 %
Sales growth 5Years
12.0 %
Return over 5years
90.4 %
Debt to equity
0.06
Net profit
₹ 280 Cr.
ROE 5Yr
12.0 %
Profit growth
209 %
Earnings yield
2.55 %
Disclaimer:- Please always do your own analysis or consult with your financial advisor before taking any kind of trades.
Dear traders, If you like my work then do not forget to hit like and follow me, and guy's let me know what do you think about this idea in comment box, i would be love to reply all of you guy's.
Thankyou.

Are you ready to get 2332% Return if yes please Read descriptionHello Everyone, i hope you all will be doing good in your trading and your life as well, i know you guy's have to read about this stock which can give 2332% returns. So i am talking about welspun corp stock which has given breakout and retested the breakout zone on monthly time frame. Well i have written many things on chart about these, but still i will explain about this stock here too, but for the levels you have to go through chart above.
1st of all stock has given huge breakout after almost 16 years, and stock is sustaining above to this breakdown zone, All major indicators like, MACD AND RSI showing bullish crossover, price is above 200=DEMA, everything looks positive about this stock. So this is the best time to enter and hold for long term, now come about returns which i have mention on title, how will you get this much of returns in this stock if you invest now, 1st of all if you check major pattern on monthly chart, it is kind of triangle pattern right, in tringle pattern we always expect whatever inside higher length size will be we will expect that target for next move after breakout of triangle pattern. So if you check i have measure same length and i found stock has rallied 2332% in between, so i am expecting same. See guy's in longer term company always take some corporate action like, bonus and split so we might can see price differentiation on chart, but to calculate exact returns, you have to measure from today's date when i am publishing this post.
i hope this have been clear, one thing i have written on chart as well, i am just going to do copying and paste here as well just read this is very important:-
((Friends, if you check inside the monthly chart analysis, you will see that many types of chart patterns were formed, many trendlines and supports were found breakout or breakdowns which occurred many times, but now in the long term the stock has given all time high breakout. which Formed in 2008, my point here to tell you all this is that if you think for long term you will never care about these noises, so if the company is good we should always find opportunity to invest and whenever we have any type correction in stock, we should take as another opportunity to add more at down levels. i hope i have explain clearly about long term investing method.))
i think this is one of the best idea or method to get best appreciation in returns in long term on your stock. So i am expecting you guy's have learned these unique techniques in investing world. if you think i have really teach you something best then do not forget to hit like on this post.
NOW LET'S READ ABOUT THE COMPANY AND IT'S FUNDAMENTAL:-
WCL is one of the largest manufacturers of large diameter pipes globally. The company also manufactures BIS-certified Steel Billets, TMT (Thermo-Mechanically Treated)
Rebars, Ductile Iron (DI) Pipes, Stainless Steel Pipes, and Tubes & Bars. The company acquired Sintex-BAPL, a market leader in water tanks and other plastic products, to expand its building materials portfolio. It has also made strategic acquisition of specified assets of ABG Shipyard.
Growth Strategy:-
The Company has been undergoing a transformation journey since past couple of
years by diversifying into related businesses that have good future growth potential. Setting up of DI Pipes facility in Anjar, Gujarat and acquisition of Sintex BAPL are a part of that strategy.
Product Portfolio:-
The product portfolio of the company comprises HSAW Pipes (Helically Welded), LSAW Pipes (Longitudinally Welded), and ERW Pipes (Electric Resistance Welded) for Onshore/Offshore Oil, Gas, and Water Transmission it also provides Coating System for anti-corrosion and Value-added Service like Double Jointing, Pipe Bending, ID Machining, etc.
In Q3FY24, Sintex finalized its foray in Plastic Pipes segments through different types of PVC Pipes including CPVC, HDPE, UPVC and OPVC.
Growth in Pipes Business:-
DI Pipes sales - 9MFY24 sales volume rose almost 10x YoY to 135 KMT. Stainless Steel Bars sales volume grew by 201% YoY to 12,294 MT while, Pipes & Tubes sales volume rose by 23% YoY to ~3,667 MT during 9MFY24.
DI Pipes in Middle East:-
In Feb,24, company is planning to set up a 150 KMTPA DI Pipes manufacturing facility in the Middle East with an investment of ~Rs. 500 crore over next 4-6 quarters. The investment will be made through a combination of debt and equity. The plant is expected to commence commercial production by H1CY25.
Market Cap
₹ 17,538 Cr.
Current Price
₹ 669
High / Low
₹ 671 / 300
Stock P/E
15.8
Book Value
₹ 215
Dividend Yield
0.75 %
ROCE
21.6 %
ROE
21.5 %
Face Value
₹ 5.00
Industry PE
19.7
Debt
₹ 1,949 Cr.
EPS
₹ 42.4
Promoter holding
50.1 %
Intrinsic Value
₹ 587
Pledged percentage
0.00 %
EVEBITDA
8.91
Change in Prom Hold
0.18 %
Profit Var 5Yrs
94.2 %
Sales growth 5Years
14.1 %
Return over 5years
37.0 %
Debt to equity
0.35
Net profit
₹ 1,136 Cr.
ROE 5Yr
14.4 %
Profit growth
656 %
Earnings yield
9.33 %
PROS:-
Company has reduced debt.
Company is expected to give good quarter
Company has delivered good profit growth of 94.2% CAGR over last 5 years
Company has been maintaining a healthy dividend payout of 34.9%
CONS:-
Stock is trading at 3.12 times its book value
Company has a low return on equity of 12.2% over last 3 years.
Disclaimer:- Please always do your own analysis or consult with your financial advisor before taking any kind of trades.
Dear traders, If you like my work then do not forget to hit like and follow me, and guy's let me know what do you think about this idea in comment box, i would be love to reply all of you guy's.
Thankyou.

WHIRLPOOLI'm not a SEBI registered analyst, Views are personal, not any buy or sell recommendations.
Today i found WHIRLPOOL ,which has given breakout in Weekly along with good volumes, Based on volume and current price action movement in the WHIRLPPOL chart, I anticipate a short-term upswing. Please refer to the chart for a detailed analysis.

STYLAM INDUSTRIES - Traingle BreakoutPrice is respecting the trendline from June 2023 and it is now breakout the triangle.
2. First target will be 2000
Please like and share if you like this idea.
Chart is Self Explanatory. I am not SEBI registered advisor and all Ideas posted by me are for Educational Purpose.

InfoBeans Technologies Ltd is Ready to fly in Blue skyHello everyone, i have brought a stock which has potential to grow more than 100% from current levels. Yes i am talking about Infobeans Technologies which is primarily engaged in software development services, specializing in business application development for web and mobile and operate at Capability Maturity Model Integration (CMMI) level 3.
Stock has given bullish crossover
Volumes are supporting neckline breakout
price is above 200-DEMA
Market Cap
₹ 1,151 Cr.
Current Price
₹ 472
High / Low
₹ 555 / 362
Stock P/E
51.2
Book Value
₹ 122
Dividend Yield
0.21 %
ROCE
11.7 %
ROE
7.92 %
Face Value
₹ 10.0
Industry PE
31.8
Debt
₹ 24.5 Cr.
EPS
₹ 9.25
Promoter holding
74.2 %
Intrinsic Value
₹ 378
Pledged percentage
0.00 %
EVEBITDA
17.2
Change in Prom Hold
0.00 %
Profit Var 5Yrs
4.05 %
Sales growth 5Years
26.1 %
Return over 5years
48.6 %
Debt to equity
0.08
Net profit
₹ 22.5 Cr.
ROE 5Yr
16.5 %
Profit growth
-37.6 %
Disclaimer:- Please always do your own analysis or consult with your financial advisor before taking any kind of trades.
Dear traders, If you like my work then do not forget to hit like and follow me, and guy's let me know what do you think about this idea in comment box, i would be love to reply all of you guy's.
Thankyou.

Ayurvedic Balm making stock has given Triangle pattern BreakoutHello everyone, i hope you all will be doing good in your life and your trading as well. I have brought a stock which has given breakout of Triangle pattern on weekly time frame, price is sustaining above 50 EMA since 3 weeks, MACD Has also given bullish crossover. There is higher probability we can see upside momentum in near term. Good thing about this stock is this is still trading at discount price, earlier it was trading almost at 50% discount, but recently it has given some upside momentum, still it's on discount around 40%.
About company:- AHCL has been manufacturing ayurvedic balm for pain management since 1893, and is currently managed by the third-generation of promoters. The company is more than 120 years old and is into OTC products in the segments of pain management, women's hygiene, and packaged fruit juice drink.
KEY POINTS
High Market Share in Modern Trade
Amrutanjan has maintained the No. 1 rank in Modern Trade in Head Category with the volume market share of 41.1%* in CY19.
Product Portfolio
The Co. offers a wide range of products in categories like pain management, congestion management, women’s hygiene, beverages, etc.
Revenue Mix FY22
OTC Products - 92%
Beverages - 8%
Geographical Split FY22
Domestic - 98%
Export - 2%
Manufacturing Capabilities
The Co. has 3 manufacturing units: 2 for its OTC products and 1 for beverages. It has a production capacity of 1,600 MT in the OTC manufacturing units. It is in the process of upgrading its beverage plant with state-of-the-art machinery.
Entry into Oral Care Segment
The Co. entered the oral care segment with Stop Pain Dental Gel to offer instant relief from tooth pain and swollen gums.
Launch of Comfy Sanitary Napkins
Amrutanjan entered the women's hygiene segment in FY14, and has scaled it up to a Rs. 50 cr - Rs. 100 Cr business in FY22.
Distribution Network
AHCL’s pain management products are available in ~12 lakh outlets across the country as of Q4 FY22. Comfy’s distribution has reached 3.5 lakh outlets. The Co. has invested in ‘Project M5K’ with the key objective to onboard 5,000 distributors, super stockists, and sub stockists. In FY22, the Company added around 150 super stockists and 1,200 sub-stockists to reach towns/ villages with fewer populations.
Strategic Focus
The Co. continues to focus on expanding distribution, enhancing global footprint, growing its E-Commerce vertical, and controlling costs.
Market Cap
₹ 1,990 Cr.
Current Price
₹ 681
High / Low
₹ 775 / 553
Stock P/E
45.2
Book Value
₹ 89.6
Dividend Yield
0.67 %
ROCE
19.3 %
ROE
14.3 %
Face Value
₹ 1.00
Industry PE
31.9
Debt
₹ 0.66 Cr.
EPS
₹ 15.1
Promoter holding
50.6 %
Intrinsic Value
₹ 337
Pledged percentage
0.00 %
EVEBITDA
30.0
Change in Prom Hold
0.00 %
Profit Var 5Yrs
16.2 %
Sales growth 5Years
11.5 %
Return over 5years
16.4 %
Debt to equity
0.00
Net profit
₹ 44.0 Cr.
ROE 5Yr
21.9 %
Profit growth
5.16 %
Disclaimer:- Please always do your own analysis or consult with your financial advisor before taking any kind of trades.
Dear traders, If you like my work then do not forget to hit like and follow me, and guy's let me know what do you think about this idea in comment box, i would be love to reply all of you guy's.
Thankyou.

Bullish Bottom Triangle - Paisalo Digital LtdA bullish "Bottom Triangle" chart pattern on Paisalo Digital Ltd ( NSE:PAISALO ). This pattern suggests a potential upward movement in the stock price from its current close of 73.45 to a target range of 83.00 - 87.00.
A Bottom Triangle pattern typically forms over a period of uncertainty or consolidation, characterized by two converging trendlines as prices reach lower highs and higher lows.
During this period, trading volume tends to diminish as the price fluctuates within a narrowing range, indicating market indecision. However, before the triangle reaches its apex, the price breaks above the upper trendline with a notable increase in volume, confirming the bullish reversal of the prior downtrend.
This pattern suggests that the stock price may have reached a bottom and is poised for an upward movement.
Traders and investors may interpret this as an opportunity to consider buying positions in anticipation of a potential price increase within the indicated target range.
It's important to note that while technical analysis patterns can provide valuable insights, they are not guaranteed predictors of future price movements. Therefore, investors should conduct thorough research and consider other factors such as fundamental analysis and market conditions before making any trading decisions.
PLEASE NOTE THAT:
This chart analysis is only for reference purpose.
This is not buying or selling recommendations.
I am not SEBI registered.
Please consult your financial advisor before taking any trade

T A T A C O M MTATACOMM fut broke out of triangle pattern on an hourly chart with decent OI & its trading comfortably above breakout level.
Risk:Reward - 1:4
Not to be missed.
Could be bought with mentioned stoploss & target.
TLong

Dhani : Breakout Candidate#Dhani #Breakout #Trianglepattern #patterntrading #patternbreakout #momentumtrade
Dhani : Weekly (1-3 Months)
>> Momentum Trade
>> Breakout Soon
>> Triangle Pattern
>> Good Strength & Volume Build up
>> Low Risk High Reward Trade
I believe it can move towards 100 Ema (60 Levels)
Swing Traders Can lock thier profits at 10% and keep trailing
Disclaimer : Charts Shared are for Learning Purpose & not a Trade Recommendation. Consult your Financial Advisor before taking position in it.
DLong

HFCL LTD - Triangle Breakout in MonthlyHFCL LTD
1) Time Frame - Monthly.
2) Downtrend / Triangle Breakout in Monthly with good volume.
3) Next Resistance / Target would be (Price 101.35) - Previous all time high.
4) Recommendation - Strong buy

MANAKSKIA STEELS LTD - Triangle Pattern & Previous ATH BreakoutMANAKSTEEL
1) Time Frame - Weekly.
2) Previous Life Time High was 64. It has been consolidating in a triangle pattern since 2022 & given a breakout in weekly time frame currently.
3) It's a Triangle pattern & All Time High breakout with strong bullish candle & Good volume.
4) Stock will find its next resistance around the price 80 (17%).
5) Recommendation - Strong Buy

Zuari Agro Chemicals Ltd - Looks Good!"Bottom Triangle" chart pattern formed on Zuari Agro Chemicals Ltd ( NSE:ZUARI ).
The price seems to have reached a bottom, showing signs of reversal as it has broken upward after a period of uncertainty or consolidation.
This bullish pattern can be seen on the chart.
PLEASE NOTE THAT:
This chart analysis is only for reference purpose.
This is not buying or selling recommendations.
I am not SEBI registered.
Please consult your financial advisor before taking any trade

#GROBTEA Cha Da Time Lagda Grob Tea looks good as Positional Trade. After a long consolidation, stock is trading in a Inside Bar candle range of 978-825 for almost 4 months now, also smart money are leaving their footprints (check the volume bars). Expecting good move to come soon now.
Stoploss - (low risk)828, (high risk)780
*DISCLAIMER*
This analysis is only for educational purpose. I am not a SEBI Registered Analyst/Advisor. Please consult your financial advisor before taking any position and please use a Stop Loss for any Investments/Trading Positions. It is your hard earned money so give risk management your highest attention. Do take this disclaimer seriously.
