Container Corporation of India Ltd (CONCOR) READY TO CONQUERContainer Corporation of India Ltd (CONCOR) provides inland container transportation by rail and manages ports, air cargo complexes, and cold chains. It has a market cap of ₹47,778 Cr.
The company is almost debt-free and maintains a healthy dividend payout of 54.9%.
Technical Analysis : Respecting its previous low and forming a triple bottom type structure. On the weekly chart, it has formed a bullish harami candlestick pattern in a downtrend, which is a confirmation to go long. With a very small stop loss of 25 point s, one can aim for the target mentioned and trail accordingly.
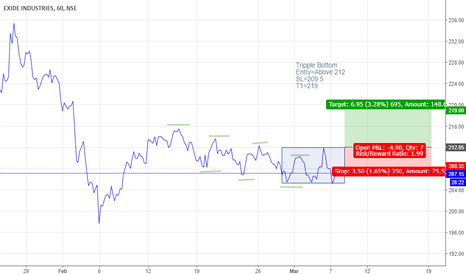
Tripplebottom
Breakout Alert! Laxmi Organic Industries Ltd Hello, traders! I’m excited to share my latest analysis of Laxmi Organic Industries Ltd. This stock is currently showing some intriguing patterns that could signal a major move. Let's dive into the details together!
🧩 Multiple Pattern Breakout 🧩
Laxmi Organic Industries Ltd. has been consolidating after a significant downtrend, forming several classic chart patterns during this phase:
Triple Bottom Pattern : This bullish reversal pattern indicates that the stock has found a strong support level and is ready to move higher. The triple bottom often forms the lower boundary of a rectangle pattern.
Rectangle Pattern : This continuation pattern shows that the stock has been trading within a defined range, waiting for a breakout.
Descending Triangle Pattern : This bearish pattern has been invalidated, as the stock broke out to the upside with strong volumes.
💡 Key Breakout Levels 💡
Yesterday, Laxmi Organic Industries Ltd. broke out of the descending triangle pattern with good volume. Today, it has breached Triple Bottom Pattern neckline and critical zone that has acted as both support and resistance multiple times in the past.
📊 Strong Financial Performance 📊
Laxmi Organic Industries Ltd. also boasts solid financials, adding to its appeal:
Net Profit Growth : There is a notable growth in net profit with increasing profit margin (QoQ).
Revenue Growth : The company has shown increasing revenue every quarter for the past two quarters.
Profit Growth : Profits have been increasing every quarter for the past two quarters.
Institutional Confidence : FII/FPI or institutions have been increasing their shareholding in past quarter.
🚀 Trade Setup
We can plan a buy trade if today's high is broken. For a safer entry, wait for tomorrow’s 1-hour candle to close above today's high before entering the trade. Here's how to manage your trade:
Stop Loss (SL) : Place your SL below today’s low with a buffer.
Target : Aim for at least a 1:3 risk-to-reward ratio. You can also set targets based on the patterns.
This analysis is for educational purposes only and is not intended as a trading or investment recommendation, as I am not a SEBI registered Analyst.
📝 Final Thoughts
Trading is a journey filled with learning and growth. Remember, patience and discipline are key to success in the markets. 📊
Lastly, thank you for your support, your likes & comments. Feel free to ask if you have questions.
JSW - Price near 52W high - RESISTANCEJSW steel is around key resistance zone, i.e. 52 week high. Share has showin resistance near same price 3 times before. First time on 11th May 2021, second on 6th Aug 2021, and third tme on 17th Aug 2021.
However, this time it seems different, price consilidated between a narrow 26 point range of 725 to 751 from 29th March to 8th April and finally opened out of the consolidation box on 11th April, still facing resistance from that very zone.
It will be important to see where the price action leads us. If the price breaks out of this zone, we can expect a good potential upside move, however please be patient and wait for successful confirmation of close above the point for clear indication as it is showing more bearish than bullish signs. For example bearish candlestick: formation of shooting star pattern on 13th Arpil.
NIFTY BANK ON 15 MINS CHARTNifty bank is trading below 200 ma and 50 ma acted as a strong resistance for today session with Fibonacci 38.2% level too. BNF is also making W pattern or we can see Triple bottom pattern which is a trend reversal pattern. Wait for the trendline to break above for buying setup. Trade safe.
The wait is over!The much awaited breakout happened in Maruti In the week before the last one only. But, it is better to not fall prey to failed breakouts. Hence I waited this week to confirm the breakout.
Analysis:-
1) Strong Chart patterns —
Triple bottom formation with triangle pattern breakout.
2) Reclaiming 20WEMA —
So the actual wait was not just the triangle breakout, but, the requirement to close above 20 Week Exponential Moving Average (WEMA). Maruti gave a weekly close above the 20WEMA for the first time after August 2018
3) Momentum —
This price uptrend was accompanied by good volumes indicating momentum.
4) Indicators —
RSI garnering strength and MACD generating a positive crossover
Conclusion:-
A long position here has a potential to capture a healthy upmove of 600 points in coming weeks if the results season goes well. I hold a position in the stock and my personal targets are mentioned in the charts with the 20WEMA acting as the dynamic stop loss.


