$TRX PRICE FORECAST | IS $5 POSSIBLE? | ANALYSIS BY CRYPTOPATELCRYPTOCAP:TRX PRICE FORECAST | IS $5 POSSIBLE? | ANALYSIS BY CRYPTOPATEL
#TRX Is Quietly Building A Massive Multi-Year Base On The 2W Chart.
Price Has Respected The Same Rising HTF Trendline Since 2020 — A Clear Sign Of Long-Term Strength.
Technical Highlights:
✅ Clean Higher Highs & Higher Lows
✅ Multi-Year Ascending HTF Trendline Holding
✅ Strong HTF Demand Zone Holding At ~$0.25
✅ Extended Consolidation → Expansion Setup
✅ Macro Trend Bias Remains Bullish
CryptoPatel Targets: $1 → $2 → $5+
Invalidation: ❌ Weekly Close Below ~$0.20
As Long As TRX/USDT Holds Above $0.25, The Bullish Structure Remains Intact.
A Loss Of This Level Would Break The Macro Thesis.
Cycle Outlook:
2025 = Compression Phase
2026–2027 = Potential Parabolic Expansion
TA Only | DYOR | Not Financial Advice
TRX

Will TRON hit $2 in this bull run?If CRYPTOCAP:TRX loses $0.26 I'm deleting this tweet. If it holds? We're going to $2 💎
Currently: $0.26 ✅
Target: $2.00 🔜
Upside: 600%
Bulls in full control and NOT losing this level 💪
Screenshot this tweet
NFA & DYOR

TRON $TRX WILL BOUNCE BACK HARDCRYPTOCAP:TRX 💰4H Analysis
Right now, the price is testing a buy zone around $0.2926–$0.2982. If there’s a quick bounce from this area, it could be a good spot to open long positions 🐬. The main idea is to catch the reversal and target a move back up to the highlighted POI zone.
🚀Long targets: $0.3135, $0.3250, $0.3330 for Scalping.

Will TRON hit $1 Club?TRON rise has been nothing short of epic.
From $0.0068 at launch to $0.36 today, over 50x growth.
$1 isn’t a dream anymore… it’s getting closer every day.
Who’s ready for CRYPTOCAP:TRX to crash into the $1 club? 🚀
NFA & DYOR

$TRX is the most slept-on asset in crypto. Here’s why🚨 CRYPTOCAP:TRX is the most slept-on asset in crypto. Here’s why 👇
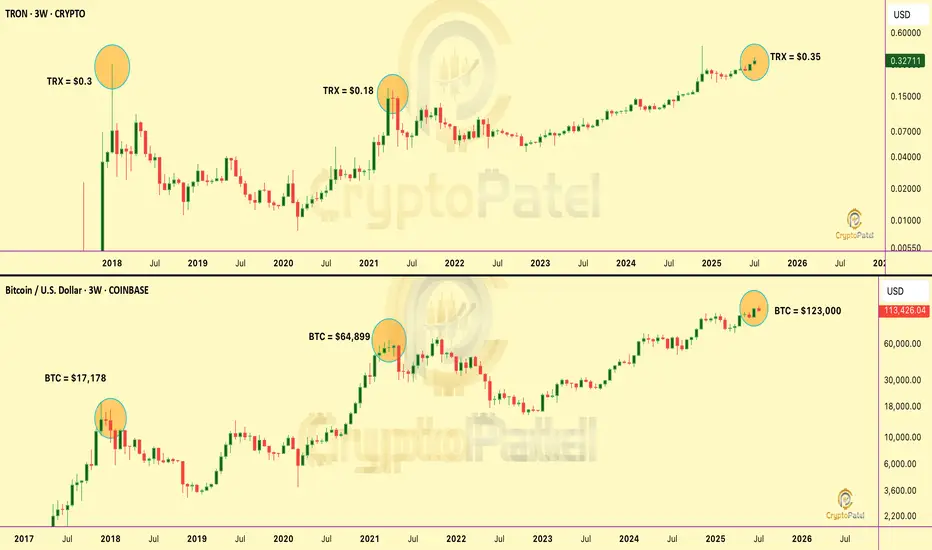
📌 In Jan 2018, TRX hit $0.30 when #Bitcoin was only $17,178
📌 In 2021, TRX was $0.18 with BTC at $64,899
📌 Today BTC is $113,000, but TRX is still just $0.32
How is TRX still lagging… despite tech, adoption, and ecosystem growth?
It’s time to rewrite the narrative.
It’s time to Make TRON Great Again. #MTGA 🔺
Much respect to justinsuntron & trondao
Builders never stop. The community stands with you. 💪
NFA & DYOR
TRX Long Swing Setup – Waiting for Pullback After Bullish RallyTRX has seen a strong rally over the past few days, and we’re now watching for a retracement into support. The $0.260–$0.262 zone offers a potential long spot entry as price cools off.
📌 Trade Setup:
• Entry Zone: $0.260 – $0.262
• Take Profit Targets:
o 🥇 $0.278
o 🥈 $0.292
• Stop Loss: Daily close below $0.249

TRX NEXT EXPLOSION INCOMING? TRX NEXT EXPLOSION INCOMING?
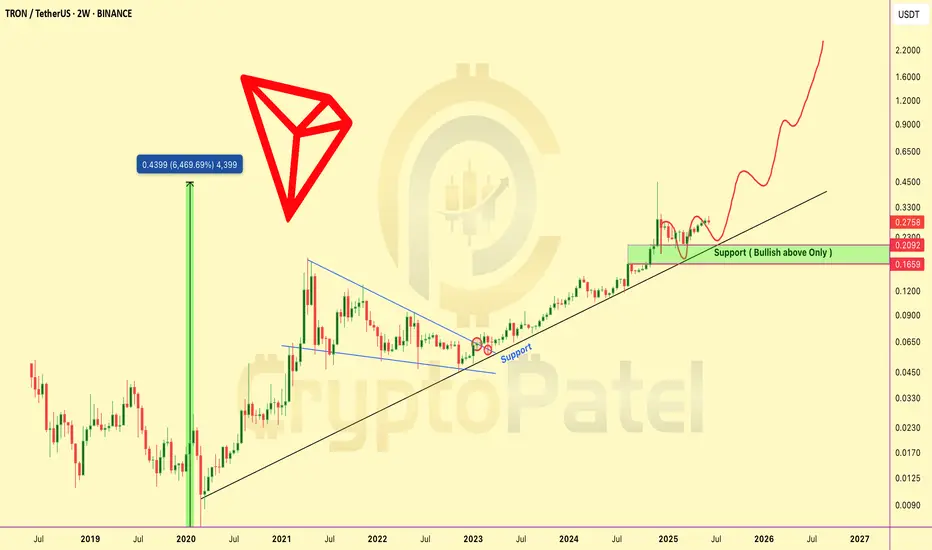
TRX is showing a strong bullish setup after breaking out of a long-term consolidation pattern.
🔹 Price has cleanly broken out of a multi-year descending structure
🔹 Retested the key support zone around $0.21–$0.23
🔹 Still respecting the long-term ascending trendline from 2020
🔹 Historical move: 6,469% rally in the previous cycle — current structure suggests similar potential
Key Technical Levels to Watch:
🟩 Support Zone: $0.209–$0.230
🟩 As long as TRX holds above this level, bias remains bullish
🟩 This is a breakout + retest scenario.
🟩 Potential Upside Targets: $0.65 → $1.20 → $2.20+
The chart structure is indicating the possibility of a strong uptrend continuation, with bullish momentum building on higher timeframes.
TRX is technically strong and could be gearing up for a major leg higher if key support holds.
Add it to your watchlist. NFA & DYOR
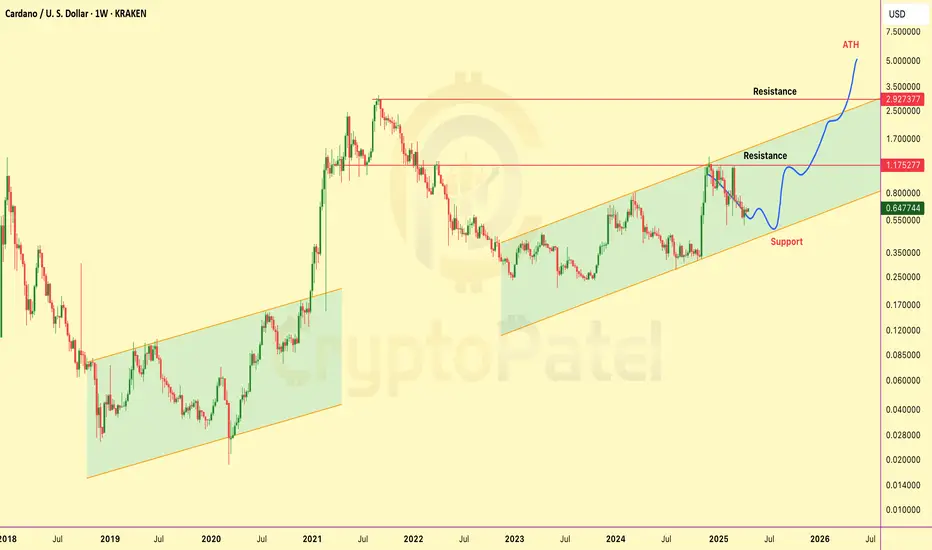
Will ADA hit $5 in bull Market ?CRYPTOCAP:ADA isn’t dead — it’s Loading For $5
The Setup is Clean:
✅ Support at $0.45
✅ Accumulation between $0.65–$0.45
🎯 Targets: $2, $4, $6
Patience here could print fortunes.
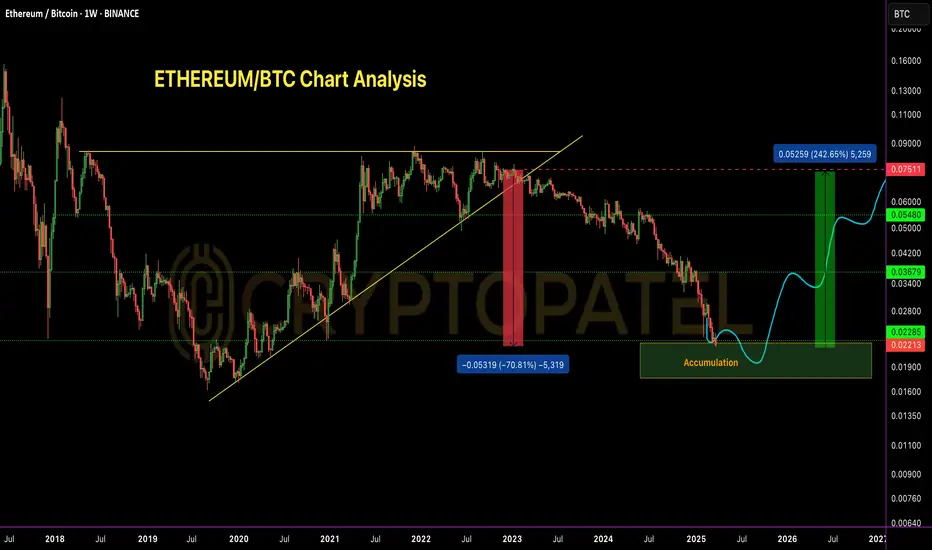
ETH/BTC – 70% Drop Achieved | Perfect Short ExecutionETH/BTC – 70% Drop Achieved | Perfect Short Execution
As projected in my analysis dated 10th Nov 2022, ETH/BTC has completed the anticipated 70% correction from the top.
Short Entry: 0.075 BTC ✅
TP1: 0.055 BTC – ✅
TP2: 0.037 BTC – ✅
TP3: 0.023 BTC – ✅
All targets achieved with precision.
Bearish structure played out as expected.
Current Outlook:
CRYPTOCAP:ETH Price has now entered a historical demand zone, coinciding with major multi-year support levels.
Accumulation Phase Activated –
Starting to scale into long positions from current levels, targeting mid-to-long term reversal setup.
Patience required – this could be the base of the next macro leg up.
Note: NFA & DYOR
#Ethereum
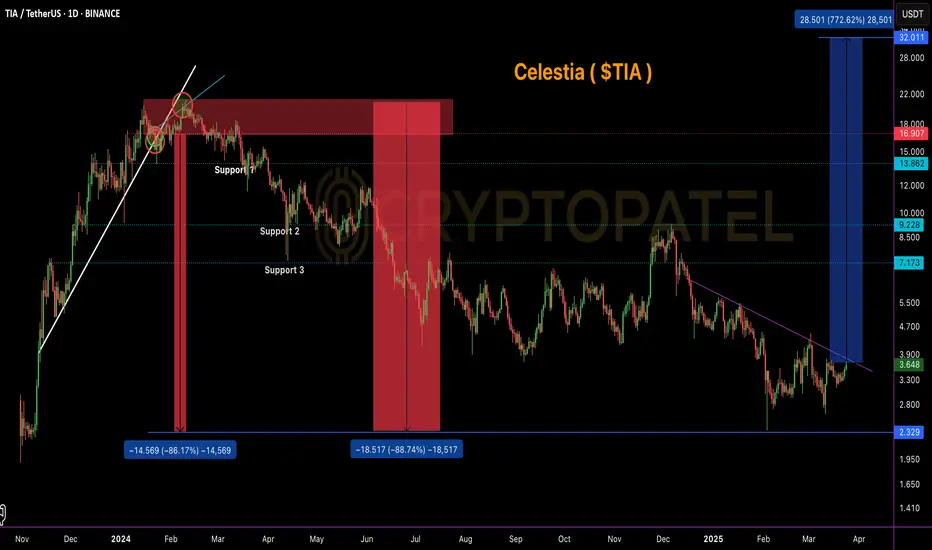
$TIA dropped ~86% from our short entry zone!LSE:TIA Massive Profit Update – Short Call Hit Perfectly 🔥
LSE:TIA dropped ~86% from our short entry zone!
We shared a short setup for LSE:TIA at the $17–$20 range. After a textbook retest rejection, price began its downward move and has now dumped all the way to $2.36, hitting a massive -86% from the top of our short zone. ✅
Current Technical Outlook (Accumulation Zone):
Based on chart structure and historical support levels, we are now entering a potential accumulation range between $3.60 – $2.50.
Long-Term Outlook:
If this zone holds, we could see a strong recovery in the coming months with possible upside targets in the $20–$40 range in the long run.
🚨 Note: This is not financial advice. Always DYOR (Do Your Own Research) before investing or trading.
#TRON to $1? Highly Possible! But Gold Entry is Key #TRON to $1? Highly Possible! But Gold Entry is Key 🚀
📉 Best Accumulation Zone for CRYPTOCAP:TRX : $0.140 - $0.10
🏆 Patience & Strategy Win the Game!
NFA. DYOR!
CRYPTOCAP:TRX #Altcoins

$TRX hit our 200% target as predicted! 🚀 CRYPTOCAP:TRX hit our 200% target as predicted!
Tron is showing strong momentum, and I still believe $1 is possible this bull run!
📉 Best buy zone: $0.180 - $0.160 (if we get it).
Who’s holding TRX to $1?
RT & Like if you’re bullish! 🔄

TRON Bull Market Performance Over the Years:#TRON Bull Market Performance Over the Years:
2017 Bull Market: 🚀 +23,800%
2021 Bull Market: 🚀 +1,650%
2025 Bull Market: +900% till now
My Take: TRX/USDT is $1 Potential But CRYPTOCAP:TRX has likely delivered most of its returns already. While it may pump again, don't expect massive gains in this cycle.
📊 IMO, $0.60 is a good exit range. Anything above $0.6 would be a bonus!
NFA & DYOR
#TRX #Crypto

TRON bullish toward $0.5 ?#TRON is looking bullish!
All resistance levels have been broken, and it's now heading toward $0.30-$0.50. I'm expecting a 200-300% upward move from here.
Strong support at $0.140

Bitcoin Buy in DEC Sell in DEC scenarioWhat your view about this scenario after ETF Approved or denied.

TRX Is Not Looking GoodAs Huobi Exchange Changed Their Name To HTX First Hack Has Been Successfully Fooled , Next 8$ Million Worth Of Etherium ( 5000 ETH ) Has Been Hacked , It's Really Better To Stay Away From This Justin Sun's Exchange and Tokens
#Stay_SAFU

TRX/USDT:- Anticipating Correction towards Key Support Levels ?In this technical analysis, we delve into the price action of TRX/USDT, examining crucial resistance and support levels to decipher potential market movements.
Resistance Area - 0.07800 - 0.07850
TRX/USDT has encountered a substantial resistance area at 0.07800 - 0.07850. This zone has historically posed as a formidable barrier halting upward price momentum.
Anticipated Price Correction - 0.07100 - 0.07200
The potential correction is projected to lead the pair towards the support zone ranging from 0.07100 to 0.07200. This area holds significance due to its historical role as both a support and consolidation zone.
Bearish Order Block Analysis - 0.07800 - 0.07850
Presently, TRX/USDT finds itself trading within a bearish order block, precisely coinciding with the resistance area at 0.07800 - 0.07850. This bearish order block signifies a cluster of price levels where selling pressure has outweighed buying activity.
The alignment of this bearish order block with the resistance further strengthens the expectation of a downward movement.
Stay informed, stay cautious, and keep a keen eye on the evolving market trends.

Tron weekly chartTrx is forming a triangle pattern in weekly timeframe
And has shown no move since months
I hope it will give good move once came out of this cage


💡Don't miss the great buy opportunity in TRXUSD @justinsuntronTrading suggestion:
". There is a possibility of temporary retracement to the suggested support line (0.06325).
. if so, traders can set orders based on Price Action and expect to reach short-term targets."
Technical analysis:
. TRXUSD is in a range bound, and the beginning of an uptrend is expected.
. The price is above the 21-Day WEMA, which acts as a dynamic support.
. The RSI is at 70.
Take Profits:
TP1= @ 0.06500
TP2= @ 0.06650
TP3= @ 0.06835
TP4= @ 0.07143
TP5= @ 0.07348
SL= Break below S2
❤️ If you find this helpful and want more FREE forecasts in TradingView
. . . . . Please show your support back,
. . . . . . . . Hit the 👍 LIKE button,
. . . . . . . . . . Drop some feedback below in the comment!
❤️ Your support is very much 🙏 appreciated!❤️
💎 Want us to help you become a better Forex / Crypto trader?
Now, It's your turn!
Be sure to leave a comment; let us know how you see this opportunity and forecast.
Trade well, ❤️
ForecastCity English Support Team ❤️

BTC/USD chart only for learning purposechart indicating bullish RSI looks like it can retouch 24500$ before dumping more.

💡Don't miss the great buy opportunity in TRXUSD @justinsuntronTrading suggestion:
". There is a possibility of temporary retracement to the suggested support line (0.06690).
. if so, traders can set orders based on Price Action and expect to reach short-term targets."
Technical analysis:
. TRXUSD is in a range bound, and the beginning of an uptrend is expected.
. The price is above the 21-Day WEMA, which acts as a dynamic support.
. The RSI is at 61.
Take Profits:
TP1= @ 0.07046
TP2= @ 0.07410
TP3= @ 0.07869
TP4= @ 0.08573
TP5= @ 0.09223
SL= Break below S2
❤️ If you find this helpful and want more FREE forecasts in TradingView
. . . . . Please show your support back,
. . . . . . . . Hit the 👍 LIKE button,
. . . . . . . . . . Drop some feedback below in the comment!
❤️ Your support is very much 🙏 appreciated!❤️
💎 Want us to help you become a better Forex / Crypto trader?
Now, It's your turn!
Be sure to leave a comment; let us know how you see this opportunity and forecast.
Trade well, ❤️
ForecastCity English Support Team ❤️

TRX USDT Movement pattern by OnlineBeetlebuy red sell green go green/
that's all I have to say trade at your own risk this is not financial advice this is my personal opinion.
