$TRX PRICE FORECAST | IS $5 POSSIBLE? | ANALYSIS BY CRYPTOPATELCRYPTOCAP:TRX PRICE FORECAST | IS $5 POSSIBLE? | ANALYSIS BY CRYPTOPATEL
#TRX Is Quietly Building A Massive Multi-Year Base On The 2W Chart.
Price Has Respected The Same Rising HTF Trendline Since 2020 — A Clear Sign Of Long-Term Strength.
Technical Highlights:
✅ Clean Higher Highs & Higher Lows
✅ Multi-Year Ascending HTF Trendline Holding
✅ Strong HTF Demand Zone Holding At ~$0.25
✅ Extended Consolidation → Expansion Setup
✅ Macro Trend Bias Remains Bullish
CryptoPatel Targets: $1 → $2 → $5+
Invalidation: ❌ Weekly Close Below ~$0.20
As Long As TRX/USDT Holds Above $0.25, The Bullish Structure Remains Intact.
A Loss Of This Level Would Break The Macro Thesis.
Cycle Outlook:
2025 = Compression Phase
2026–2027 = Potential Parabolic Expansion
TA Only | DYOR | Not Financial Advice
Trxusdt

Will TRON hit $2 in this bull run?If CRYPTOCAP:TRX loses $0.26 I'm deleting this tweet. If it holds? We're going to $2 💎
Currently: $0.26 ✅
Target: $2.00 🔜
Upside: 600%
Bulls in full control and NOT losing this level 💪
Screenshot this tweet
NFA & DYOR

TRON $TRX WILL BOUNCE BACK HARDCRYPTOCAP:TRX 💰4H Analysis
Right now, the price is testing a buy zone around $0.2926–$0.2982. If there’s a quick bounce from this area, it could be a good spot to open long positions 🐬. The main idea is to catch the reversal and target a move back up to the highlighted POI zone.
🚀Long targets: $0.3135, $0.3250, $0.3330 for Scalping.

Will TRON hit $1 Club?TRON rise has been nothing short of epic.
From $0.0068 at launch to $0.36 today, over 50x growth.
$1 isn’t a dream anymore… it’s getting closer every day.
Who’s ready for CRYPTOCAP:TRX to crash into the $1 club? 🚀
NFA & DYOR

$TRX is the most slept-on asset in crypto. Here’s why🚨 CRYPTOCAP:TRX is the most slept-on asset in crypto. Here’s why 👇
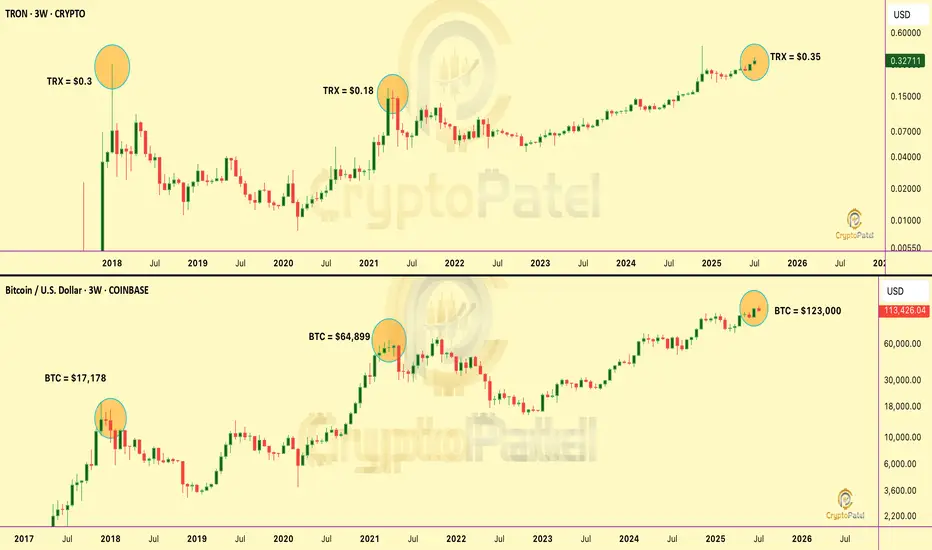
📌 In Jan 2018, TRX hit $0.30 when #Bitcoin was only $17,178
📌 In 2021, TRX was $0.18 with BTC at $64,899
📌 Today BTC is $113,000, but TRX is still just $0.32
How is TRX still lagging… despite tech, adoption, and ecosystem growth?
It’s time to rewrite the narrative.
It’s time to Make TRON Great Again. #MTGA 🔺
Much respect to justinsuntron & trondao
Builders never stop. The community stands with you. 💪
NFA & DYOR
TRX Long Swing Setup – Waiting for Pullback After Bullish RallyTRX has seen a strong rally over the past few days, and we’re now watching for a retracement into support. The $0.260–$0.262 zone offers a potential long spot entry as price cools off.
📌 Trade Setup:
• Entry Zone: $0.260 – $0.262
• Take Profit Targets:
o 🥇 $0.278
o 🥈 $0.292
• Stop Loss: Daily close below $0.249

TRX NEXT EXPLOSION INCOMING? TRX NEXT EXPLOSION INCOMING?
TRX is showing a strong bullish setup after breaking out of a long-term consolidation pattern.
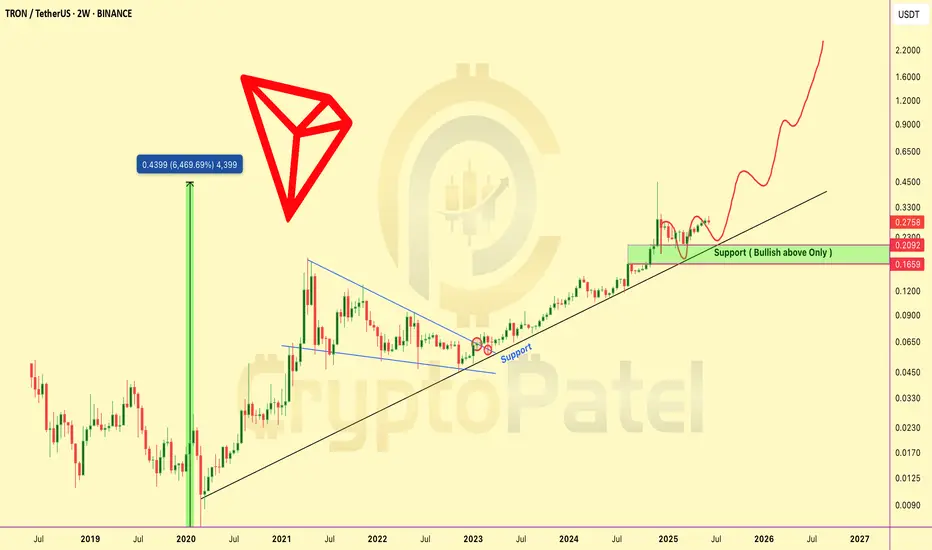
🔹 Price has cleanly broken out of a multi-year descending structure
🔹 Retested the key support zone around $0.21–$0.23
🔹 Still respecting the long-term ascending trendline from 2020
🔹 Historical move: 6,469% rally in the previous cycle — current structure suggests similar potential
Key Technical Levels to Watch:
🟩 Support Zone: $0.209–$0.230
🟩 As long as TRX holds above this level, bias remains bullish
🟩 This is a breakout + retest scenario.
🟩 Potential Upside Targets: $0.65 → $1.20 → $2.20+
The chart structure is indicating the possibility of a strong uptrend continuation, with bullish momentum building on higher timeframes.
TRX is technically strong and could be gearing up for a major leg higher if key support holds.
Add it to your watchlist. NFA & DYOR
TRXUSDTWe can accumulate trx at current price for mention elliot waves, this is the second time i am posting trx chart. TRX is stil bullish for me. This crypto is sideways from a long time and form a descending triangle and as per Elliot wave analysis we can see a third wave in this crypto. I have mention two levels as per third wave analysis we can see a downfall from this two point the it will form a 4-5 wave . then it will go on
let's see how it will perform
Thanks
ishu prajapati

Tron is gaining movement in bullish wedge and heading to 0.15$Tron is continuously trading in long time bullish wedge and now it's gaining momentum after touch the bottom of this wedge if it's true it can touch 0.150 mark very soon.

TRXUSDTI am watching this crypto from a long time , this crypto is sideways from a long time and form a descending triangle and as per Elliot wave analysis we can see a third wave in this crypto. I have mention two levels as per third wave analysis we can see a downfall from this two point the it will form a 4-5 wave . then it will go on
let's see how it will perform
Thanks
ishu prajapati

TRX Is Not Looking GoodAs Huobi Exchange Changed Their Name To HTX First Hack Has Been Successfully Fooled , Next 8$ Million Worth Of Etherium ( 5000 ETH ) Has Been Hacked , It's Really Better To Stay Away From This Justin Sun's Exchange and Tokens
#Stay_SAFU

TRX/USDT:- Anticipating Correction towards Key Support Levels ?In this technical analysis, we delve into the price action of TRX/USDT, examining crucial resistance and support levels to decipher potential market movements.
Resistance Area - 0.07800 - 0.07850
TRX/USDT has encountered a substantial resistance area at 0.07800 - 0.07850. This zone has historically posed as a formidable barrier halting upward price momentum.
Anticipated Price Correction - 0.07100 - 0.07200
The potential correction is projected to lead the pair towards the support zone ranging from 0.07100 to 0.07200. This area holds significance due to its historical role as both a support and consolidation zone.
Bearish Order Block Analysis - 0.07800 - 0.07850
Presently, TRX/USDT finds itself trading within a bearish order block, precisely coinciding with the resistance area at 0.07800 - 0.07850. This bearish order block signifies a cluster of price levels where selling pressure has outweighed buying activity.
The alignment of this bearish order block with the resistance further strengthens the expectation of a downward movement.
Stay informed, stay cautious, and keep a keen eye on the evolving market trends.

TRX’s price has pumped by 0.57% in the last 24 hours.1) TRX could hit $0.088 in 2023
2) TRON’s price prediction for the most bearish scenario will value TRX at $0.057 in 2023
3) TRON’s previous All Time High was on 5th January 2018 where TRX was priced at $0.23
4) To simplify the latest TRX price prediction, we have divided up the prediction by short term TRON price prediction and long term TRON price prediction.
5) TRX had a trading volume of $288,753,858. TRON has gone up by 3.94% in the past 30 days.
6) According to our analysis in the short term, TRON price prediction for August 2023 shows the average price of TRX at $0.068 and the highest possible price for August 2023 would be $0.072.
7) Further, according to our analysis in the long term, TRON price prediction for December 2023 shows the average price of TRX at $0.073 and the highest possible price for December 2023 would be $0.078.

Tron weekly chartTrx is forming a triangle pattern in weekly timeframe
And has shown no move since months
I hope it will give good move once came out of this cage


TRXUSDT SHORTTron had tried to balance its price in recent days but now it is going tank. It can drop to .55$ in my view.

TRX been doin good!This analysis is for those who are looking for some good investments in the crypto market. As we can see many meme coins getting pumped and dumped within a few hours, due to which, the beginners loose a lot of money. So, if you're one of those people, or you got some losses from the crypto market, Tron (TRX) is one of the coins which might give good returns on investment.
Tron has two main functions, it is a global content sharing platform and it allows the users to make their own automated applications. It is basically an NFT.
According to price data provider CoinMarketCap, Tron’s price reached an all-time high of $0.22 in January 2018 amid a crypto-wide bull run. For most of 2018 and 2019, Tron’s price hovered between $0.01 and $0.04. Tron’s price hit a fresh peak of $0.16 in April 2021, rising with the rest of the market as bitcoin broke $64,000 for the first time.
It borrows some of its technology from Ethereum too, the Tron Virtual Machine which is similar to Ethereum's Virtual Machine. YouTube is a major competitor of Tron, but Tron is built more with decentralized file sharing in mind.
According to some news sources, Tron is being burnt more than that of its net production daily, this is a positive news for Tron. The Total supply of TRX is around 100B, out of which 71B is currently circulating.
Now, if I come to the technical analysis, TRX is currently at a major supple zone. It tested the same level many times in the past few days. Now, today, even when the Bitcoin was falling, along with all the other altcoins, Tron was still showing some results on the positive side. Now it is near the golden zone of the bearish Fibonacci Retracement, which I made during the Bearish markets of June. If it breaks the Golden Zone perfectly, it will be officially in a massive bull run again.
It got retraced from the golden zone of bullish Fibonacci retracement too. Now, it might go for a new high at the -0.382 level of the same Fibonacci Retracement.


POSIBLE TRIANGLE PATTERN ON TRON $TRX LONG ANALISISthis analysis is just an idea, it is not an investment advice please, if you liked my analysis give me a like and leave me your feedback!

TRXUSDTTRXUSDT POI Point of Interest m looking to Buy
All Videos/Information on this channel are for Education purpose only .They are not buy/Sell Recommendations. Please consult your financial Advisor before taking any trade or investment decisions.

💡Don't miss the great buy opportunity in TRXUSD @justinsuntroMidterm forecast:
0.09630 is a major support, while this level is not broken, the Midterm wave will be uptrend.
We will close our open trades, if the Midterm level 0.09630 is broken.
Technical analysis:
While the RSI support #1 at 45 is not broken, the probability of price decrease would be too low.
A peak is formed in daily chart at 0.16950 on 05 /07/2021, so more losses to support(s) 0.11700, 0.10025 and minimum to Major Support (0.09630) is expected.
Price is below WEMA21, if price rises more, this line can act as dynamic resistance against more gains.
Relative strength index ( RSI ) is 49.
Take Profits:
0.14850
0.16950
0.17900
0.21600
0.29500
❤️ If you find this helpful and want more FREE forecasts in TradingView
. . . . . Please show your support back,
. . . . . . . . Hit the 👍 LIKE button,
. . . . . . . . . . Drop some feedback below in the comment!
❤️ Your Support is very much 🙏 appreciated!❤️
💎 Want us to help you become a better Forex / Crypto trader?
Now, It's your turn!
Be sure to leave a comment; let us know how you see this opportunity and forecast.
Trade well, ❤️
ForecastCity English Support Team ❤️

💡Don't miss the great buy opportunity in TRXUSD @justinsuntroMidterm forecast:
0.09630 is a major support, while this level is not broken, the Midterm wave will be uptrend.
We will close our open trades, if the Midterm level 0.09630 is broken.
Technical analysis:
While the RSI support #1 at 45 is not broken, the probability of price decrease would be too low.
A peak is formed in daily chart at 0.16950 on 05/07/2021, so more losses to support(s) 0.11700, 0.10025 and minimum to Major Support (0.09630) is expected.
Price is below WEMA21, if price rises more, this line can act as dynamic resistance against more gains.
Relative strength index (RSI) is 49.
Take Profits:
0.14860
0.16950
0.17900
0.21600
0.29500
❤️ If you find this helpful and want more FREE forecasts in TradingView
. . . . . Please show your support back,
. . . . . . . . Hit the 👍 LIKE button,
. . . . . . . . . . Drop some feedback below in the comment!
❤️ Your Support is very much 🙏 appreciated! ❤️
💎 Want us to help you become a better Forex / Crypto trader ?
Now, It's your turn !
Be sure to leave a comment; let us know how you see this opportunity and forecast.
Trade well, ❤️
ForecastCity English Support Team ❤️

