Tesla - Flag & Pennant Pattern BreakoutTesla breaking out of a Flag & Pennant Pattern that may take it to new all time highs
Tesla Motors (TSLA)
We are not positive about TeslaThe impact of tariffs and expiring EV credits is expected to pressure future US deliveries and regulatory credit revenue in the near term
Elon Musk: Well, we're in this weird transition period where we will lose a lot of incentives in the US. Slab incentives actually in many other parts of the world. But we'll lose them in the US. Across all of it at the relatively early stages of autonomy. On the other hand, autonomy is most advanced and most available from a regulatory standpoint in the US. Does that mean we could have a few rough quarters? Yeah. We probably could have a few rough quarters. I'm not saying that we will, but we could. Q4, Q1, maybe Q2.
Revenue -12% y/y ( decline for the first time in 10 years)!!!
EPS 0,27 $ agj vs 0,39 $ estimated
FCF -89% y/y but still positive ( just 146 M$)
CAPEX for 2025 increased
EBITDA dropped by 7.8%.
Price to Sales 12,7
P/B 14
Expensive
We expect declining of the stock price to 210 $
And, yes, many still regard Tesla as a car manufacturer, but this is not a correct view of the company. Later in our blog we will touch on the question of how to correctly look at the brainchild of Elon Musk.

TSLATSLA
CMP: $340
After nearly 4.6 years of sideways consolidation , TSLA has broken out and looks positioned to enter a new trading zone.
Support Zone : $300–336
Supply Zone (near-term resistance) : $385–428
With a 3-year perspective , the setup indicates potential for ~60% upside .
Stop Loss : $280 (to manage risk on this early entry).
The recent weekly triangle breakout supports the bullish view, though this remains an early and relatively risky entry with a tight stop strategy.

Part 7 Trading Master Class Calls & Puts with Real-Life Examples
Call Option Example
Suppose Reliance stock is trading at ₹2,500.
You buy a Call Option with strike price ₹2,600, paying a premium of ₹50.
If Reliance goes to ₹2,800, your profit = (2800 - 2600 - 50) = ₹150 per share.
If Reliance stays below 2600, you lose only the premium = ₹50.
A call option = bullish bet (you expect prices to rise).
Put Option Example
NIFTY is at 22,000.
You buy a Put Option strike 21,800, premium ₹80.
If NIFTY falls to 21,200 → Profit = (21800 - 21200 - 80) = ₹520 per lot.
If NIFTY rises above 21,800, you lose only ₹80.
A put option = bearish bet (you expect prices to fall).
Why Traders Use Options
Options are powerful because they allow:
Leverage – Control large value with small money (premium).
Example: Buying Reliance stock directly at ₹2,500 may cost ₹2.5 lakh (100 shares). But buying a call option may cost just ₹5,000.
Hedging – Protect portfolio from losses.
Example: If you hold Infosys shares, you can buy a put option to protect against downside.
Speculation – Bet on market direction with limited risk.
Income generation – Selling options (covered calls, cash-secured puts) generates steady income.

Sectoral Rotation & Thematic TradingIntroduction
The stock market is like a living organism – it breathes, evolves, and reacts differently under various economic and business conditions. If you observe closely, not all stocks move the same way at the same time. Some industries boom while others struggle, depending on interest rates, inflation, consumer demand, government policies, or even global events.
This constant shift of money from one sector to another is called sectoral rotation. Investors and traders who understand this flow can position themselves ahead of the curve, capturing strong returns from sectors that are about to outperform.
Alongside sector rotation, another powerful concept has gained popularity – thematic trading. Instead of focusing on short-term cycles, thematic investing captures long-term structural trends such as digitization, renewable energy, electric vehicles (EVs), artificial intelligence (AI), or climate change. These themes can cut across multiple sectors and create massive wealth opportunities.
Together, sectoral rotation and thematic trading provide a dual framework – one that captures short- to medium-term economic cycles, and another that taps into long-term megatrends. Let’s dive deep into both strategies.
Part 1: Understanding Sectoral Rotation
What is Sectoral Rotation?
Sectoral rotation is the strategy of moving investments across different sectors of the economy based on where money is likely to flow next.
Think of it like this:
During an economic boom, consumer spending rises → retail, automobiles, travel, and entertainment perform well.
When inflation rises, defensive sectors like FMCG, pharma, and utilities outperform because demand for essentials is steady.
In recovery phases, banking, infrastructure, and capital goods tend to benefit as credit and investments flow.
Smart traders ride this rotation of capital to maximize returns.
Why Does Sectoral Rotation Happen?
The economy moves in cycles, and different sectors react differently:
Interest Rate Sensitivity – When rates rise, sectors like banks may benefit (higher margins), while real estate may suffer (loans get costly).
Commodity Prices – High crude oil benefits oil & gas companies but hurts airlines.
Government Policies – A focus on renewable energy, infrastructure spending, or PLI schemes (Production Linked Incentives) boosts specific industries.
Global Trends – A technology boom in the US may spill over to Indian IT companies.
Earnings Cycle – Quarterly results highlight which industries are growing faster.
So, sector rotation is essentially the movement of money chasing relative strength across industries.
Sectoral Rotation and the Economic Cycle
Here’s how different sectors usually perform in economic cycles:
Early Recovery (Post-recession)
Beneficiaries: Banks, capital goods, infrastructure, real estate, auto.
Reason: Cheap money, rising demand, and credit expansion.
Mid-cycle Growth (Boom period)
Beneficiaries: Technology, manufacturing, consumer discretionary, travel, luxury goods.
Reason: Rising consumption and business expansion.
Late-cycle (Inflation & High Growth)
Beneficiaries: Energy, metals, commodities, FMCG, pharma.
Reason: Rising input prices, defensive consumption plays.
Downturn / Recession
Beneficiaries: FMCG, healthcare, utilities.
Reason: Essentials remain stable even in slowdown.
By understanding this cycle, traders can pre-position in sectors before they peak.
Tools & Indicators for Sectoral Rotation
Relative Strength (RS) Analysis – Compare one sector index vs. Nifty 50 to see outperformance.
Sectoral Indices – Nifty Bank, Nifty IT, Nifty FMCG, Nifty Pharma, etc. show trends clearly.
Volume & Price Breakouts – Surging volumes in sector leaders signal capital inflows.
Global Correlations – For IT, look at Nasdaq; for metals, track global commodity prices.
Macro Data – Interest rates, inflation numbers, IIP (Index of Industrial Production).
Sectoral Rotation in Indian Context
In India, sectoral plays are extremely visible:
2017–2019: IT and FMCG were strong as global tech demand rose and consumption stayed stable.
2020 (Covid crash): Pharma and IT outperformed while travel, banking, and autos collapsed.
2021: Banks, metals, real estate, and infra rallied as reopening boosted demand.
2022: Commodities surged due to the Russia-Ukraine war, while IT corrected after huge 2020–21 gains.
2023–2025: Energy transition (renewables, EVs), digital India, and PSU stocks have seen huge money rotation.
This proves sector rotation is not just theory – it’s visible in price action year after year.
Sectoral Rotation Trading Strategies
Rotational Allocation – Regularly move capital into outperforming indices (Bank Nifty, IT, Pharma).
Pair Trading – Go long a strong sector and short a weak one (e.g., Long IT / Short FMCG).
Top-Down Approach – First identify strong sector → then pick leading stocks in that sector.
ETF or Sectoral Funds – For investors who don’t want to pick individual stocks.
Event-Driven Rotation – Budget focus on infra? Buy infra stocks. RBI rate hike? Play banking.
Part 2: Thematic Trading
What is Thematic Trading?
While sectoral rotation looks at cyclical shifts, thematic trading focuses on long-term structural changes in the economy.
A theme is a broad investment idea that goes beyond individual sectors. For example:
Green Energy Theme: Includes solar, wind, EVs, batteries, and related supply chains.
Digital India Theme: Covers IT services, fintech, e-commerce, data centers, semiconductors.
Healthcare Theme: Pharma, diagnostics, insurance, medical devices.
Unlike sector rotation (which is cyclical), thematic investing is secular – it rides megatrends that play out over years or decades.
Why Thematic Trading Works
Government Push – Policies like “Make in India”, “PLI Schemes”, “Atmanirbhar Bharat” create multi-year opportunities.
Global Structural Shifts – AI, automation, and clean energy are not fads – they’re irreversible trends.
Changing Consumer Behavior – Millennials prefer digital payments, EVs, and sustainable products.
Innovation & Technology – Disruptive technologies create new industries from scratch.
Thematic trading aligns your portfolio with where the world is headed.
Popular Themes in India
Renewable Energy & EVs – Adani Green, Tata Power, NTPC Renewables, EV battery makers.
Digital & IT Transformation – Infosys, TCS, Tech Mahindra, SaaS companies, data centers.
Banking & Financial Inclusion – Fintech startups, PSU banks revival, UPI-based payments.
Healthcare & Pharma 2.0 – Biotech, vaccines, hospital chains, digital health platforms.
Infrastructure Boom – Railways, defense, roads, ports, smart cities.
Consumer Growth Story – Premium FMCG, e-commerce, retail, luxury consumption.
AI & Automation – Robotics, semiconductor, chip manufacturing, AI-driven SaaS.
Thematic Trading Strategies
Theme-first, stock-next – Identify a powerful trend → select companies best positioned to benefit.
ETF / Mutual Fund Route – Many thematic mutual funds (IT, infra, pharma) are available.
Long-Term Holding – Unlike rotation, themes require patience (5–10 years horizon).
Event-Based Entry – E.g., Global push for EV → enter when government announces subsidies.
Diversification within Theme – If betting on EV, don’t only buy car makers – also look at battery suppliers, charging infra, mining companies.
Risks in Thematic Trading
Overhype & Bubbles – Not every theme sustains (e.g., dot-com bubble).
Policy Dependency – If subsidies or government support fades, themes collapse.
Concentration Risk – Over-investing in one theme can hurt if it fails.
Execution Risk – Companies may not adapt fast enough to benefit from themes.
Hence, while themes are powerful, one must balance enthusiasm with realism.
Part 3: Combining Sectoral Rotation & Thematic Trading
A smart trader doesn’t choose one over the other – both strategies complement each other.
Sectoral Rotation → Captures short-term cyclical opportunities (3–12 months).
Thematic Trading → Rides long-term structural megatrends (5–10 years).
For example:
Theme: Renewable Energy (10+ years)
Sector Rotation: Within this theme, solar may outperform first, then EV batteries, then power utilities.
By combining both, you get the best of both worlds – short-term timing + long-term conviction.
Practical Framework for Traders & Investors
Macro Analysis First – Track GDP growth, inflation, interest rates, budget, and global trends.
Identify Sector Winners – Use sectoral indices & relative strength to see where money is flowing.
Overlay Themes – Check if the sector fits into a bigger theme (e.g., railways in infra theme).
Stock Selection – Pick leaders (highest market share, strong balance sheet, institutional backing).
Risk Management – Use stop-losses in trading; diversify across themes for investing.
Review & Rotate – Monitor quarterly results, news, and policy changes.
Case Studies
Case 1: Indian IT Boom (2000s–2020s)
Theme: Global digitization and outsourcing.
Sectoral Rotation: IT outperformed whenever global tech demand surged, then corrected during recessions.
Result: Infosys, TCS, Wipro created massive wealth.
Case 2: Renewable Energy (2020s)
Theme: Green energy transition.
Sectoral Rotation: Solar companies first, then EV batteries, then hydrogen economy.
Result: Adani Green, Tata Power, NTPC Renewables saw huge investor inflows.
Case 3: Banking Recovery Post-2019
Theme: Financial inclusion and digital banking.
Sectoral Rotation: PSU banks outperformed after years of underperformance due to NPA cleanup.
Result: Bank Nifty became one of the best-performing indices by 2023.
Advantages of Sectoral Rotation & Thematic Trading
Be Ahead of the Curve – Spot where money is moving before the crowd.
Diversification with Focus – Instead of random stock-picking, you align with strong groups.
Capture Both Cycles & Megatrends – Short-term opportunities + long-term wealth creation.
Higher Conviction – Investing with logic and evidence reduces emotional decisions.
Challenges
Timing is Hard – Entering too early or too late in rotation reduces returns.
False Themes – Not every hyped theme sustains (3D printing, VR, etc.).
Global Dependence – Many Indian sectors are linked to global trends (IT, metals).
Information Overload – Too many narratives make it hard to pick the right one.
Conclusion
Sectoral rotation and thematic trading are not just buzzwords – they are powerful frameworks to navigate markets intelligently. Sectoral rotation teaches us that markets are cyclical, and different industries lead at different times. Thematic trading shows us that beyond cycles, there are megatrends shaping the future.
The best traders and investors combine both – timing their entries with sectoral strength while riding multi-decade themes.
In simple terms:
Follow the money (sector rotation).
Follow the future (themes).
Do this consistently, and you’ll not only trade like a pro but also invest like a visionary.
TSLA completing its complex correction ? keep a watchTSLA may be completing its complex correction before it starts its next impulse.,
This view is invalidated if it closes on weekly basis below : 138

TSLA Chart analysis -Daily Falling wedge BreakDown Target doneThis is a daily candlestick chart of Tesla Inc. (TSLA) with some technical analysis annotations. Here’s a breakdown of the key insights:
### **1. Price Action and Pattern:**
- The chart shows a descending triangle pattern that broke downwards.
- After breaking down from the triangle, the price dropped by **-113.47 points (-31.11%)** from the breakdown point.
---
### **2. Key Gap Zones:**
- ✅ **Gap 255 – 275 Range**
- Price recently filled or tested this gap zone.
- Currently consolidating near this range.
- ✅ **Gap 242 – 218 Range**
- If the price breaks below the current zone, the next key support is in this lower gap range.
---
### **3. Volume Profile:**
- High volume nodes are visible around **326–275**, suggesting strong historical trading activity (potential resistance).
- Current price near **262.67** shows declining volume, indicating possible indecision or lack of strong buying interest.
---
### **4. Support and Resistance Levels:**
- **Support:**
- Around **250.71** (previous low)
- Next major support at **209.84**
- **Resistance:**
- **273.35** (prior support turned resistance)
- **325.61 – 326.46** (volume profile resistance)
---
### **5. Volume Trend:**
- Volume has been elevated during the recent sell-off, indicating strong selling pressure.
- A reversal would need to see increased green volume and a hold above the 255–275 range.
---
### ✅ **Outlook:**
- If the price holds above **255**, a bounce toward **273–275** is possible.
- A break below **250** could trigger further downside toward the **242–218** range.
- Watch for volume confirmation and reaction near support/resistance zones for directional bias.
---

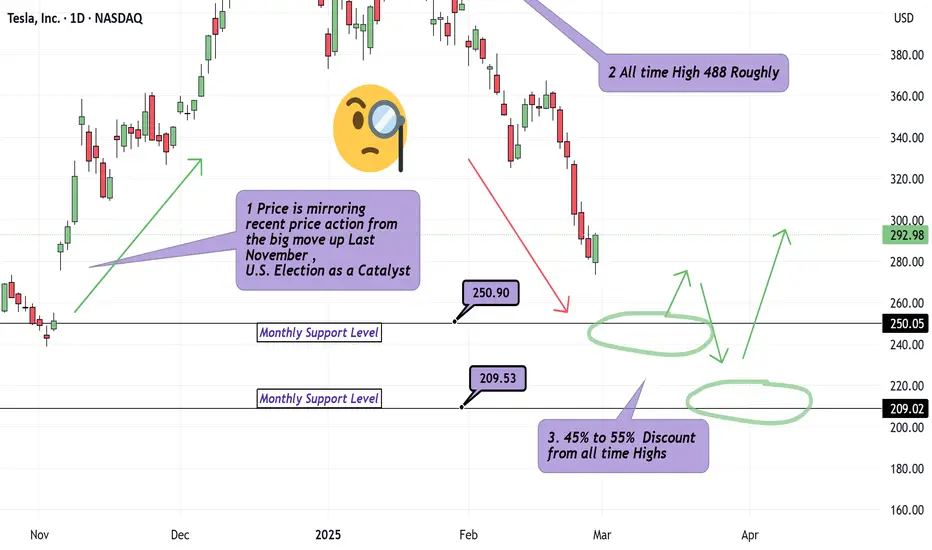
What is an Appropriate Tesla Discount? Multiple Timeframes!Hello Traders.. It's been too long.
We are back with our first analysis in over 4 months. We answer : What is an appropriate price to either jump on the train or scale into original positions on Tesla? Jumping in around 250, probably decent for at least a 4Hr to Daily Chart Swing. Safer Longs appear to be around 209 as I have outlined with green arrows, labeling the multiple pivots in the recent 5 Year range on Tesla. Tesla is coming down alongside the broader Indices which can be expected. Just because Friday Feb 28th showed us a Solid Hammer looking candle suggesting strong buying power, this does not mean much to me for 3 reasons.
1) This price action has developed in the middle of the move up we observed during Election week late last year.
2) The candle closed without a top wick and so the next daily candle , in theory, has no range to fill moving forward.
3) Momentum at the moment is also Bearish.
Discipline Traders! Leave a comment or Boosted rocket if you'd like to see similar analysis.
Possible Wave counts of TSLA Hourly & DailyDaily Time Frame Chart
I am not Sebi registered analyst.
My studies are for educational purpose only.
Please Consult your financial advisor before trading or investing.
I am not responsible for any kinds of your profits and your losses.
Most investors treat trading as a hobby because they have a full-time job doing something else.
However, If you treat trading like a business, it will pay you like a business.
If you treat like a hobby, hobbies don't pay, they cost you...!
Hope this post is helpful to community
Thanks
RK💕
Disclaimer and Risk Warning.
The analysis and discussion provided on in.tradingview.com/u/RK_Charts/ is intended for educational purposes only and should not be relied upon for trading decisions. RK_Charts is not an investment adviser and the information provided here should not be taken as professional investment advice. Before buying or selling any investments, securities, or precious metals, it is recommended that you conduct your own due diligence. RK_Charts does not share in your profits and will not take responsibility for any losses you may incur. So Please Consult your financial advisor before trading or investing.

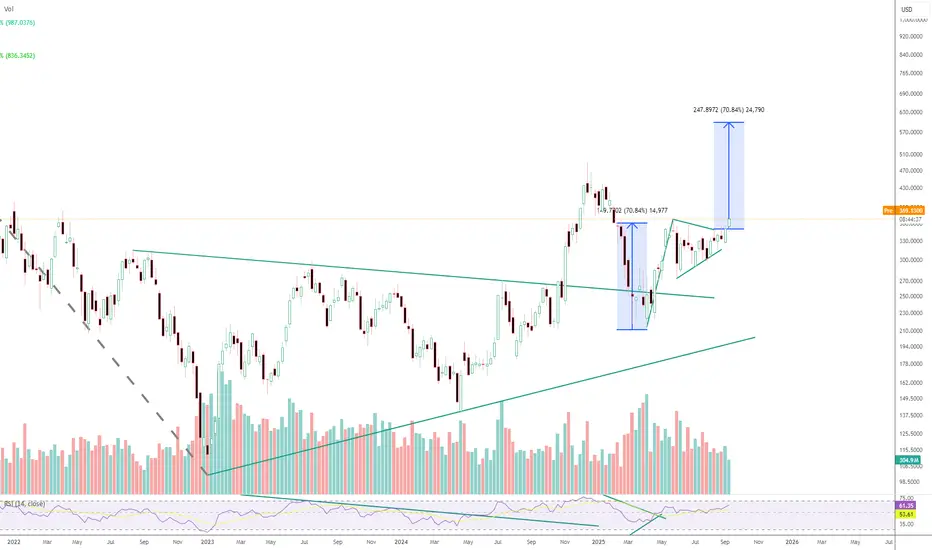
TSLA - WKLY- CnH-Symmetrical Triangle This chart shows Tesla's price on a weekly timeframe with key technical features:
1. **Cup and Handle Pattern**:
- A bullish reversal pattern formed over the past months, with two rounded bottoms resembling a "cup" shape and a minor consolidation area.
- The breakout above the resistance level confirms the pattern.
2. **Measured Move Targets**:
- **First Target**: $406.69, reached with a 48.95% move.
- **Second Target**: $489.24 for symmetrical triangle reflecting a 72.66% rise from the breakout.
3. **Key Resistance and Support Levels**:
- **Breakout Zone**: Around **$271.73**, the neckline of the cup and handle.
- **Intermediate Resistance**: Around **$406.69**.
- **Current Price**: Trading near **$463.02**.
4. **Volume**: Strong upward volume during the breakout phase, reinforcing the bullish breakout.
If the momentum continues, Tesla's price may target the next resistance near **$489.24**. Let me know if you need further insights!


TSLA: Ready for a Space Trip?As per chart action we all can see that TSLA is now heading upwards journey.
with TSLA now, umbrella company SPACEX is also doing good in its segment and TSLA is getting better opportunity to do manufacturing and enter in developing countries like india etc.
Also with Giga Factory expansion and making New Tesla cell technology
with that they can use that technology to take advantege in their new products also.
With current price(260) with target of new high (around 420-440) and with SL of 140.
It does not constitute and cannot replace investment advice. We therefore recommend that you contact your personal financial advisor before carrying out specific transactions and investments.

TSLA - Bottomed and ready to moveNot advice, just an observation. Price has bounced around at 233 MA on 4hr chart and looks like it's washed out. RSI has corrected from oversold and MACD cross will confirm.
Next level- $217 - 264

#TSLA $TSLA178 first time breakout
183 above 2nd breakout expected
190/195/200/205 expected to test
21 ema acting as a strong support

TESLA - Best Opportunity for Long Term InvestmentPrice is at extreme discount and provides opportunity for long term investment.
Price can violate the low around 101 and immediately target the buyside liquidity above 300.
Price may also fail to violate the sellside liquidity around 101 and continue higher indicating a failure swing reversal.
Both the scenario indicates bullishness in TESLA.

Tesla Inc Long Trade ideaTesla Inc Long Trade idea
Buying levels: Best Buying/Accumulation Zone between 260 to 272
Stop loss below 254
1st Target 291
2nd Target 323
3rd Target 350
Disclaimer:
I do not give any tips or buy sell recommendation I only teach trading strategies.
These levels are purely based on Price action/demand and supply zones & and consumed only for educational purpose & should not be taken as buy/sell recommendation. I will not be responsible for any loss/profit incurred if anyone takes trades based on my view.
Please consult your Financial Advisor before making any trading decision

Looking for LongTSLA formed descending channel which you can see on the left side of the chart which has been broken impulsively & forming a correction to make a move to the upside. Expecting target to reach at 425


Long Opportunity Below 200$TESLA is forming a correction & expecting to reach below 200$ looking for opportunity for long once its reached down below.

TSLA Down trend TSLA does not meet expectations in the ER and might go to support levels in next one month.


Elliott Wave Analysis of Tesla Bullish Perspective with CautionsHello Friends
Here we had shared study of Elliott wave analysis for Tesla A bullish perspective with cautions,
In the world of Elliott Wave theory, let's take a closer look at Tesla's chart. Here's what we found.
On an intermediate degree, we've witnessed the completion of two waves, elegantly labeled as "Wave (1)" and "Wave (2)." Currently, the spotlight is on "Wave (3)," which tends to bring about significant market changes.
Within Wave (3), we've ventured a step further by identifying "minor wave 1" of Wave (3). This delves into even greater detail, allowing us to see the inner workings of market dynamics.
Zooming in even closer, we've navigated the world of "minute" degrees within "minor wave 1." This revealing sub-waves (i), (ii), (iii), and (iv), setting the stage for what's next - the anticipated "sub-wave (v).
But that's not all. A promising development has occurred. Tesla has broken above the 0-B resistance trendline, signaling a potential shift in momentum and strengthening the case for a bullish scenario.
In summary, the Elliott Wave analysis suggests a bullish outlook for Tesla, with the breakout above the 0-B resistance trendline serving as a confirmation. Long positions are an option, with target levels set at 400 and 500, and potentially more. However, caution is warranted, with an invalidation level set at 101.81. If Tesla's price were to drop below this level, it could indicate a different scenario - a potential double correction as double (a)-(b)-(c) which we can label as "W-X-Y" within "Wave (2).
As always, no analysis is infallible, and surprises can still occur in the market. Risk management remains crucial. We'll eagerly await your further instructions to continue exploring Tesla's potential.
I am not sebi registered analyst. My studies are for educational purpose only. Please Consult your financial advisor before trading or investing. I am not responsible for any kinds of your profits and your losses.
Thanks
RK💕
Most investors treat trading as a hobby because they have a full-time job doing something else.
However, If you treat trading like a business, it will pay you like a business.
If you treat like a hobby, hobbies don't pay, they cost you...!
Disclaimer and Risk Warning.
The analysis and discussion provided on in.tradingview.com is intended for educational purposes only and should not be relied upon for trading decisions. RK_Charts is not an investment adviser and the information provided here should not be taken as professional investment advice. Before buying or selling any investments, securities, or precious metals, it is recommended that you conduct your own due diligence. RK_Charts does not share in your profits and will not take responsibility for any losses you may incur. So Please Consult your financial advisor before trading or investing.

SPX towards a new life high in sessions to comeCircle areas represent trendline support
strong reliable breakout in spx 500
it suggest US market to blast big from here and no surprise we can see all time high in month to come
the weekly breakout suggest continuation
