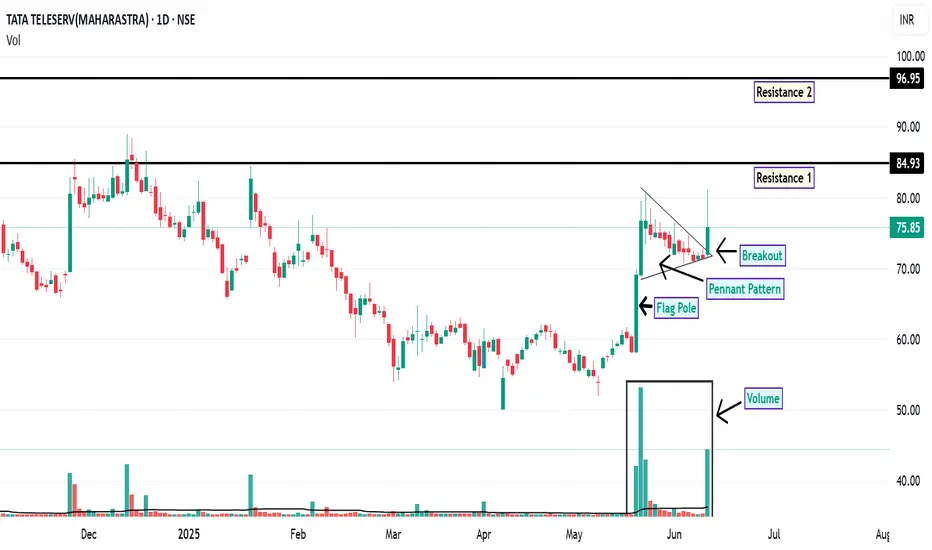
TTML: Pennant Breakout Signals Potential Upside
On the daily chart, TTML has recently exhibited a breakout from a pennant formation , a pattern often associated with potential continuation of the prevailing trend. This breakout is accompanied by a notable increase in trading volume, which may indicate growing market interest and participation.
Additionally, the price action has shown support at the 200-day EMA, a widely observed long-term trend indicator. This confluence of technical signals may suggest a strengthening bullish sentiment.
From a momentum perspective, both the RSI and MACD indicators are currently positioned in bullish territory on both the daily and weekly timeframes. This alignment across multiple timeframes can be interpreted as a sign of potential trend continuation.
Looking ahead, the price may revisit the ₹75 level, which could act as a demand zone. Should the stock manage to close and sustain above ₹76.40 , the next potential resistance levels to monitor are around ₹84.93 and ₹96.95 . For risk management, a suggested stop-loss level could be considered below ₹62 , based on recent support structures.
Disclaimer: This analysis is intended solely for informational and educational purposes. It does not constitute investment advice or a recommendation to buy or sell any financial instrument. Market participants are encouraged to conduct their own research or consult with a licensed financial advisor before making any investment decisions.
TTML
TTML: Unlocking Potential with Elliott WavesHello friends, Welcome to RK Chaarts.!
Let’s analyse the chart of Tata Teleservices Maharashtra Limited from an Elliott wave perspective.
We can see that in March 2023, the stock formed a bottom around 49.65 and then moved upwards in an impulse wave. We can identify wave one as complete, ending around the July 2024 high.
After that, there was a sudden fall to the April 2025 low, which we assume to be the end of wave two. We expected it to reverse around the previous low, because wave II cannot retrace more than 100% of wave I (Elliott wave principles), and Same happened, it had reversed from that low to upside.
Looking at the weekly chart, we can see that post wave II, price has broken the 0-B trend line with strong volume intensity. If our wave counts are correct, we can measure wave I and project wave III’s target using Trend based Fib extensions as per Elliott wave theory.
According to the theory, wave III target could be around 150.70, which is 1.618 times the length of wave I.
Projected Targets as per Elliott waves:
So, friends, from an Elliott wave perspective, Tata Teleservices has strong potential to move upwards to around 150 rupees, with potential targets at 88, 112, 127, and 150 rupees.
Invalidation levels:
Please note that this analysis is for educational purposes only and involves multiple possibilities. The scenario presented focuses on one potential outcome, assuming the invalidation level of 49.65 is not triggered. If it is triggered, the chart would need to be reassessed, and wave counts would need to be reevaluated.
This is not a tip or advisory, but rather a educational analysis.
I am not Sebi registered analyst.
My studies are for educational purpose only.
Please Consult your financial advisor before trading or investing.
I am not responsible for any kinds of your profits and your losses.
Most investors treat trading as a hobby because they have a full-time job doing something else.
However, If you treat trading like a business, it will pay you like a business.
If you treat like a hobby, hobbies don't pay, they cost you...!
Hope this post is helpful to community
Thanks
RK💕
Disclaimer and Risk Warning.
The analysis and discussion provided on in.tradingview.com/u/RK_Charts/ is intended for educational purposes only and should not be relied upon for trading decisions. RK_Chaarts is not an investment adviser and the information provided here should not be taken as professional investment advice. Before buying or selling any investments, securities, or precious metals, it is recommended that you conduct your own due diligence. RK_Chaarts does not share in your profits and will not take responsibility for any losses you may incur. So Please Consult your financial advisor before trading or investing.

TTML Smashes Resistance After 3-Month Base MASSIVE 18% SURGE MASSIVE 18% SURGE in NSE:TTML Smashes Resistance After 3-Month Base - The Perfect Breakout Trade Blueprint! Also made a Beautiful Chart Structure of Kinda Triple Bottom Reversal Pattern today after Good Price and Volume action.
Price Action Analysis:
NSE:TTML is currently experiencing a significant bullish move, trading at ₹69.09 with an impressive 18.65% gain (₹10.86). The stock has made a decisive breakout from a well-defined range that had contained prices since March 2025. Today's powerful green candle has cleanly broken above the resistance zone at ₹62-64, showing strong momentum and conviction from buyers.
Volume Analysis:
The volume is exceptionally strong at 105.91M shares versus the average of 7.99M—over 13 times normal volume. This massive spike in participation confirms the legitimacy of the breakout and suggests institutional buying. High volume on breakouts is a classic confirmation signal that increases the probability of continued upward movement.
Support & Resistance Levels:
- Major Resistance (Now Broken): ₹62-64 zone (horizontal red box)
- Next Major Resistance: ₹74-76 area (upper horizontal red line)
- New Support: ₹62-64 (previous resistance now becomes support)
- Strong Base Support: ₹54-56 (multiple green arrows showing successful tests)
Technical Patterns:
1. Triple Bottom: Multiple tests of the ₹54-56 support zone (marked with green arrows) showing strong accumulation
2. Range Breakout: Clear break above the 3-month consolidation range between ₹54 and ₹64
Trade Setup:
- Entry Point: ₹68-70 on any minor pullback today or tomorrow
- Stop Loss: ₹61.50 (just below the broken resistance zone)
- First Target: ₹74-76 (previous resistance level)
- Second Target: ₹84-86 (previous swing high from December)
- Final Target: ₹95 (measured move projection from the range breakout)
Risk Management:
- Position sizing: Maximum 2% of trading capital at risk
- Risk-Reward Ratio: Approximately 1:1.5 based on the entry and the second target.
- Trailing stop: Once price moves above ₹76, move stop loss to breakeven, then trail below each higher low
Additional Insights:
The stock has formed a solid base over three months with multiple tests of support around ₹54-56, allowing for accumulation before this explosive move. The prior downtrend appears to have been arrested, with higher lows forming since March. The breakout comes with exceptional volume confirmation, suggesting this isn't a false move but potentially the beginning of a new uptrend.
The prior resistance at ₹74-76 (horizontal red line at the top) will be critical; clearing this level would confirm a complete trend reversal and potentially lead to a test of the December 2024 highs near ₹84-86.
Traders should be vigilant about potential pullbacks to the breakout zone (₹62-64), which would provide ideal secondary entry opportunities with tighter stop losses. The exceptional volume and percentage gain indicate strong momentum that could carry prices significantly higher in the coming weeks.
Keep in the Watchlist.
NO RECO. For Buy/Sell.
📌Thank you for exploring my idea! I hope you found it valuable.
🙏FOLLOW for more
👍BOOST if you found it useful.
✍️COMMENT below with your views.
Meanwhile, check out my other stock ideas on the right side until this trade is activated. I would love your feedback.
Disclaimer: "I am not a SEBI REGISTERED RESEARCH ANALYST AND INVESTMENT ADVISER."
This analysis is intended solely for informational and educational purposes and should not be interpreted as financial advice. It is advisable to consult a qualified financial advisor or conduct thorough research before making investment decisions.

Ttml Ttml wonderful tradeline breakout .ready for 100/110 .closing above 110+ daily ttml turn out to b pushpa.. me jukega nahi ...150/200 minimum target

TTML near IMP AreaHey Family, there is a one more stock Which is showing a great opportunity.
Key Points:-
* Formation of Ascending Triangle pattern in daily & Weekly TF.
* From Aug 2023 to July 2024 its in range.
* It's Near resistance Zone and trying to Break Resistance Zone with good volume.
* If resistance zone is break then we can see a good move.
* Volume Accumulation all time high volumes (Volume is Rising).
What is your view please comment it down and also boost the idea this help to motivate us. We are Certified. All views shared on this channel are my personal opinion and is shared for educational purpose and should not be considered advise of any nature.

TTML - Swing Trade Analysis - 17th July #stocksTTML (1W TF) - Swing Trade Analysis given on 17th July, 2024
Pattern: RECTANGLE BOX BREAKOUT
- Weekly Resistance Breakout Initiated - Done ✓
- Weekly Volume Buildup at Resistance - Done ✓
- Demand Zone Retest & Consolidation (for a small SL and a better RR) - In Progress
* Disclaimer

TTMLTTML :- wait for breakout
Hello traders,
As always, simple and neat charts so everyone can understand and not make it too complicated.
rest details mentioned in the chart.
will be posting more such ideas like this. Until that, like share and follow :)
check my other ideas to get to know about all the successful trades based on price action.
Thanks,
Ajay.
keep learning and keep earning.

TTML - SWING TRADE - 19th December #stocksTTML (1D TF)
Swing Trade Analysis given on 19th December, 2023 (Tuesday)
Pattern: FALLING WEDGE BREAKOUT
- Falling Wedge Breakout + Consolidation - Done ✓
- Neckline Breakout - Done ✓
- Volume Spike- Done ✓
#stocks #swingtrade #chartanalysis #priceaction #traderyte #ttml

TTML | Investment Pick📊 Details
Tata Teleservices Ltd is engaged in the business of Wired and wireless telecommunication activities and holds a Unified License with Access Service Authorisation in Maharashtra and Goa and also as in Internet Service Provider Category The co. is focused on providing various wireline voice, data, and managed telecom services.
Disclaimer: This analysis is solely for educational purposes and does not make me a SEBI registered analyst.
If you found this analysis helpful, I encourage you to like and share it. Your observations and comments are also welcomed below. Your support, likes, follows, and comments motivate me to consistently share valuable insights with you.
🔍 More Analysis & Trade Setups 🔍
For more technical analysis and trade setups, make sure to follow me on TradingView: www.tradingview.com

TTML - Bullish Consolidation Breakout with VolumesNSE: TTML is closing with a bullish consolidation breakout candle supported with volumes.
Today's volumes and candlestick formation indicates strong demand and stock should move to previous swing highs in the coming days.
The stock has been moving along the horizontal support for the past few days which is indicating demand.
One can look for a 8% to 12% gain on deployed capital in this swing trade.
The view is to be discarded in the event of the stock breaking previous swing low.
#NSEindia #Trading #StockMarketindia #Tradingview #SwingTrade


TTML Daily looking bullishTTML Daily has trendline breakout/inverted head and shoulder breakout with 200 ema support on daily candle.
Good to buy at retracement near 72 for target of 99 with sl below 67

stocks #TTML SELL,BUY OPPORTUNITYLIKE OUR IDEAS============
POOR RESULT DRAG DOWN ,BETTER OPPORTUNITY FOR SELL BELOW 90 TGT-75/60/45.
NEW DEAL,AGREEMENT MAY BOOST UPSIDE BUY ABOVE 120 TGT-140/200 .
sIMPLY comments for any stock analysis.=====

TTML Daily Flag and Pole BO BullishTTML Daily has flag n pole BO with 200 ema support.
Good to buy at 140 for target of 229 and 289 with SL of 111

TTML, TATA TELESEVICES It gives breakout on two three parameters although now everything is dependent on coming market behaviors but it is looking very much fine on charts

TTML Lower Circuit Rally Stock has been on lower circuits from ATH level of 290..
Let's see if it finds support around 190-200 (Fibb. Retracement 38.2%)
or
will it see the levels of 130-40 (Fibb. Retracement 61.8%)
Dislcalaimer: View for Educational purpose only not to be taken as trading/investment advice

Tata Teleservices (TTML)Tata Teleservices has settled AGR dues case with the Government of India by issuing shares at Rs.41.5 and hence, I feel there should be a deep correction in this stock. I have marked the addition zones (where one can pick stocks and add to their position).


