UBL (United Breweries) – Weekly Swing Trading PlanUBL (United Breweries) – Weekly Swing Trading Plan (Educational)
Structure overview
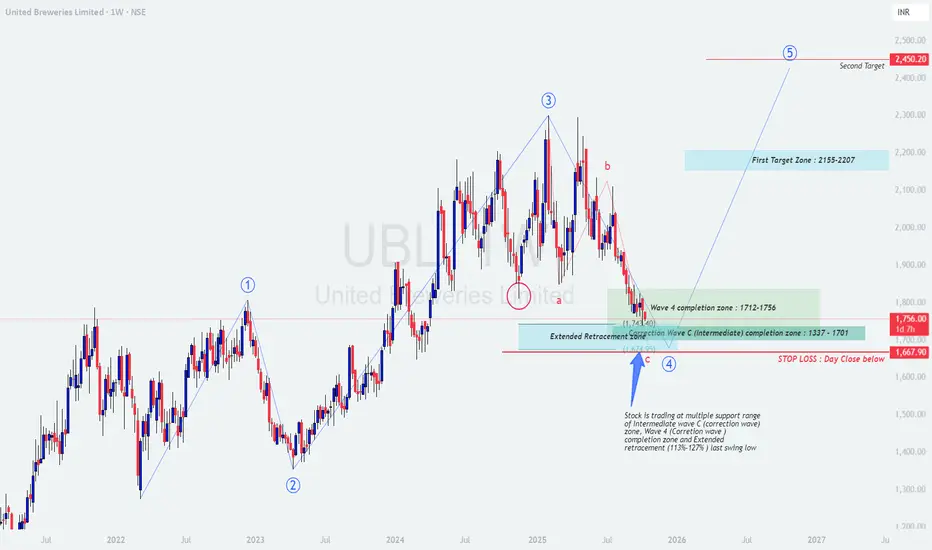
Price has completed a multi‑month corrective leg into a confluence support cluster: Wave‑4 completion zone 1712–1756 overlaps with the projected Wave‑C (intermediate) completion band 1701–1337 and the extended retracement window from the last swing 113%–127%. The market is attempting to base near this cluster with downside risk defined by the recent swing low.
Bias is accumulation-to-reversal as long as price holds above the invalidation level; confirmation improves on weekly higher low and break of the prior supply shelf.
Levels and plan
Buy zone (staggered): 1712–1756 for initial probes; add on confirmation above 1785–1800 on daily close.
Invalidation / Stop: Weekly or daily close below 1668 (recent low zone). If that fails, expect deeper extension into 1630/1600; stand aside and reassess.
Trigger confirmation: Bullish weekly candle with RSI/MACD positive cross or a daily structure break above 1825–1850 accompanied by rising volume.
First target zone: 2155–2207 (prior supply/FE confluence). Scale out 50–70% in this band.
Second target: 2450 area (projected Wave‑5/FE 1.0–1.272). Trail remainder using weekly higher‑low method.
Risk‑to‑reward: From a 1735 midpoint entry with 1668 stop, risk ≈ 67 points; to T1 midpoint 2180, reward ≈ 445 points (R≈6.6). Adjust to your execution.
Execution notes
Start with partial size in the zone; add only on strength (close back above broken EMAs or structure).
If price spikes into 1712–1756 and rejects with long lower wicks, use the next day’s high break as the tactical trigger.
If price closes below 1710 but recovers the next session and re‑enters the band, treat it as a bear trap only with clear momentum confirmation.
Trail stops to breakeven after a daily close above 1850; shift below each higher swing low on the way to T1.
Option tactics (if using derivatives)
Bull call spread when cash closes above 1825–1850: e.g., buy ATM call, sell +200 to +300 OTM to cap cost and decay.
For accumulation within 1712–1756, consider a calendar call to benefit from time if expecting a slower turn.
Exit or roll if price loses 1710 decisively; do not hold naked longs through invalidation.
Risk management
Position sizing : Risk a fixed % of equity per idea (commonly 0.5–1%) based on the distance to 1668.
Staggered entries reduce timing risk; never add if invalidation is threatened.
Respect weekly closes; a weekly close below 1668 cancels the bullish thesis until a fresh base forms.
Summary
Thesis: Corrective Wave‑C likely terminating around 1712–1756, setting up a potential Wave‑5 advance if 1668 holds.
Plan: Accumulate in 1712–1756, confirm above 1825–1850, aim T1 2155–2207 and T2 ~2450, with invalidation on a daily/weekly close below 1668.
Disclaimer: This post is for education, not investment advice or a trade recommendation; I am not a SEBI registered analyst .
UBL
UNITED BREWERIES LTD. (UBL) – Bullish Setup from Demand Zone📈 UNITED BREWERIES LTD. (UBL) – Bullish Setup from Demand Zone | Price Action + Volume Analysis
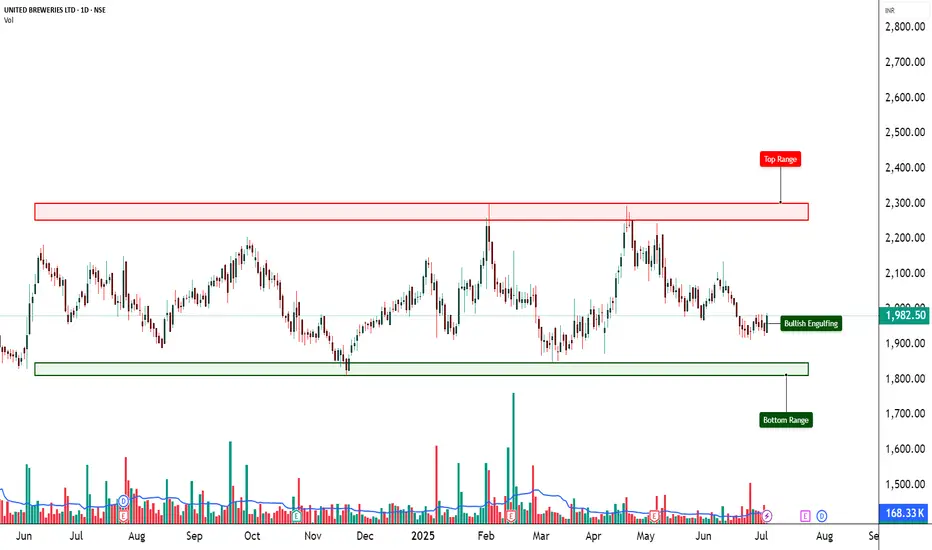
🕒 Chart Type: Daily
📆 Date: July 3, 2025
🔍 What’s Catching Our Eye:
UBL has printed a strong bullish engulfing candle from the bottom range of ₹1,848, a zone that has historically acted as demand support. This move is happening after multiple tight sessions, suggesting potential breakout energy. While the candle shows strength, volume is unusually low, indicating the need for confirmation before high-conviction entries.
📊 Volume Footprint:
Despite the bullish candle, volume is not supportive. The breakout attempt lacks wide participation. This could either be a low-volume trap or a smart money accumulation zone. Look for a follow-up candle with higher volume for confirmation.
🧠 Technical Outlook & Trade Reasoning:
UBL has rebounded from its demand zone with a textbook bullish engulfing. Price action suggests momentum may follow, but the lack of volume signals a need for patience. Ideal scenario would be a high-volume green candle in the next session for breakout confirmation.
If volume picks up, swing traders can look for entries near ₹1,985–1,995, keeping SL at ₹1,922, and targeting ₹2,080–2,150 in the short term. A sustained move toward ₹2,300 is possible only if the intermediate zones are taken out with strength.
📌 Current Setup Details:
Entry Level: ₹1,988.00
Stop-Loss (SL): ₹1,922.20 (Risk per share: ₹65.80)
Master Level Confidence: 89.91% (as per STWP system)
⚠️ Invalidation Levels:
Close below ₹1,922 (SL level)
Breakdown below ₹1,848 (Demand Zone) on high volume
⚠️ Disclaimer:
This analysis is shared for educational and informational purposes only.
STWP is not a SEBI-registered advisor.
This is not a buy/sell recommendation.
Always consult your financial advisor before making investment decisions.
💬 Found this helpful?
Share your thoughts in the comments ⬇️
🔁 Spread the insight with fellow traders
✅ Follow STWP for smart technical setups backed by volume and price action
🚀 Let’s trade with patience, logic, and clarity!
UBL Looking Good For A SwingNSE:UBL is Looking Good for a Short-Term Swing With RSI and MACD Trending Up and Price Action Crossing Key Levels respecting Upward Trendline.
📌Thank you for exploring my idea! I hope you found it valuable.
🙏FLLOW for more
👍BOOST if useful
✍️COMMENT Below your views.
Meanwhile, check out my other stock ideas below until this trade is activated. I would love your feedback.
Disclaimer: This analysis is intended solely for informational and educational purposes and should not be interpreted as financial advice. It is advisable to consult a qualified financial advisor or conduct thorough research before making investment decisions.

UBL in Rising ChannelNSE:UBL is in a rising channel in the daily time frame with good volume and can continue its upward move to ATH Levels.

Descending Channel pattern breakout in UBLUNITED BREWERIES LTD
Key highlights: 💡⚡
✅On 1 Hour Time Frame Stock Showing Breakout of Descending Channel Pattern.
✅Strong Bullish Candlestick Form on this timeframe.
✅It can give movement up to the Breakout target of 2145+.
✅Can Go Long in this Stock by placing a stop loss below 2095-.

UBL is ready for Correction UBL us around the long term Resistance !!
UBL may correct around 2200-2300 level if Resistance is not broken
Also if anyone already has the stock then they may use trailing Stop Loss to limit their Loss and to book Maximum profits from it
Also Stock is making Broadening Pattern on a Daily timeframe
If stock sustain above 2200-2300 levels then It will be multiyear breakout and we can see huge upsidde in months to come
But for now Its around the resistance !!
Thank You !!

Double Moving Average Crossover - UBL📊 Script: UBL
📊 Sector: Alcoholic Beverages
📊 Industry: Breweries & Distilleries
Key highlights: 💡⚡
📈 Script is trading at upper band of BB and giving Breakout of it.
📈 MACD is giving crossover .
📈 Double Moving Averages are giving crossover.
📈 Right now RSI is around 68.
📈 One can go for Swing Trade.
⏱️ C.M.P 📑💰- 2035
🟢 Target 🎯🏆 - 2219
⚠️ Stoploss ☠️🚫 - 1950
⚠️ Important: Always maintain your Risk & Reward Ratio.
✅Like and follow to never miss a new idea!✅
Disclaimer: I am not SEBI Registered Advisor. My posts are purely for training and educational purposes.
Eat🍜 Sleep😴 TradingView📈 Repeat 🔁
Happy learning with trading. Cheers!🥂

UBL AnalysisUBL having a good bullish setup. Pulled back after a strong breakout. Belonging from FMCG sector which is building strength. UBL being the early bird, looks well poised to go up.

UBL C&H BREAKOUT WCBUBL breaking c&h pattern
#weekly basis,good volume building up
macd crossover done
trading at ATH
#target 2400
#positional trading
EDUCATIONAL IDEA

United Breweries (UBL) Daily ChartChart Type: Heikin Ashi
Timeframe: Daily
Technical Data:
Support Zone: 1535 to 1551
Upside Target 1: 1602
Upside Target 2: 1687
Downside Target 1: 1472
Trendline: Positive
1472 Level : Strong Support
Moving Averages: negative
Bollinger Bands:
Volatility Range: 1502 to 1669

Based on technical analysis, UBL exhibits strong upward momentumBullish sentiment prevails in the technical analysis of the asset, with indicators suggesting potential for upward price movement.
Enter 1620-1630
Target 1700,1750++

UBL - LONGUBL chart is showing a clear cup and handle breakout.
Breakout is supported by a great volume as indicated in the chart.
In near term, chances of it going upto 1850 are high.
Target: 1,850
SL: 1,560
It's my view, please do your due delligence!

UBL C&H BREAKOUT ON WCBUBL also breaking C&H on WCB
huge volume
strong RSI
target can be 1786
educational idea only

UBL C&H BREAKOUTUBL breaking C&H pattern
huge volume
trading above all key ema
#weekly basis also same breakout
check weekly chart also posted👆
educational idea only

Short Term Trade UBLOn higher time frame (4 hrly chart), the stock is trading in a rising parallel channel (marked as purple lines)
Accordingly, price found support at the levels around 1506 (demand zone)
On sept 1, Price reversed from that level, the rise from there is accompanied with rise in volume, and bullish candles, and rise in ATR
Keep SL below the rising purple supportline
Thus, there is a short term trade , tgt and sl are marked on chart

UBLUBL :- Those who are planning an aggressive trade can do so in this stock after the breakout of level 1557.75 and those who are planning a very safe trade can do so after the breakout of level 1606.05.
Hello traders,
As always, simple and neat charts so everyone can understand and not make it too complicated.
rest details mentioned in the chart.
will be posting more such ideas like this. Until that, like share and follow :)
check my other ideas to get to know about all the successful trades based on price action.
Thanks,
Ajay.
keep learning and keep earning.

UBL cup & handle pattern on weekly chartsuggest me if this is right or wrong.
seeing a cup & handle pattern and expecting trend continuation if breakout is given

#UBL... Looking good 30.05.23#UBL...
Intraday as well as swing trade
All levels given in charts ...
IF good potential seen then we work in options also
if activate then possible a good movement Keep eye on this ...
We take trade only when it activates...
Possible to give good target
TRADING FACTS

UBL Continuation Pattern📉 Alert! Bullish Pattern Spotted 🐻
📊 Pattern: Bullish Continuation Wedge Pattern
📌 Symbol/Asset: UBL
🔍 Description:
Overall bullish stock seems to have Bullish Trend Continue in days to come
👉 Remember: Technical patterns are just one piece of the puzzle. Consider conducting further research, consulting with a financial advisor, and managing your risks appropriately.


UBL Brewing down to its Major Support ??!!!Chart patterns look apt for a short trade in UBL
REASONS
1. In Monthly time frame, UBL has been trading inside an Ascending channel pattern taking support and resistance at perfect levels till now. (shown below)
2. Right now, it is under its down swing move inside the Ascending channel pattern
3. In Daily timeframe , Bearish Flag pole pattern developing and due for BREAKDOWN!!! (shown below)
4. In 4 hr time frame, it is looking good to enter the trade ( STRUGGLING TO MAKE HIGHER HIGH)
5. Entry can also be after a 2hr breakdown out of the flag pattern(pink line)
6. Target(bright green)& strict SL(bright red) levels mentioned as Horizontal dashed lines
Let's wait & watch how it moves!!!!
NOTE - Just sharing my view....not a tip nor advice!!!
Regards,
mmjimm ;-)

