UJJIVANSFB: Testing IPO High with Triple Top, Chart of the MonthFrom IPO Highs to Recovery: Is Ujjivan Small Finance Bank Finally Breaking Out After Six Years? After Posting Robust Q3 FY26 Numbers with asset quality improving and Micro Finance Cycle Turning Back. Let's Analyze in "Chart of the Month"
As per the Latest SEBI Mandate, this isn't a Trading/Investment RECOMMENDATION nor for Educational Purposes; it is just for Informational purposes only. The chart data used is 3 Months old, as Showing Live Chart Data is not allowed according to the New SEBI Mandate.
Disclaimer: "I am not a SEBI REGISTERED RESEARCH ANALYST AND INVESTMENT ADVISER."
This analysis is intended solely for informational purposes and should not be interpreted as financial advice. It is advisable to consult a qualified financial advisor or conduct thorough research before making investment decisions.
Price Action:
- Current Price: ₹63.06
- 52-Week High: ₹68.00
- 52-Week Low: ₹13.90
- Distance from All-Time High: Approaching IPO highs after prolonged consolidation
Volume Spread Analysis:
Volume Characteristics:
- Base Period (2020-2023): Subdued volumes indicating consolidation
- Breakout Period (2024-present): Notable volume expansion
- Recent spike visible in January 2026 showing institutional participation
- Current volume: 442.36M (significantly above 20-day average of 271.01M)
- Volume surge of 63% suggests strong conviction in the breakout
Volume-Price Relationship:
- Price advance accompanied by rising volume - bullish confirmation
- No negative divergences observed
- Accumulation visible during base formation with sporadic volume spikes
Base Formation & Major Patterns:
Rounding Bottom Pattern (2020-2025):
- The stock has carved out a massive rounding bottom base spanning approximately 5 years
- The blue curved trendline marks the U-shaped recovery trajectory
- Base Formation Period: Mid-2020 to Late-2024
- Base Depth: From ₹65-68 levels down to ₹13.90 (approximately 80% decline)
- This extended consolidation suggests thorough distribution at lower levels and strong accumulation
Cup and Handle Formation:
- A textbook cup & Handle pattern is visible in the 2019-2025 period
- Left rim formed in early 2024 at ₹65
- Cup bottom at ₹30-35 range (2024-2025)
- Right rim currently forming at ₹63-68 levels
- Handle consolidation occurred during late 2025
Support & Resistance Levels:
Major Resistance Zones:
- R1 (Immediate): ₹65.00-68.00 (IPO highs)
- This level may act triple top resistance (2020, 2024, 2026)
- Critical breakout zone - sustained move above this unlocks higher targets
- R2 (Psychological): ₹70.00
- R3 (Extension Target): ₹85-90 (measured move from base)
Major Support Levels:
- S1 (Immediate): ₹55.00-58.00 (recent breakout zone)
- S2 (Strong): ₹45.00-48.00 (rounding bottom neckline)
- S3 (Critical): ₹30.00-35.00 (2024-2025 lows, base support)
Trend Analysis:
Long-Term Trend:
- The stock was in a prolonged downtrend from 2020 to 2022
- Transitioned into consolidation/basing phase from 2022 to 2024
- Currently attempting to reverse into an uptrend as of late 2025/early 2026
Medium-Term Trend:
- Strong uptrend established from November 2024 onwards
- Higher highs and higher lows pattern intact
- Moving along the upper channel of the rounding bottom
Short-Term Momentum:
- Explosive momentum in January 2026 (+19% move)
- Stock attempting to reclaim IPO highs for the second time
- Price action suggests breakout on cards from 6-year consolidation
Key Technical Observations:
Breakout Attempt #2
- This is the "2nd time to break IPO Highs"
- First attempt in early 2024 failed, leading to a correction
- Current attempt appears stronger with better fundamentals and volume support
- Risk of triple top failure exists if price fails at ₹65-68 zone again
Risks & Triple Top Persistence:
- The ₹65-68 zone has proven to be formidable resistance over 6 years
- Three distinct peaks at this level (2020, 2024, 2026) create triple top risk
- A decisive close above ₹68 with sustained volume would negate this pattern
- Failure here could lead to another correction toward ₹45-48 support
Fundamental & Sectoral Backdrop:
Recent Financial Performance (Q3 FY26):
Profitability Metrics:
- Net Profit: ₹186 crore (up 71% YoY from ₹109 crore)
- Sequential Growth: 53% QoQ from ₹121.72 crore in Q2 FY26
- Nine-Month Performance: ₹411 crore (down 36% YoY) - signals recovery from challenging period
- Net Interest Income: ₹1,000 crore (all-time high, up 12.8% YoY)
- Interest Earned: ₹1,752 crore (all-time high, up 16.12% YoY)
Balance Sheet Growth:
- Gross Loan Book: ₹37,057 crore (up 21.6% YoY)
- Total Deposits: ₹42,223 crore (up 22.4% YoY)
- Disbursements: ₹8,293 crore (highest ever quarterly disbursements)
- Credit-Deposit Ratio: 88% (healthy and stable)
- CASA Ratio: 27.3% (up from 25.1% YoY)
Asset Quality Improvement:
- Gross NPA: 2.45% (improved from 2.68% in December 2024)
- Current position better than historical average of 4.84%
- Portfolio at Risk (PAR): 3.98% (down from 4.44% QoQ and 5.36% YoY)
- Provisions: ₹195 crore (down from ₹235 crore in Q2, signaling improvement)
- Micro banking collection efficiency: 99.70% (December 2025)
Business Strategy & Positioning:
Portfolio Diversification:
- Shift from unsecured microfinance to secured lending
- Secured portfolio: ₹17,829 crore (up 48.8% YoY), now 48.1% of total book
- Growth in housing loans, MSME finance, gold loans, vehicle loans, and agri loans
- Microfinance exposure reducing as part of risk mitigation strategy
Target Market:
- Focus on financially underserved segments
- Mass market banking for economically active poor customers
- Operating since 2005 (as NBFC), became Small Finance Bank in 2017
- Strong presence in rural and semi-urban markets
Growth Drivers:
- Record quarterly disbursements driven by all-around performance
- Unsecured and secured products both contributing
- Digital transformation initiatives underway
- Branch network expansion supporting deposit mobilization
Key Concerns:
- Nine-month profit decline of 36% YoY raises sustainability questions
- Non-operating income constituted 121% of PBT in Q3 (concerning dependency)
- Stretched valuations with limited margin for error
- Success hinges on sustaining Q3 momentum
Small Finance Bank Sector Outlook:
Industry Growth Trajectory:
- SFB sector growing at 20-25% CAGR
- Total advances projected to exceed ₹2 trillion by FY26
- Deposits reached ₹3.15 lakh crore in FY25
- Expected to grow to ₹3.77 lakh crore in FY26
Regulatory Environment:
- RBI reduced priority sector lending norms from 75% to 60% in June 2025
- Provides greater flexibility for credit diversification
- Pathway to universal banking license for qualifying SFBs
- AU Small Finance Bank received approval for universal bank transition they can do it too
Sector Challenges:
- Asset quality stress in microfinance portfolios across sector is Improving
- GNPA in microfinance segment spiked to 6.8% in FY25 from 3.2% in FY24
- High operating costs (5.5% of assets vs 2% for broader banking sector)
- Net Interest Margins declining sector-wide (from 7.4% to 6.6%)
- Modest CASA ratios (26.2% average) leading to higher cost of funds
- Return on Assets dropped from 2.1% to 1.0% in FY25 across SFBs
Competitive Landscape:
- Competition from commercial banks, fintech lenders, NBFCs
- Pressure on margins due to intense competition
- Need for continuous digital transformation
- Branch-intensive operating model with mandated rural presence
Microfinance Industry Trends:
Market Size & Growth:
- Microfinance sector loan portfolio: ₹3.48 lakh crore (as of December 2024)
- Expected to reach ₹5 lakh crore by FY27
- Serving over 8 crore clients across India
- Sector contributes 2-3% to India's GVA
Recent Developments:
- 80% growth in loan disbursals in recent periods
- Digital transformation accelerating across industry
- Focus on financial literacy programs
- RBI regulatory changes providing operational flexibility
- Asset quality challenges persist with over-leveraging concerns
Risk Factors:
- Vulnerable to regional economic shocks
- Weather-dependent borrower segments
- Competition from traditional banks entering microfinance space
- Regulatory compliance requirements
- Portfolio concentration risks in certain geographies
Risk Assessment:
Technical Risks:
- Triple top pattern risk at ₹65-68 resistance zone
- Failure to decisively break IPO highs could trigger profit booking
- Potential pullback to ₹48-55 support if breakout fails
- Overextended short-term momentum
Fundamental Risks
- Sustainability of Q3 profit recovery remains unproven
- High reliance on non-operating income
- Microfinance asset quality pressures sector-wide
- Operating cost structure higher than traditional banks
- Modest CASA ratio impacting cost of funds
Sector Risks:
- Regulatory changes impacting business model
- Competition intensifying from multiple fronts
- Economic slowdown could impact borrower repayment capacity
- Regional concentration exposing to local risks
Bull Case Scenario:
- Successful breakout above ₹68
- Strong Q3 FY26 results indicate operational turnaround
- Asset quality improvement trajectory well-established
- Secured lending mix improving risk profile
- Potential universal banking license in future
- Sectoral tailwinds from financial inclusion drive
Bear Case Scenario:
- Failure at ₹65-68 resistance for third time
- Nine-month profit decline raises sustainability concerns
- Sector-wide margin compression continues
- Asset quality deterioration in microfinance segment
- High operating costs pressuring profitability
- Regulatory headwinds or policy changes
My 2 Cents:
NSE:UJJIVANSFB presents an interesting technical setup the stock is at a critical juncture - attempting to break out from a 6-year consolidation. Success above ₹68 could unlock significant upside, while failure creates triple top risk. The fundamental improvement supports the technical breakout attempt, but sustainability remains a key question mark given the nine-month profit decline.
Full Coverage on my Mid-Week Newsletter coming Wednesday.
Keep in the Watchlist and DOYR.
NO RECO. For Buy/Sell.
📌Thank you for exploring my idea! I hope you found it valuable.
🙏FOLLOW for more
👍BOOST if you found it useful.
✍️COMMENT below with your views.
Meanwhile, check out my other stock ideas on the right side until this trade is activated. I would love your feedback.
As per the Latest SEBI Mandate, this isn't a Trading/Investment RECOMMENDATION nor for Educational Purposes; it is just for Informational purposes only. The chart data used is 3 Months old, as Showing Live Chart Data is not allowed according to the New SEBI Mandate.
Disclaimer: "I am not a SEBI REGISTERED RESEARCH ANALYST AND INVESTMENT ADVISER."
This analysis is intended solely for informational purposes and should not be interpreted as financial advice. It is advisable to consult a qualified financial advisor or conduct thorough research before making investment decisions.
UJJIVANSFB

UJJIVANSFB AnalysisUjivan SFB taking support at 10 and 20 weighted moving averages and AVWAP drawn from recent swing highs. On balance volume OBV is also rising. Chances of inclined trendline breakout. SL 2.30% which is well below ADR level of 2.76.

Ujjivan SFB (D): Strongly Bullish, Testing 5-Year ResistanceThe stock is staging a powerful recovery from its 2025 lows. It is currently challenging a critical "confluence resistance" zone (₹54-₹56) that dates back to Feb 2020. A breakout here would trigger a major structural shift.
📈 1. The Long-Term Context (The "U-Shape" Recovery)
- The Fall: After hitting its All-Time High (ATH) of ₹63 in Dec 2023, the stock entered a steep 15-month correction, losing ~51% of its value by early 2025.
- The Recovery: Since March 2025, the stock has been in a steady uptrend, effectively creating a large "Rounding Bottom" or "Cup" structure.
- The "Lid" (Feb 2020 Resistance): The ₹54 – ₹56 zone is not just a random level; it aligns with the major structural resistance from February 2020 (pre-COVID highs). Breaking this would mean clearing a 5-year hurdle.
🚀 2. The Fundamental Catalyst (The "Why")
The recent bullishness is supported by improving fundamentals, which validates the technical breakout:
- Record Disbursements: In the recent Q2 results, the bank reported its highest-ever quarterly disbursements , signaling strong business growth.
- Asset Quality: Stable asset quality is attracting institutional interest, as seen in the volume spike.
💥 3. Today's Price Action (Nov 26, 2025)
- The Surge: The stock surged +3.84% , closing near the day's high.
- Volume Expansion: The move was backed by massive volume of 30.09 Million shares.
- Volume Trend: This spike comes after a period of declining volume , which is a classic "volatility contraction" setup. The sudden expansion today confirms fresh buyer participation.
📊 4. Technical Indicators
- EMAs: Short-term EMAs are in a PCO (Price Crossover) state across Monthly, Weekly, and Daily timeframes, confirming aligned bullish momentum.
- RSI: The Relative Strength Index is rising across all three timeframes, showing that momentum is accelerating into the breakout.
🎯 5. Future Scenarios & Key Levels
The stock is currently inside the breakout zone.
- 🐂 Bullish Case (Breakout):
- Trigger: A decisive weekly close above ₹56 .
- Target: The primary target is a retest of the ATH at ₹63 . Beyond that, the stock enters "blue sky" price discovery.
- 🐻 Bearish Case (Rejection):
- Trigger: If the 5-year resistance (₹56) proves too strong and sellers step in.
- Support: The stock would likely fall back to the ₹53 level (immediate support) or the 20-day EMA to gather more strength.
Conclusion
The setup is highly potent because it combines a technical recovery with a 5-year structural breakout attempt. Watch for a sustained close above ₹56 to confirm the run to ₹63 .

UJJIVANSFB : LongThe price has broken out above a multi-month resistance level near ₹51, now trading at ₹53.52. The next visible resistance and target is set around ₹60.92.
The 10 EMA and 20 EMA (Exponential Moving Averages) are plotted as two closely tracking lines. The price is above both, indicating short-term and medium-term bullish momentum.
The 200 EMA acts as a long-term trend guide and support; the price is comfortably above this, strengthening the bullish case.
Volume bars show increased activity during the recent breakout, confirming buying interest which supports the strength of the move.
The MACD (Moving Average Convergence Divergence) consists of the MACD line (2.25), the Signal line (1.60), and the Histogram (0.65). The MACD line being above the Signal line and both above zero indicate strong bullish momentum.
The RSI (Relative Strength Index) reads 67.23, above the neutral 50 level and approaching the overbought zone (70). This shows heightened bullish momentum but warns that the asset is getting closer to an overbought condition.
Conclusion
1. Bullish breakout from multi-month consolidation, supported by rising price above all key EMAs.
2. Momentum is strong as shown by MACD and RSI, though RSI is nearing overbought territory.
3. Volume confirms the breakout, supporting the upward move.
4. Next resistance/target is projected near ₹60.92 as marked on the chart.
This setup favors continuation towards the next resistance, but minor pullbacks are possible as the RSI gets closer to overbought levels. Risk management should take the recent breakout point as a possible stop-loss reference.

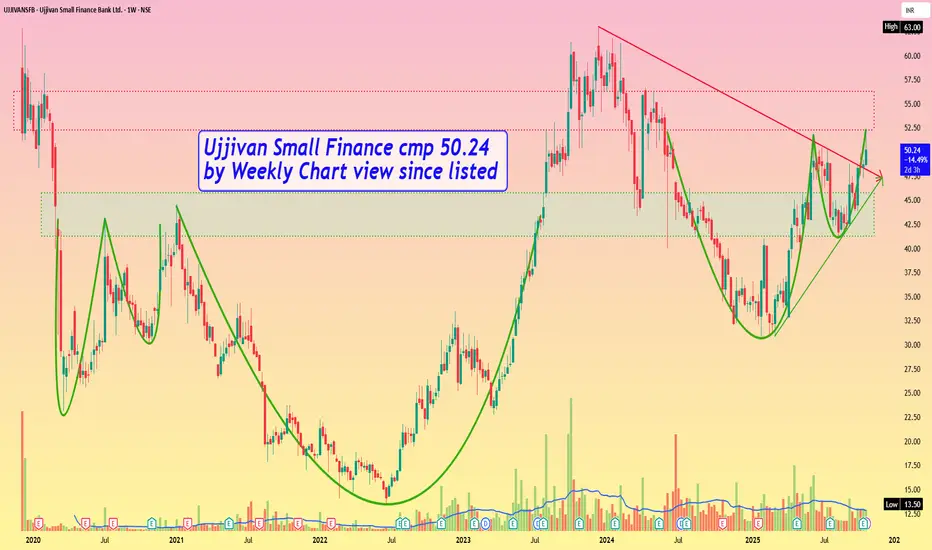
Ujjivan Small Finance cmp 50.24 by Weekly Chart view since listeUjjivan Small Finance cmp 50.24 by Weekly Chart view since listed
- Support Zone 41.25 to 45.75 Price Band
- Resistance Zone 52.25 to 56.25 Price Band
- Bullish Cup & Handle formed by Resistance Zone neckline
- Volumes spiking intermittently by a close sync with avg traded qty
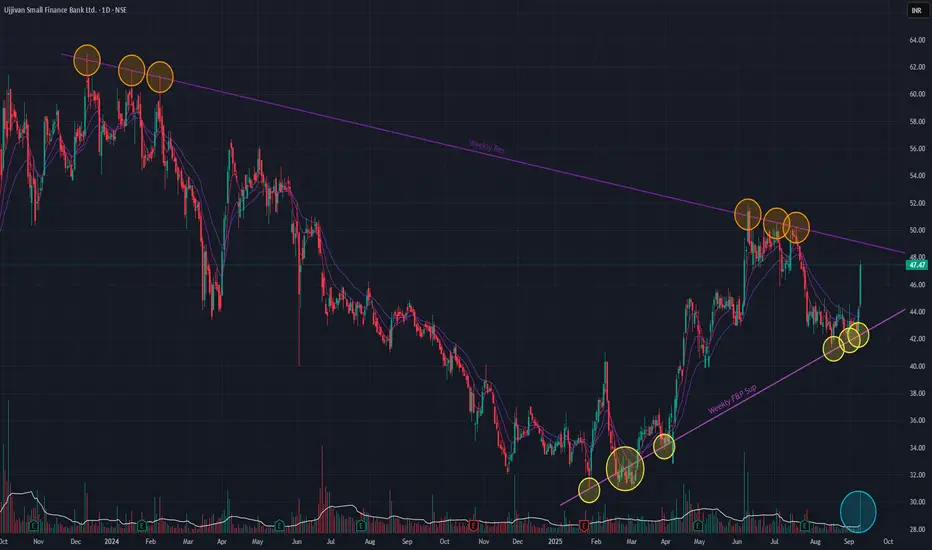
Ujjivan SFB (Daily Timeframe) - Potential BreakOut Candidate ??Ujjivan has been on a downtrend since making the ATH in Dec 2023. Since Feb 2025, there has been a reversal where the stock is making Higher Lows while respecting the support trendline. Since the ATH, the stock has attempted several occasions to BreakOut of the angular resistance trendline, but failed. The past two days there has been a surge in stock price accompanied by huge volume, showing bullishness. Short-term EMAs are also in a PCO state.
Let's wait for the stock to BreakOut of the resistance trendline. Keep monitoring!!
UJJIVANSFB long IdeaUJJIVANSFB looks good in a range between 50 and 200ema. Today It took 50 ema as resistance. Good above 50ema.
Stoploss is given. Targets are also given. Weekly chart is shown in image for higher trend which shows cup and handle is forming.
NOTE : Risk management is Important. No idea about Fundamentals. Just Technical View.

Ujjivan Small Finance Bank-Breakout from Downtrend!Ujjivan Small Finance Bank—Breakout from Downtrend! 🔥
📆 Date: April 9, 2025
📊 Chart Analysis:
UJJIVANSFB has convincingly broken out of a long-standing falling trendline, indicating renewed bullish momentum. The breakout is supported by a strong bullish candle and above-average volume, suggesting a potential trend reversal.
📌 Key Levels:
🛑 Resistance (Breakout Zone): ₹38
✅ Support (Base Formation): ₹30.95
🔼 Immediate Resistance Levels: ₹42, ₹46, ₹50
📈 Indicators & Observations:
📉 Downtrend line broken after multiple rejections—a bullish sign.
🔍 RSI at 67.5—approaching the overbought zone but showing strong momentum.
📊 Volume surge at 32.46M suggests institutional interest and confirmation of breakout.
📌 RSI Bullish Label (Green “Bull” icon) confirms momentum strength earlier.
🧠 Strategy Ideas:
Retesting near the ₹37–₹38 zone can be a buy-on-dip opportunity.
Targets: ₹42 ➡️ ₹46 ➡️ ₹50
SL: Below ₹36 (trendline)
📌 Disclaimer: This analysis is for educational purposes only. Always do your own research or consult a SEBI-registered advisor before investing

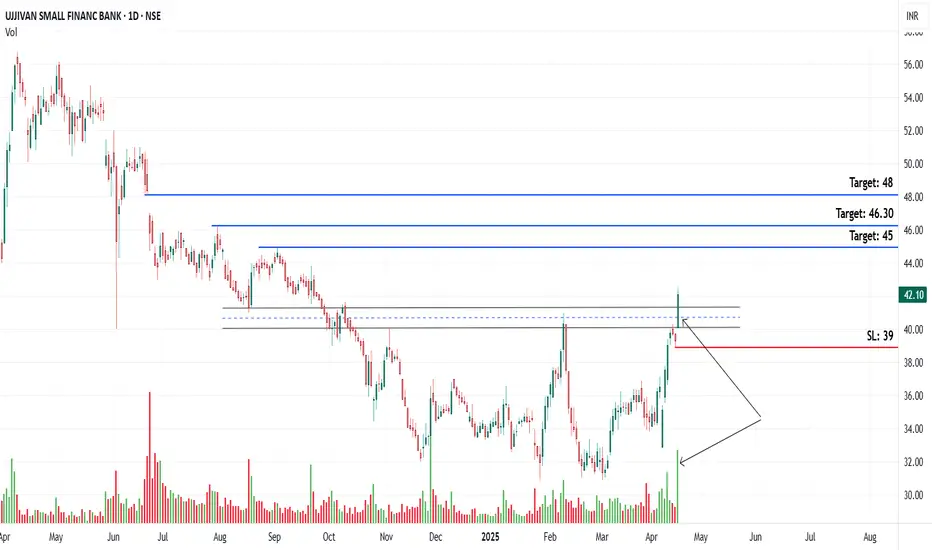
Banks in focus, chart: 5 UjjivanChart -> Ujjivan Daily
CMP: 42
Good Range to Buy: 40 to 42
Targets: 45, 46.30, 48
SL: 39 Daily Close
Disclaimer: This is for educational purposes only, not any recommendations to buy or sell. As I am not SEBI registered, please consult your financial advisor before taking any action.
Ujjivan Small Finance Bank to Go up in Mid Term and Long TermUjjivan Small Finance Bank has crossed its resistance trendline. Considering the fundamentals, the bank may struggle in mid term but a uptrend following the breakout is very likely in the near future.
Monthly Stochastic RSI also suggests that the stock is oversold right now, which indicates a reversal in a few months.

Ujjivan Small Finance Bank Builds Momentum for Rebound◉ Since its launch, the stock has faced a dramatic decline, dropped nearly 80% from its peak.
◉ Once it found support around the 12.5 mark, the stock began to rise again, formed an Inverted Head & Shoulders pattern in the process.
◉ After breaking out, the price surged to an all-time high near the 61 level, only to experience another notable drop.
◉ At present, the stock is trading at the previous breakout point and is expected to rebound shortly.

UJJIVANSFB Trading Within Fresh Demand ZoneUJJIVANSFB is currently trading at ₹34, positioned within its demand zone between ₹34.5 and ₹33.55, established on 30th May 2023. This fresh zone has not yet been tested, indicating potential buying interest around these levels. Investors may consider observing this range for signs of support, which could trigger a rebound.

Ujjivan Small Finance bank good to study NSE:UJJIVANSFB
Its on Near to support of FIB ZONE
Good to keep on the radar
Always respect SL & position sizing
========================
Trade Secrets By Pratik
========================
Disclaimer
NOT SEBI REGISTERED
This is our personal view and this analysis
is only for educational purposes
Please consult your advisor before
investing or trading
You are solely responsible for any decisions
you take on basis of our research.

UJJIVANSFB 50% Retracement Complete NSE:UJJIVANSFB This one is also good Retracement 50% dONE Stock Wait for the Day and Weekly Closing Guys

UJJIVANUJJIVAN:- Stock has formed cup and handle pattern, plan something only after breakout till then keep an eye on the stock
Hello traders,
As always, simple and neat charts so everyone can understand and not make it too complicated.
rest details mentioned in the chart.
will be posting more such ideas like this. Until that, like share and follow :)
check my other ideas to get to know about all the successful trades based on price action.
Thanks,
Ajay.
keep learning and keep earning.

Possible 20% upside finance stock Buy UJJIVAN SMALL FINANC BANK
Around 59-60
Stop Loss: 57.8 (2Rs)
Target 1: 63.80
Target 2: 65.80
Target 3: 71
Possible 20% upside
Trade as per your risk reward.

UJJIVANSFB: 2 mth Breakout UJJIVAN SMALL FINANCE BANK (UJJIVANSFB) is breaking out of a 2 month parallel channel with good volumes. Huge volumes and RSI uptick.

Long Setup in Ujjivan Small Financ BankA bullish flag & pole Chart Pattern Breakout completed on the Weekly Time frame of NSE:UJJIVANSFB
Price Action nees to be supported by volume.
The stock is currently in uptrend making higher highs and higher lows.
One can add this stock into their stocks to buy list and initiate the long trade as per the levels mentioned on the chart
Stop loss will be on a weekly closing basis.
Trend Analysis :- UP Trend
Chart Pattern :- Bullish flag & pole Chart Pattern
Technical Indicator :- Positive MACD Crossover
Disclaimer: This is for Educational Purpose only.

UJJIVANSFB: Formed a Cup & Handle PatternUjjivan Small Finance Bank formed a Cup & Handle Pattern and started give breakout from 34 level.
Stock can be accumulated around 36-37 level.
T1 is expected at 38 and T2 is expected around 43. Overall expected target is 53
Set stoploss at 28 and increase the stoploss when stock moves up.
Pattern is tracked on weekly chart.
Disclaimer:
This idea is only for education purpose, Please consult your financial advisor.
I am not SEBI registered.

ujjivan financial service 450 ?after a very good consolidation against trendline of falling wedge. we can se a break in trendline of ujjivan financial we can long this share at current price for 450

UJJIVANSFB - Long Setup, Move is ON..NSE:UJJIVANSFB
✅ #UJJIVANSFB trading above Resistance of 34
✅ Next Resistance is at 44
Related charts:
Charts are self-explanatory. Levels of breakout, possible up-moves (where stock may find resistances) and support (close below which, setup will be invalidated) are clearly defined.
Disclaimer: This is for demonstration and educational purpose only. This is not buying or selling recommendations. I am not SEBI registered. Please consult your financial advisor before taking any trade.

Ujjivan Fin servLong ujjivan Fin services only after the BO of Both TL marked on the charts. Long avove 180 Target 220-250 with SL 150. Good risk to reward trade. This is for your educational purpose only.

Falling wedge on UJJIVANSFB 1W - great time to buy The Falling Wedge is a bullish pattern that begins wide at the top and contracts as prices move lower. This price action forms a cone that slopes down as the reaction highs and reaction lows converge. In contrast to symmetrical triangles, which have no definitive slope and no bias, falling wedges definitely slope down and have a bullish bias. However, this bullish bias cannot be realized until a resistance breakout occurs.
My idea is to take the RSI into account which is breaking out the trend line.
