UPL Limited approaching Prev ATH - Technical AnalysisUPL Limited - #Breakout Setup After #Accumulation Phase
Current Price: 691.07
Good For Swing to Short-term Trading.
Technical Summary:
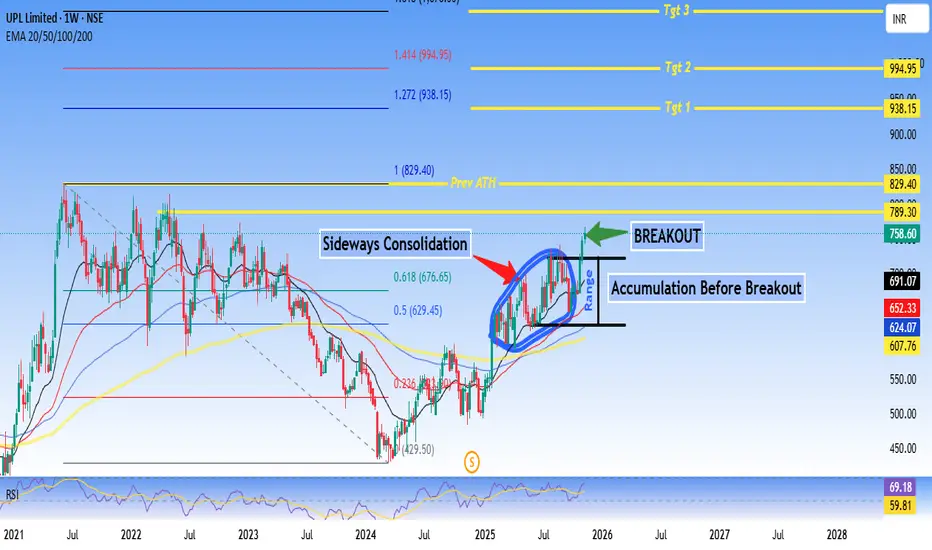
UPL is showing a classic accumulation-to-breakout pattern after an extended sideways #consolidation phase. The stock has broken out from a well-defined range with strong volume confirmation and is now positioned for potential upside momentum.
Key Technical Highlights:
✅ Breakout Confirmed: Price breaking above 768 resistance zone with volume expansion
✅ Accumulation Phase Complete: Extended consolidation (2024-2025) suggesting smart money accumulation
✅ EMA Alignment: 20/50/100/200 EMAs converging and starting to fan out bullishly
✅ RSI Strength: At 69.18, showing momentum without being overbought
✅ Fibonacci Levels: Currently between 0.236-0.5 retracement, plenty of upside room
Price Targets:
- Target 1: 938.15 (+35% from current levels)
- Target 2: 994.95 (+44%)
- Target 3: 1,050+ (Extended target)
Support Levels:
- Immediate: 676 (0.618 Fib)
- Strong: 629 (0.5 Fib + breakout level)
- Critical: 607 (20 EMA)
Risk-Reward: Favorable at current levels with defined support zones and multiple upside targets.
Disclaimer:
This analysis is for educational and informational purposes only and should NOT be considered as financial advice or a recommendation to buy/sell any security.
- Technical analysis is based on historical price patterns and may not predict future performance - Past performance is not indicative of future results - Trading and investing involve substantial risk of loss - Always conduct your own research and due diligence - The author may or may not hold positions in the discussed security - Price targets are projections based on technical levels and not guaranteed outcomes - Market conditions can change rapidly, invalidating technical setups - Use appropriate position sizing and risk management strategies
** Trade at your own risk. You are solely responsible for your trading/investment decisions.**
#UPL #TechnicalAnalysis #Breakout #Accumulation #StockMarket #NSE #SwingTrading #ChemicalSector #FibonacciRetracement #RSI
UPL
UPL Limited – Weekly Chart Analysis
📊 UPL Limited – Weekly Chart Analysis
Company Overview:
UPL Limited is a global leader in sustainable agricultural solutions, ranked among the top five agricultural solutions companies worldwide. The company operates across multiple countries, offering an integrated portfolio of patented and post-patent agricultural solutions for both arable and specialty crops — including biologicals, crop protection, seed treatment, and post-harvest solutions.
UPL is principally engaged in:
Production and sale of agrochemicals, field crops, and vegetable seeds
Non-agro business of industrial chemicals, chemical intermediates, and speciality chemicals
With market access across the world’s food basket, UPL is focused on driving growth and innovation throughout the entire agricultural value chain — from growers to distributors and partners. 🌱
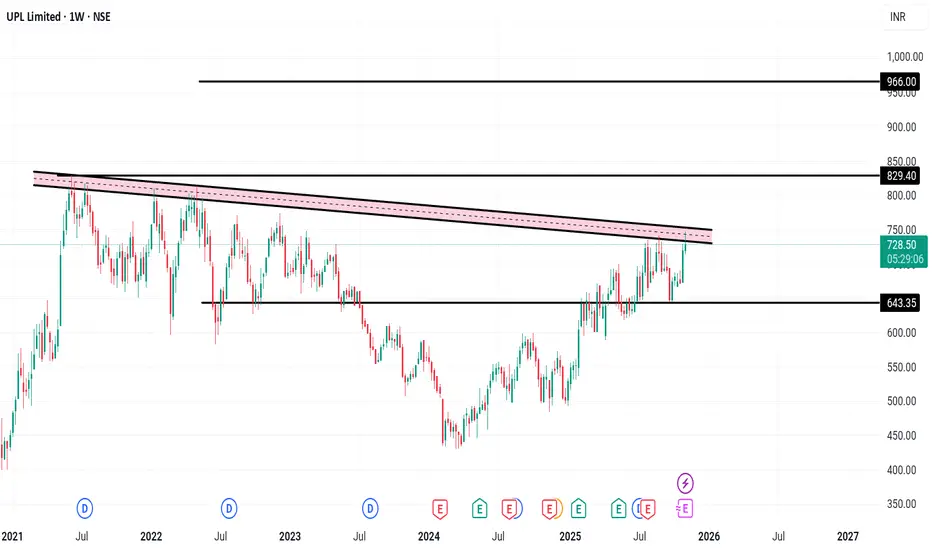
📈 Technical View (1-Week Chart):
A trendline formation is observed on the weekly timeframe, indicating a potential breakout setup.
Resistance: ₹830 – strong resistance zone. A breakout above this level can trigger the next target near ₹930.
Support: ₹643 – strong support base.
This formation suggests the move could take time to play out, as it’s developing over the weekly chart.
📊 Key Financial Snapshot:
UPL’s current market price is around ₹724.15 with a P/E ratio of 11.65. The company holds a market capitalization of ₹61,068.53 crore and offers a dividend yield of 0.83%.
In the latest quarter, net profit stood at ₹612 crore, reflecting a 125.74% increase compared to the previous quarter. Quarterly sales were ₹12,019 crore, showing an 8.38% rise. The company’s Return on Capital Employed (ROCE) is 7.66%, indicating stable operational efficiency.
Disclaimer: For educational purposes only, not investment advice
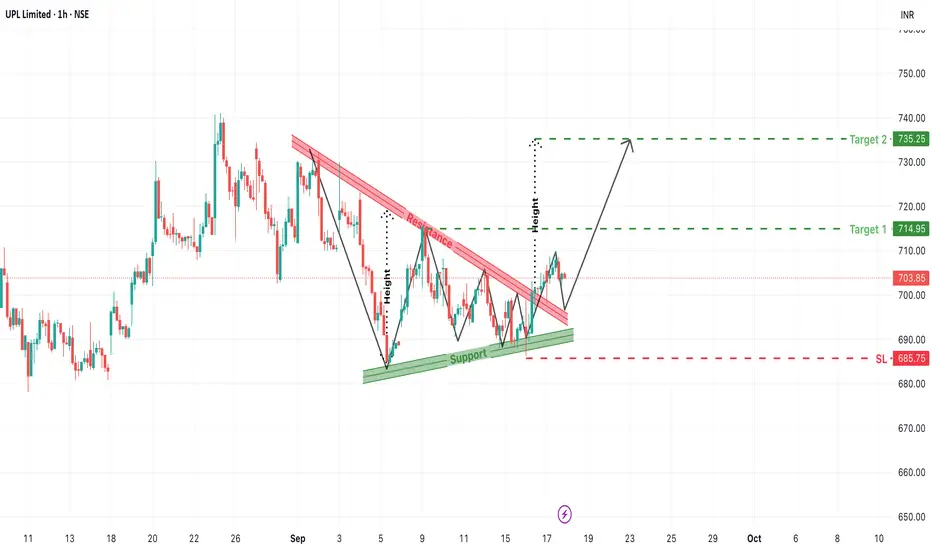
UPL Breakout from Falling Wedge: Bullish Continuation Ahead?The chart for UPL Limited (1-Hour, NSE) presents a promising bullish breakout scenario, emerging from a well-defined falling wedge (descending channel). Traders and investors watching for breakout opportunities will want to monitor this move closely as the price breaks above resistance with potential to test higher levels.
1. Chart Pattern Formation: Falling Wedge with Bullish Implication
Over the past several trading sessions, UPL consolidated inside a downward sloping wedge pattern characterized by:
- Lower highs and lower lows, creating a narrowing channel.
- The support trendline consistently held the price near 685–690 levels.
- The resistance zone, marked with a red trendline, was tested multiple times before finally breaking out.
- This kind of pattern often precedes a trend reversal or continuation to the upside, especially when it forms after a prior bullish move.
2. Breakout Confirmation: Clean Move Above Resistance
- Price has broken out of the descending resistance, closing above ₹703+.
- This breakout came with a retest of the support and is now showing signs of resuming upward momentum.
- The price structure now signals the end of the downtrend inside the wedge and potential bullish continuation.
3. Target Projections Using Pattern Height
The measured height of the wedge pattern provides us with two price targets:
- Target 1: ₹714.95
The first logical resistance and Fibonacci extension zone.
- Target 2: ₹735.25
Based on full height projection of the wedge breakout.
These targets are calculated from the breakout level and are aligned with historical price action levels.
4. Stop Loss and Risk Management
- Suggested Stop Loss (SL): ₹685.75
Just below the support zone and wedge structure to avoid false breakouts.
- Entry Zone:
Around current levels of ₹703–704 or on dips near ₹700–701 if retest occurs.
- Risk-Reward Ratio:
Around 1:2.5 for T2, offering good upside with controlled risk.
5. Key Technical Takeaways
- Pattern: Falling Wedge (Bullish Reversal/Continuation)
- Breakout Zone: ₹703+
- Support Zone: ₹685–688
- Momentum Bias: Bullish (as long as price holds above support)
- Risk Zone: Below ₹685
- Reward Zone: ₹715 to ₹735
Conclusion: UPL Gearing Up for a Short-Term Rally
UPL has triggered a classic technical breakout from a falling wedge, backed by a retest and bounce from support. As long as price sustains above ₹685, bulls may drive the stock toward the upper targets of ₹715 and ₹735. The chart offers a low-risk, high-reward setup ideal for short-term swing traders.
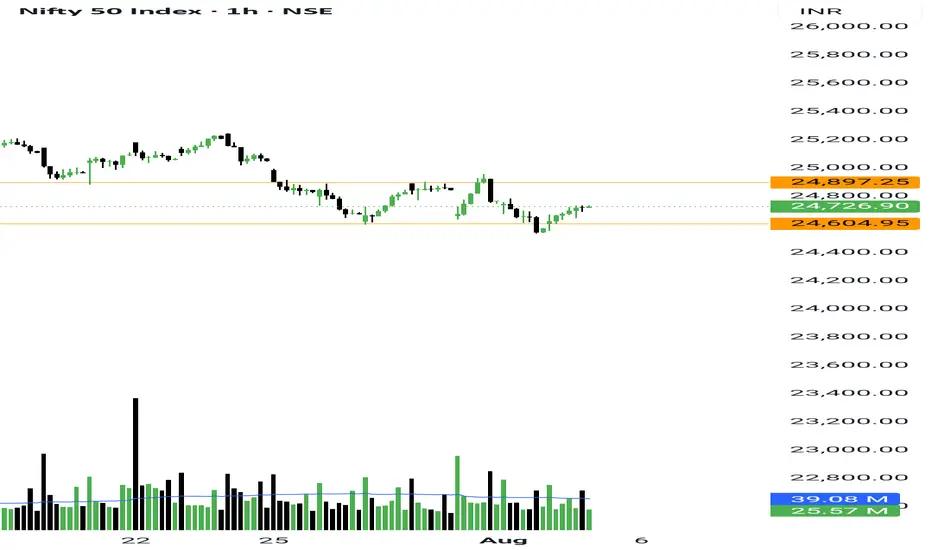
Banknifty and Broader Market improved. Nifty still lagging behinAs I mentioned in yesterday’s commentary — if NSE:NIFTY stays above the Pivot level of 24,628, we may see an upmove. And that’s exactly what happened.
Now, Nifty's Pivot has moved up to 24,671.
If Nifty opens below this and stays below it, we might see a down move again.
The Pivot Percentile is 0.21%, which means the move can be sharp in whichever direction the market goes.
The good sign is that on the Intraday chart, Nifty is shifting from a downtrend to an uptrend.
But on the Daily chart, the downtrend is still clearly visible.
Also, in the last hour of trade yesterday, buyers’ volume dropped from 37 million to 26 million, which is a bit concerning.
Putting everything together, the market can remain sideways today.
But keep in mind — if Nifty crosses the Pivot and holds above it, we might again see an upside move.
Today’s Important Levels:
- Support: 24,695
- Resistance: 24,800
NSE:BANKNIFTY looks strong today.
Its Pivot is at 55,603 and the Pivot Percentile is just 0.03% — this means the range is tight, and a sharp move can come soon.
If BankNifty crosses and holds above 55,752, we may see a strong upmove.
And if BankNifty goes up, Nifty can also follow.
Sector Focus:
The Auto sector looks strong today. You can look for good intraday setups there.
How my recent trades performed:
1. NSE:ATHERENERG – Up 14.01%
2. NSE:DELHIVERY – Up 7.39%
3. NSE:UPL – Up 7% (Still holding)
4. NSE:GMDCLTD – Up 6.98%
5. NSE:CUPID – New All-Time High, Up 5.78%
6. NSE:PARADEEP – Up 4.97%
7. NSE:IXIGO – Up 5.19%
8. NSE:CDSL – Up 6.33%
9. NSE:GENUSPOWER – Up 5.15%
That’s all for today.
Take care and have a profitable day ahead!
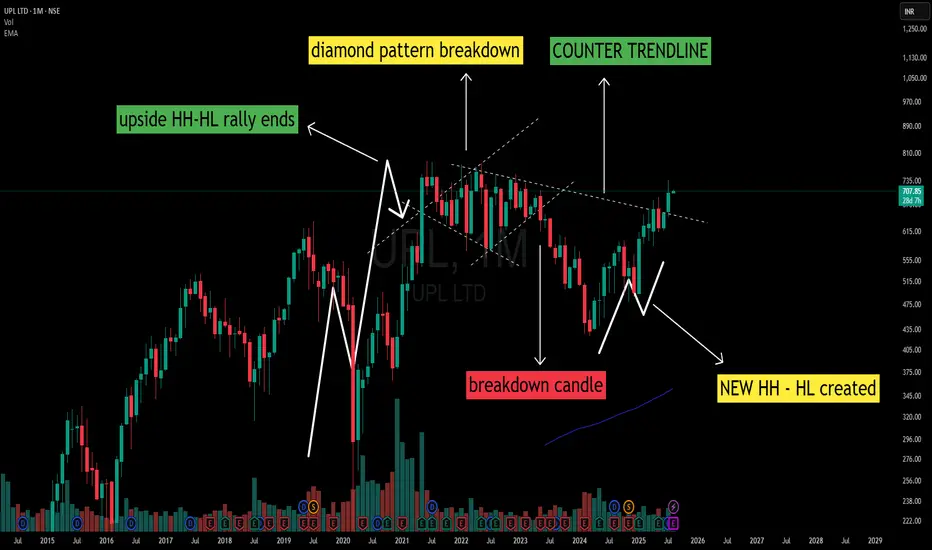
UPL – Diamond Pattern Breakdown to W-Bottom Reversal The monthly chart of UPL reflects a complete structural cycle:
1️⃣ Uptrend Phase:
A clear sequence of Higher Highs – Higher Lows (HH-HL) marked the early rally.
2️⃣ Diamond Pattern at Peak:
A diamond-shaped consolidation developed at the top of the rally, a common occurrence near trend maturity.
3️⃣ Breakdown & Downtrend:
A breakdown candle from the diamond pattern initiated a period of Lower Highs – Lower Lows (LH-LL), establishing a sustained downtrend.
4️⃣ W-Bottom Formation:
At the lower structure, a W-bottom emerged with Higher Low formation followed by a Higher High, indicating a structural shift.
5️⃣ Counter Trendline Interaction:
The earlier diamond pattern boundary has evolved into a counter trendline, now serving as an important structural reference zone.
📌 Observation:
The counter trendline remains a key structural reference on higher timeframes. This is a technical observation and not a directional view.
UPL LTD BREAKOUTUPL LTD has broken through its weekly trend line and is now showing bullish momentum after a short period of consolidation. The next target is the all-time high, which traders may aim for. A suitable stop-loss could be placed at either 650 or 600, depending on individual risk appetite.
On the financial front, UPL's latest quarterly results for the period ending March 2025 show solid performance. The company reported a revenue of Rs 15,573 crore, along with a net profit of Rs 1,106 crore. Its Earnings Per Share (EPS) for the quarter stood at Rs 11.42.

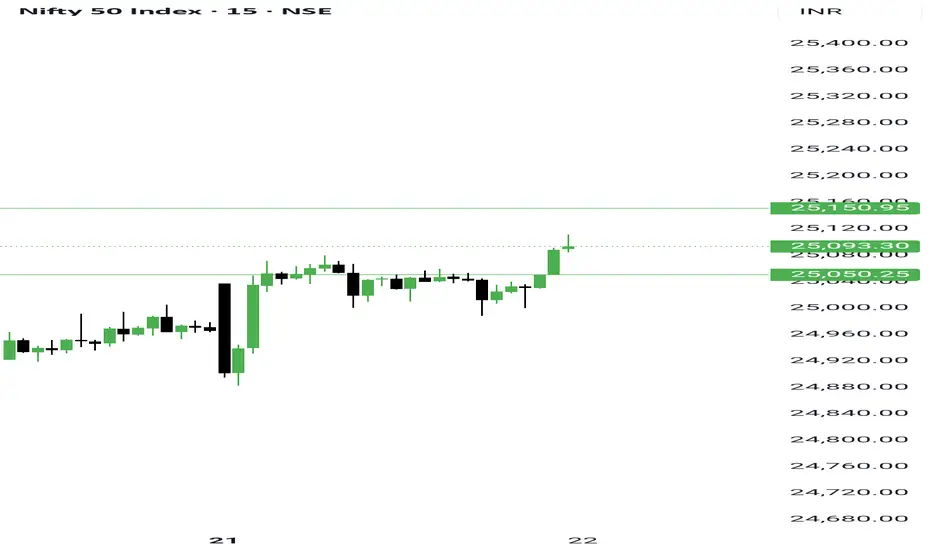
Chart always tells the truth - Nifty and Banknifty The chart always tells the truth.
We studied that NSE:NIFTY would bounce, and it did — what a bounce!
But keep in mind, fear is still present in the market. Traders can sell even on the smallest negative trigger. Today’s move was largely because of short covering.
Today’s Nifty candle is bullish, but buyers’ volume is only 40 million higher than sellers, while on Friday sellers had 43 million more than buyers.
This clearly shows that sellers are still active.
So, a bullish candle + low volume + short covering = likely sideways action tomorrow.
Nifty levels:
- Support: 25050
- Resistance: 25175 — above this, we could see short covering up to 25350
The market remains bullish, and this is the right time to build a list of stocks where character or structure change has happened.
If you can spot such small-cap stocks, you can easily aim for 40-50% upside in next 3-4 months.
Talking about NSE:BANKNIFTY — even after such a big green candle, sellers outnumbered buyers by 7 million in volume. So be cautious while trading here.
BankNifty levels:
- Support: 56770
- Resistance: 57200
Sector-wise, the craze is still around IPOs. Focus on recently listed NSE:NIFTY_IPO stocks (1-2 years old) where character changed in the last rally.
Here’s how my recent picks performed today:
NSE:MASTEK - +7%
NSE:PARADEEP - +7.63%
NSE:JYOTICNC - +5%
NSE:BDL - +2.80%
NSE:LTF - +3.66%
NSE:UPL - +3.92%
NSE:CARRARO - +5.6%
NSE:KPEL - +4.7%
NSE:MMTC - +3.79%
That’s all for today.
Take care.
Have a profitable tomorrow.
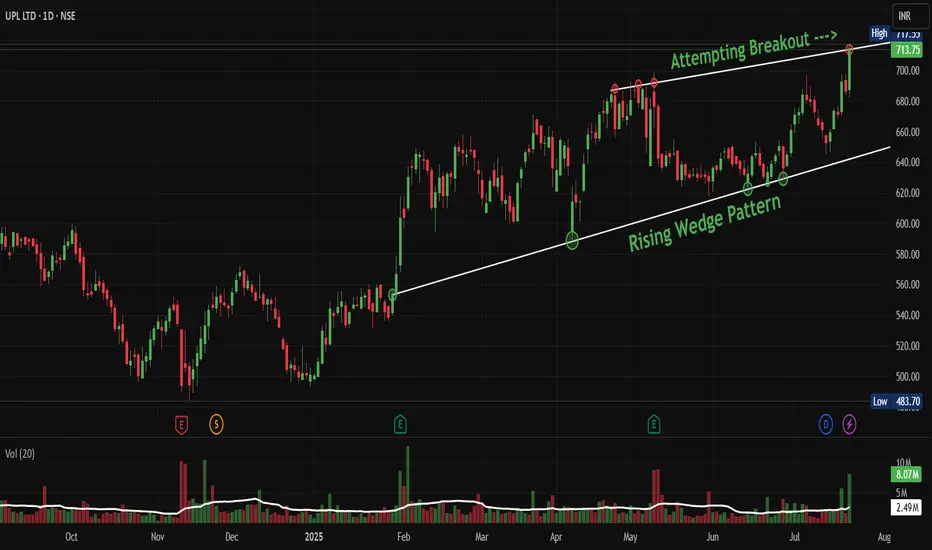
UPL: Rising Wedge Breakout Could Signal Fresh HighsNSE:UPL : Rising Wedge Breakout Could Signal Fresh Highs, But Manage Risk Carefully
Price Action Analysis:
- Current Price: ₹713.75 (+3.92%)
- 52-Week High: ₹717.55
- 52-Week Low: ₹483.70
- The stock is trading near all-time highs with strong momentum
Volume Spread Analysis
- Volume spikes are visible during key breakout points
- Recent volume of 8.07M is above average, confirming breakout attempt
- Volume pattern shows selling pressure during declines and buying interest on rallies
- The volume surge in July suggests institutional participation
Chart Pattern:
Rising Wedge Pattern:
- A classic rising wedge pattern has formed from February 2025 to July 2025
- The pattern shows converging trendlines with higher highs and higher lows
- Volume has been decreasing during the formation, which is typical for rising wedges
- The stock is attempting a breakout from the upper trendline resistance
Key Technical Levels:
Support Levels:
- Immediate Support: ₹680 (recent consolidation zone)
- Strong Support: ₹640 (rising trendline support)
- Major Support: ₹580 (previous resistance turned support)
Resistance Levels:
- Immediate Resistance: ₹720 (psychological level)
- Next Resistance: ₹750 (projected target based on wedge height)
- Extended Target: ₹800 (measured move from base)
Base Formation Analysis:
- The stock formed a solid base between ₹480-₹550 from October 2024 to January 2025
- This accumulation phase lasted approximately 4 months
- Strong buying emerged from the ₹500 level multiple times
- The breakout from this base began in February 2025
Trade Setup:
Entry Strategy:
- Aggressive Entry: ₹714-₹716 (current levels on confirmed breakout)
- Conservative Entry: ₹695-₹700 (on any pullback to support)
- Accumulation Entry: ₹680-₹685 (if stock retraces to wedge support)
Target Levels:
- Target 1: ₹750 (immediate target - 5% upside)
- Target 2: ₹780 (medium-term target - 9% upside)
- Target 3: ₹820 (extended target - 15% upside)
Stop Loss Levels:
- For Aggressive Entry: ₹675 (5.5% risk)
- For Conservative Entry: ₹665 (5% risk)
- For Accumulation Entry: ₹655 (4% risk)
Position Sizing Guidelines:
- Risk per trade: 2% of portfolio maximum
- For ₹100,000 portfolio with ₹714 entry and ₹675 stop: 51 shares maximum
- Adjust position size based on individual risk tolerance
Risk Management Framework:
Trade Management Rules:
- Book 30% profits at Target 1
- Trail stop loss to breakeven after Target 1 is hit
- Book another 40% profits at Target 2
- Let the remaining 30% run with a trailing stop
Risk Factors to Monitor:
- Rising wedge patterns have a 60% failure rate historically
- Global agrochemical sector volatility
- Monsoon dependency for Indian agriculture
- Currency fluctuation impact on exports
Sectoral and Fundamental Backdrop:
Company Overview:
- NSE:UPL provides crop protection solutions, manufacturing and marketing agrochemicals, industrial chemicals, and speciality chemicals
- Global provider with annual revenue exceeding $5 billion, ranking among the top 5 agriculture solutions companies worldwide
Financial Performance:
- Market Cap: ₹58,088 Crore (up 37.1% in 1 year), Revenue: ₹46,637 Cr, Profit: ₹820 Cr
- Revenues grew 8.21% last year.
- The company has delivered a poor sales growth of 5.46% over the past five years
Recent Performance Metrics:
- Year-to-date increase of 29.48%, significantly outperforming the Sensex's 4.44% gain
- Delivered a robust return of 37.1% over the past year, compared to the Sensex's 12.13%
Credit Rating and Outlook:
- Fitch has revised its Long-Term Issuer Default Rating outlook on UPL Corp from 'Negative' to 'Stable', affirming the IDR at 'BB'
Sectoral Outlook:
- The company focuses on reducing environmental impact while enhancing soil health and water conservation through sustainable agriculture
- UPL ranked No. 1 globally in the agrochemical sector by Sustainalytics
- Growing focus on biological solutions and sustainable farming practices
Recent Corporate Actions:
- UPL's subsidiary to acquire 100% of Wuhan Advanta Seeds for USD 4,200 by Sept 2025
- Strategic partnership with Indian Potash Limited to revolutionise sugarcane farming in India
Investment/Trading Thesis:
Positive Factors:
- Strong technical breakout from the rising wedge pattern on cards
- Outperforming the broader market significantly
- Leading position in the global agrochemical sector
- Strategic acquisitions and partnerships
- Improved credit rating outlook
Risk Considerations:
- The company has a low interest coverage ratio
- Historical slow sales growth over 5 years
- Monsoon and weather dependency
- Rising wedge patterns can be bearish reversal signals
- Global commodity price volatility
My Take:
NSE:UPL presents a compelling technical setup with fundamental tailwinds from the agricultural sector. The rising wedge breakout, if sustained, could lead to significant upside. However, traders should maintain strict risk management given the pattern's inherent risks and the company's mixed fundamental metrics.
Keep in the Watchlist and DOYR.
NO RECO. For Buy/Sell.
📌Thank you for exploring my idea! I hope you found it valuable.
🙏FOLLOW for more
👍BOOST if you found it useful.
✍️COMMENT below with your views.
Meanwhile, check out my other stock ideas on the right side until this trade is activated. I would love your feedback.
Disclaimer: "I am not a SEBI REGISTERED RESEARCH ANALYST AND INVESTMENT ADVISER."
This analysis is intended solely for informational and educational purposes and should not be interpreted as financial advice. It is advisable to consult a qualified financial advisor or conduct thorough research before making investment decisions.
UPL : Strong Resistance near ~820 levels Hi Everyone,
This analysis for UPL is in continuation of previous analysis done for the same. I request all stock market students to please go through my previous analysis on UPL and others .
Traders will book profit at all time high levels ( short to mid term target : ~820 ) so stock may remain stuck for 1-4 months before start marching towards its final target : 1100
Note : My analysis is only for education purpose . No Buy/Sell recommendation given to anyone

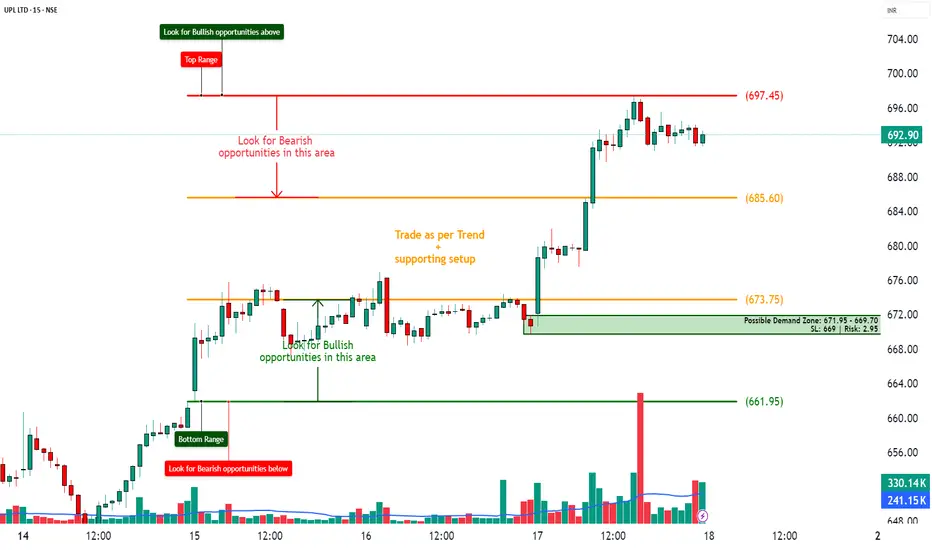
UPL – Demand Zone Based Trade Setup________________________________________________________________________________📈 UPL – Demand Zone Based Trade Setup
🕒 Chart Type: 15-Min | 🗓 Date: 17th July 2025
🔍 Simple and Structured Setup for New Traders
________________________________________________________________________________
🚦 Key Zones to Watch
🔴 Top Range (Resistance) – 697.45
🟠 Mid-Level Zones – 685.60 | 673.75
🟢 Bottom Range (Support) – 661.95
📦 Possible Demand Zone – 671.95 to 669.70 (SL: 669 | Risk: 2.95)
________________________________________________________________________________
💡 What’s Happening on the Chart?
✅ Strong price rally from the demand area 📈
✅ Price is now consolidating just below major resistance (697.45)
✅ Volume spikes indicate strong participation
✅ Market respecting zones cleanly — ideal for zone learners 📚
________________________________________________________________________________
🎯 How to Plan Trades (For Educational Use Only):
🔼 Best Buy Setup:
• Entry: Near 671.95–669.70 (Demand Zone)
• Stoploss: 669
• Target: 685 / 697
• Why: Tested demand zone + strong uptrend + low-risk trade
🔽 Best Sell Setup:
• Entry: Near 697.45 (Resistance Zone)
• Stoploss: 699
• Target: 685.60 / 673.75
• Why: Top zone tested + price may reverse with exhaustion
________________________________________________________________________________
🧠 Learning Points for New Traders:
• ✅ Always trade with trend until you hit opposite zone
• 🧱 Focus on buying near support and selling near resistance
• 📊 Use volume and structure for entry confirmation
• 🧠 Risk should always be smaller than reward
________________________________________________________________________________
📦 Zone Summary for Quick Reference:
• 🔴 Resistance Zone: 697.45
• 🟢 Demand Zone: 671.95 – 669.70 (Risk only ₹2.95!)
⚠ Disclaimer (Please Read):
• These Trades are shared for educational purposes only and is not investment advice.
• I am not a SEBI-registered advisor.
• The information provided here is based on personal market observation.
• No buy/sell recommendations are being made.
• Please do your own research or consult a registered financial advisor before making any trading decisions.
• Trading involves risk. Always use proper risk management.
I am not responsible for trading decisions based on this post.
________________________________________________________________________________
💬 Found this helpful?
Drop your thoughts or questions in the comments below ⬇️
🔁 Share this post with your trading community – let them benefit from clean charts, structured setups, and zone-based learning.
✅ Follow simpletradewithpatience for charts, clean setups, and educational content based on price action, zones, and risk-managed trades.
🚀 Trade with patience, trust your charts, and stay clear-headed!
Be Self-Reliant | Trade with Patience | Learn with Charts & Zones 📊
________________________________________________________________________________
Unlocking the Secrets of Divergence in Trading- A Complete GuideMastering Divergence: Real-Life Examples of Bullish and Bearish Divergence in UPL Ltd and Tata Motors
Divergence is an incredibly powerful tool in technical analysis that helps traders spot potential trend reversals. By comparing price action with momentum indicators like RSI, you can catch subtle signs of market shifts and make more informed trading decisions.
In this post, I’m sharing two real-life examples of bullish and bearish divergence to help you understand how this works and how you can use it to improve your trading.
1. Bullish Divergence Example: UPL Ltd
Here’s what happened:
Price Action: UPL Ltd made a lower low on the chart.
RSI Indicator: At the same time, RSI formed a higher low, creating a clear bullish divergence.
What does it mean?
Even though the price was dropping, the RSI hinted that momentum was picking up. This is often a clue that a reversal might be on the horizon.
Outcome:
Right after confirming the divergence, UPL Ltd saw a strong rally, rewarding traders who caught the signal early.
2. Bearish Divergence Example: Tata Motors
Here’s another case:
Price Action: Tata Motors was climbing, forming a higher high on the chart.
RSI Indicator: But the RSI didn’t agree—it created a lower high, signaling a bearish divergence.
What does it mean?
The rising price didn’t have the momentum to back it up. This imbalance often leads to a downward reversal.
Outcome:
As expected, Tata Motors experienced a bearish reversal soon after, validating the divergence and giving traders a great shorting opportunity.
Why Divergence Is a Must-Know for Traders
Divergence is so effective because it reveals hidden shifts in market momentum before they show up on price charts. Here’s why it’s worth paying attention to:
Early Signals: Divergences give you a head start by showing potential reversals before they happen.
Versatile Tool: You can use divergence with multiple indicators like MACD or Stochastic for extra confirmation.
Better Timing: Pairing divergence with support/resistance levels or trendlines helps you fine-tune your entries and exits.
How to Trade Divergence Like a Pro
Combine divergence signals with major support/resistance levels for stronger setups.
Always wait for confirmation—like a breakout or a reversal candlestick—before taking action
Use stop losses to protect your trades in case the divergence doesn’t play out.
Visual Examples on the Charts
Take a look at the attached chart showing UPL Ltd (Bullish Divergence) and Tata Motors (Bearish Divergence) side by side.
UPL Ltd: The price made a lower low, but RSI made a higher low, leading to a strong bullish rally.
Tata Motors: The price formed a higher high, but RSI made a lower high, resulting in a bearish reversal.
Your Turn!
Have you spotted any divergences in stocks you’re tracking? Let me know in the comments!
If you found this helpful, don’t forget to like and follow for more educational trading content.

UPL by KRS Charts21st October 2024 / 10:05 AM
Why UPL ❓
1️⃣ UPL is Bullish Stock long term wise with Decent Fundamentals. 📈
2️⃣ Recent March Low seems like Higher Low in bigger picture ✅
3️⃣ UPL has Formed Inverted H&S and Breakout from it and currently Reversing to Bullish again after Retesting from Prev. Resistance. ↗️
4️⃣ 1D TF, Bullish Hammer is visible and today also moving strong Upside 🔅
UPL Target 716 Rs with SL of 520 1W Closing Basis

Sharda Cropchem for 60% gainsDate: 11 Nov’24
Symbol: SHARDACROP
Timeframe: Daily
Sharda Cropchem seems to be in Wave III of 3 which is heading towards 1350 (~60% from current price of 800) as seen in the chart. Wave 3 could even extend to 1500 which can be reviewed after closing above 1100 in Wave V of 3. Recent Q2 results are good with better margins compared to last FY.
This is not a trade recommendation. Please do your own analysis. And I have the right to be wrong.
HINGLISH VERSION
Jaisa ki chart mein dekha gaya hai, Sharda Cropchem 3 ke Wave III mein dikh raha hai jo 1350 (800 ki maujooda keemat se ~60%) ki taraf badh raha hai. Wave 3 1500 tak bhi jaa sakta hai; jiskee sameeksha 3 ke Wave V mein 1100 se upar band hone ke baad ki jaa sakti hai. Pichhle FY ki tulana mein behatar margin ke saath haal ke Q2 ke nateeje achchhe hain.
Yah koi trade lene ya nivesh karne ki salah nahin hai. Kripya apna vishleshan svayan karen. Aur mujhe galat hone ka adhikaar hai.

UPL | Wyckoff Events & Phases Explained Wyckoff developed a price action market theory which is still a leading principle in today's trading practice.
The Wyckoff method states that the price cycle of a traded instrument consists of 4 stages – Accumulation, Markup, Distribution, and MarkDown.
👉TEXTBOOK EXAMPLE Accumulation Schematic: Wyckoff Events and Phases👈
Price Action Analysis
And this is the accumulation stage -
1) PS— Preliminary Support, where substantial buying begins to provide pronounced support after a continued down-move.
- Volume increases and price spread widens, signaling that the down-move may be approaching its end.
2) SC—Selling Climax, the point at which widening spread and selling pressure usually in high point and heavy or panicky selling by the public is being absorbed by larger professional interests at or near a bottom.
- Often price will close well off the low in an SC, reflecting the buying by these large interests.
3) AR—Automatic Rally, which occurs because intense selling pressure has greatly decline.
- A wave of buying easily pushes prices up.
- The high of this rally will help define the upper boundary of an accumulation.
4) ST—Secondary Test, in which price revisits the area of the SC to test the supply/demand.
- If a bottom is to be confirmed, volume and price spread should be decline as the market approaches support in the area of the SC.
- It is common to have multiple STs after an SC.
5) SOS—Sign Of Strength, a price advance on increasing spread and relatively higher volume.
6) LPS—Last Point Of Support, the low point of a reaction or pullback after an SOS.
7) BU/LPS- Backing up to an LPS means a pullback to support that was formerly resistant, on diminished spread and volume.
All the phases of accumulation stage-
Phase A:
Phase A marks the stopping of the prior downtrend.
-- Up to this point, supply has been dominant.
-- The approaching cutback of supply is evidenced in preliminary support (PS) and a selling climax (SC).
-- A successful secondary test (ST) in the area of the SC will show less selling than previously and a narrowing of spread and decreased volume, generally stopping at or above the same price level as the SC.
-- If the ST goes lower than that of the SC, one can anticipate either new lows or prolonged consolidation.
-- Horizontal lines may be drawn to help focus attention on market behavior, as seen in the two Accumulation Schematics above.
Phase B:
-- Phase B serves the function of “building a cause” for a new uptrend
-- In Phase B, institutions and large professional interests are accumulating relatively low-priced inventory in anticipation of the next markup.
--There are usually multiple STs during Phase B'
-- Institutional buying and selling impart the characteristic up-and-down price action of the trading range.
--Early on in Phase B, the price swings tend to be wide and accompanied by high volume.
Phase C:
-- It is in Phase C that the stock price goes through a final test of the remaining supply.
-- this marks the beginning of a new uptrend, trapping the late sellers (bears).
-- It indicates that the stock is likely to be ready to move up, so this is a good time to initiate at least a partial long position.
-- The appearance of an SOS shortly after a spring or shakeout validates the analysis.
Phase D:
--During Phase D, the price will move at least to the top
--LPSs in this phase are generally excellent places to initiate or add to profitable long positions.
Phase E:
--large operators can occur at any point in Phase E.
--These are sometimes called “stepping stones” on the way to even higher price targets.
--------------------------------------------------
Regards,
Revive Traders
------------------------------------------------
Guys check out the related POST as well, it went FANTASTIC !
🙏FOLLOW for more !
👍LIKE if U find it useful !
✍COMMENT your views & feedback !

UPL -Cup and Handle - Breakout with volumeUPL -Cup and Handle - Breakout with volume
Name - UPL
Pattern - Cup and Handle
Timeframe - Daily
Status - Breakout with good volume
Cmp - 598
Target - 719
SL - 584
Pattern: Cup and Handle
The Cup and Handle pattern is a bullish continuation pattern
Fundamentals:
Here are some key fundamental ratios for UPL Ltd.:
Market Cap: ₹44,908.86 Cr1
Current Price: ₹598.301
Price-to-Earnings (P/E) Ratio: 14.782
Price-to-Book (P/B) Ratio: 5.981
Return on Equity (ROE): -4.83%3
Debt-to-Equity Ratio: 1.153
Dividend Yield: 0.17%1
UPL Ltd. is a major player in the agrochemical industry, but its recent financial performance shows some challenges, particularly with a negative ROE and a high debt-to-equity ratio3.

UPL on longterm support levelUPL recently retraced to It's long-term Support level, also seen, breaking the Trendline and change in price action Making higher low higher high
Note : Always enter the trade with stop loss, not more than 10% of your capital
Kudos

UPLI Observed these Levels based on price action and Demand & Supply which is My Own Concept Called "PENDAM CONCEPTS" ... Please Don't Take any trades based on this chart/Post...because this chart is for educational purpose only not for Buy or Sell Recommendation.. Thank Q

UPL : An Investment IdeaUPL is at good support zone which is visible on the chart. please follow the line very strictly as Stop-loss.
ABOUT
UPL is principally engaged in the business of agrochemicals, industrial chemicals, chemical intermediates, speciality chemicals and production and sale of field crops and vegetable seeds.
KEY POINTS
Business Overview :
UPL is a leading provider of agricultural solutions and services, with 14,000+ product registrations, a presence in ~140 countries, access to 90% of the world’s food basket. The products include Crop Protection Chemicals like Insecticides, Fungicides, Herbicides etc. also Seeds, Biosolutions. It is a 5th largest Agrochemical company globally with 43 manufacturing facilities across the globe.
Market Leadership :
UPL SAS is the no. 1 crop protection player in India with a market share of 13%. Through its agtech platform ‘Nurture' it is connected with ~3 million registered farmers, 85,000+ retailers and 25,000 dealers. UPL Corporation Ltd is a 6th top Global crop protection company having presence in over 130 countries. UPL Speciality Chemicals is no. 1 Specialty chemicals company in India.
Revenue Segment :
Crop Protection (84% in 9M FY24 vs 88% in FY22) ** - includes the manufacture and marketing of conventional agrochemical products, and other agricultural related products.
Seed Business (11% in 9M FY24 vs 6% in FY22 ) - includes the manufacture and marketing of seeds.
Non- Agro- 6% in 9M FY24 vs 5% in FY22)** - Manufactures and markets industrial chemical and other non agricultural related products.
Geographical Revenue Share :
Latin America - 41%
North America - 16%
Europe - 14%
India - 12%
Rest of the World - 17%
Holding Patterns : (please check time to time)
Promoter holding - 32.4 %
Public holding - 16.4 %
DII holding - 16.8 %
FII holding - 34.4 %
Company Fundamentals : (Dec Q. 2023)
Market Cap - ₹ 36,982 Cr.
CMP - 490
ATH - ₹ 865
Book Value - ₹ 385
Dividend Yield - 2.03 %
ROCE - 14.3 % ROE - 13.4 %
Debt to equity - 1.21
Pledged percentage - 0.00 %
Free Cash Flow - ₹ 5462 Cr.
Piotroski score - 7.00
All data is available in public domain..
Source : www.screener.in
Disclaimer : It is my personal view as a trader and for educational purpose only. Equity market involves risk .
Please consult your financial adviser before taking any decision.

UPL LTD - BULLISH BREAKOUT - STRONG UPMOVE POSSIBLE - LONG TERMHi Folks,
I have been studying this sector(agro chemical) for a while. This sector can outplay operational deleverage since sitting on capex since few years. Recently, they did a rights to lessen their debt to save interest on borrowings. UPL is also a market leader in agro chemicals sector with presence across the globe with an array of topline products.
Quarterly results are improving indicating they might be going towards the capacity utilisation they built on capex. Still early days but technically risk-reward is highly favourable.
Elliott Wave Analysis
1. Larger 5 wave is playing out on weekly time frame.
2. 2 of 5 seems to be getting over after decent retracement. Good time and price correction happened.
3. A strong weekly candle above 30 WEMA is visible, more follow ups needed with huge daily candles to signify 3 wave up.
4.Low of 2 can act as an invalidation point for this whole structure.
5. Volumes and delivery are very high near the recent bottom indicating smart money interested in accumulation here.
Happy Trading! Cheers!!
Not a trading recommendation, please do your own due diligence.

FINALLY IT HAPPENS!NSE:UPL finally breaks out. Once a Nifty 50 contributor slumped massively and looks like it is ready to reverse. It was on my radar since past 3-4 weeks and just wanted it to break above the resistance firmly. It broke out and now it has re-tested and ready to rock!

upl 540 and above?cmp : 501
current price action suggest upl may test 523 and 540 levels again.
if closed above 540 for 15 sessions then we may see a potential reversal for upside targets.
sl 450 closing basis
note : its a educational idea and not a trading idea.
invest on your own analysis.

UPL in BUYHi Everyone...
In UPL we got W pattern with CHOCH confirmation but still is Sell channel
Risky traders entry the buy @502-486-455
SL 446
Safe traders wait for breakup....follow the chart drawing and enter the retracement @432
SL 446
Both TPS WILL BE
529-604-700-750-800-850-1250

Lets think about investing in UPL.With RR of 4:95
Disclosure : I am not SEBI registered. The information provided here is for education purposes
only. I will not be responsible for any of your profit/loss with this suggestions. Consult your financial advisor before taking any decisions
