UPL LTD BREAKOUTUPL LTD has broken through its weekly trend line and is now showing bullish momentum after a short period of consolidation. The next target is the all-time high, which traders may aim for. A suitable stop-loss could be placed at either 650 or 600, depending on individual risk appetite.
On the financial front, UPL's latest quarterly results for the period ending March 2025 show solid performance. The company reported a revenue of Rs 15,573 crore, along with a net profit of Rs 1,106 crore. Its Earnings Per Share (EPS) for the quarter stood at Rs 11.42.
Uplanalysis

UPL : Strong Resistance near ~820 levels Hi Everyone,
This analysis for UPL is in continuation of previous analysis done for the same. I request all stock market students to please go through my previous analysis on UPL and others .
Traders will book profit at all time high levels ( short to mid term target : ~820 ) so stock may remain stuck for 1-4 months before start marching towards its final target : 1100
Note : My analysis is only for education purpose . No Buy/Sell recommendation given to anyone

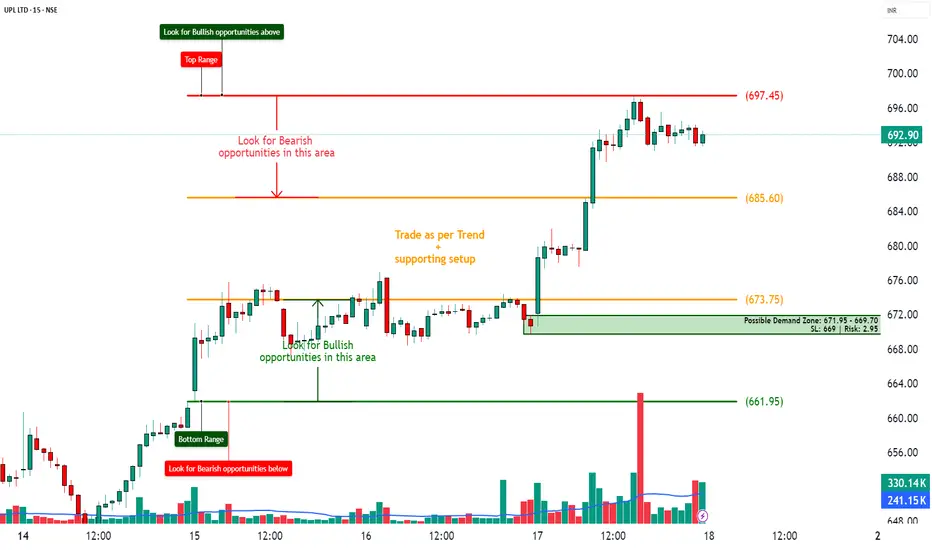
UPL – Demand Zone Based Trade Setup________________________________________________________________________________📈 UPL – Demand Zone Based Trade Setup
🕒 Chart Type: 15-Min | 🗓 Date: 17th July 2025
🔍 Simple and Structured Setup for New Traders
________________________________________________________________________________
🚦 Key Zones to Watch
🔴 Top Range (Resistance) – 697.45
🟠 Mid-Level Zones – 685.60 | 673.75
🟢 Bottom Range (Support) – 661.95
📦 Possible Demand Zone – 671.95 to 669.70 (SL: 669 | Risk: 2.95)
________________________________________________________________________________
💡 What’s Happening on the Chart?
✅ Strong price rally from the demand area 📈
✅ Price is now consolidating just below major resistance (697.45)
✅ Volume spikes indicate strong participation
✅ Market respecting zones cleanly — ideal for zone learners 📚
________________________________________________________________________________
🎯 How to Plan Trades (For Educational Use Only):
🔼 Best Buy Setup:
• Entry: Near 671.95–669.70 (Demand Zone)
• Stoploss: 669
• Target: 685 / 697
• Why: Tested demand zone + strong uptrend + low-risk trade
🔽 Best Sell Setup:
• Entry: Near 697.45 (Resistance Zone)
• Stoploss: 699
• Target: 685.60 / 673.75
• Why: Top zone tested + price may reverse with exhaustion
________________________________________________________________________________
🧠 Learning Points for New Traders:
• ✅ Always trade with trend until you hit opposite zone
• 🧱 Focus on buying near support and selling near resistance
• 📊 Use volume and structure for entry confirmation
• 🧠 Risk should always be smaller than reward
________________________________________________________________________________
📦 Zone Summary for Quick Reference:
• 🔴 Resistance Zone: 697.45
• 🟢 Demand Zone: 671.95 – 669.70 (Risk only ₹2.95!)
⚠ Disclaimer (Please Read):
• These Trades are shared for educational purposes only and is not investment advice.
• I am not a SEBI-registered advisor.
• The information provided here is based on personal market observation.
• No buy/sell recommendations are being made.
• Please do your own research or consult a registered financial advisor before making any trading decisions.
• Trading involves risk. Always use proper risk management.
I am not responsible for trading decisions based on this post.
________________________________________________________________________________
💬 Found this helpful?
Drop your thoughts or questions in the comments below ⬇️
🔁 Share this post with your trading community – let them benefit from clean charts, structured setups, and zone-based learning.
✅ Follow simpletradewithpatience for charts, clean setups, and educational content based on price action, zones, and risk-managed trades.
🚀 Trade with patience, trust your charts, and stay clear-headed!
Be Self-Reliant | Trade with Patience | Learn with Charts & Zones 📊
________________________________________________________________________________
UPL by KRS Charts21st October 2024 / 10:05 AM
Why UPL ❓
1️⃣ UPL is Bullish Stock long term wise with Decent Fundamentals. 📈
2️⃣ Recent March Low seems like Higher Low in bigger picture ✅
3️⃣ UPL has Formed Inverted H&S and Breakout from it and currently Reversing to Bullish again after Retesting from Prev. Resistance. ↗️
4️⃣ 1D TF, Bullish Hammer is visible and today also moving strong Upside 🔅
UPL Target 716 Rs with SL of 520 1W Closing Basis

Upl confirms bearish trendAfter reached the previous target, The bat pattern is forming in UPL. Next buy region is the D point. I expect that price will fall upto D point. This is for educational purposes only.

UPL Monthly | Long Term InvestmentHi Traders,
This is UPL Monthly Chart.
This is Best Time to Invest for Long Term
with Small SL which is less than 50 Rs.
Note - This is only for education Purpose.

UPL | Wyckoff Events & Phases Explained Wyckoff developed a price action market theory which is still a leading principle in today's trading practice.
The Wyckoff method states that the price cycle of a traded instrument consists of 4 stages – Accumulation, Markup, Distribution, and MarkDown.
👉TEXTBOOK EXAMPLE Accumulation Schematic: Wyckoff Events and Phases👈
Price Action Analysis
And this is the accumulation stage -
1) PS— Preliminary Support, where substantial buying begins to provide pronounced support after a continued down-move.
- Volume increases and price spread widens, signaling that the down-move may be approaching its end.
2) SC—Selling Climax, the point at which widening spread and selling pressure usually in high point and heavy or panicky selling by the public is being absorbed by larger professional interests at or near a bottom.
- Often price will close well off the low in an SC, reflecting the buying by these large interests.
3) AR—Automatic Rally, which occurs because intense selling pressure has greatly decline.
- A wave of buying easily pushes prices up.
- The high of this rally will help define the upper boundary of an accumulation.
4) ST—Secondary Test, in which price revisits the area of the SC to test the supply/demand.
- If a bottom is to be confirmed, volume and price spread should be decline as the market approaches support in the area of the SC.
- It is common to have multiple STs after an SC.
5) SOS—Sign Of Strength, a price advance on increasing spread and relatively higher volume.
6) LPS—Last Point Of Support, the low point of a reaction or pullback after an SOS.
7) BU/LPS- Backing up to an LPS means a pullback to support that was formerly resistant, on diminished spread and volume.
All the phases of accumulation stage-
Phase A:
Phase A marks the stopping of the prior downtrend.
-- Up to this point, supply has been dominant.
-- The approaching cutback of supply is evidenced in preliminary support (PS) and a selling climax (SC).
-- A successful secondary test (ST) in the area of the SC will show less selling than previously and a narrowing of spread and decreased volume, generally stopping at or above the same price level as the SC.
-- If the ST goes lower than that of the SC, one can anticipate either new lows or prolonged consolidation.
-- Horizontal lines may be drawn to help focus attention on market behavior, as seen in the two Accumulation Schematics above.
Phase B:
-- Phase B serves the function of “building a cause” for a new uptrend
-- In Phase B, institutions and large professional interests are accumulating relatively low-priced inventory in anticipation of the next markup.
--There are usually multiple STs during Phase B'
-- Institutional buying and selling impart the characteristic up-and-down price action of the trading range.
--Early on in Phase B, the price swings tend to be wide and accompanied by high volume.
Phase C:
-- It is in Phase C that the stock price goes through a final test of the remaining supply.
-- this marks the beginning of a new uptrend, trapping the late sellers (bears).
-- It indicates that the stock is likely to be ready to move up, so this is a good time to initiate at least a partial long position.
-- The appearance of an SOS shortly after a spring or shakeout validates the analysis.
Phase D:
--During Phase D, the price will move at least to the top
--LPSs in this phase are generally excellent places to initiate or add to profitable long positions.
Phase E:
--large operators can occur at any point in Phase E.
--These are sometimes called “stepping stones” on the way to even higher price targets.
--------------------------------------------------
Regards,
Revive Traders
------------------------------------------------
Guys check out the related POST as well, it went FANTASTIC !
🙏FOLLOW for more !
👍LIKE if U find it useful !
✍COMMENT your views & feedback !

UPL : An Investment IdeaUPL is at good support zone which is visible on the chart. please follow the line very strictly as Stop-loss.
ABOUT
UPL is principally engaged in the business of agrochemicals, industrial chemicals, chemical intermediates, speciality chemicals and production and sale of field crops and vegetable seeds.
KEY POINTS
Business Overview :
UPL is a leading provider of agricultural solutions and services, with 14,000+ product registrations, a presence in ~140 countries, access to 90% of the world’s food basket. The products include Crop Protection Chemicals like Insecticides, Fungicides, Herbicides etc. also Seeds, Biosolutions. It is a 5th largest Agrochemical company globally with 43 manufacturing facilities across the globe.
Market Leadership :
UPL SAS is the no. 1 crop protection player in India with a market share of 13%. Through its agtech platform ‘Nurture' it is connected with ~3 million registered farmers, 85,000+ retailers and 25,000 dealers. UPL Corporation Ltd is a 6th top Global crop protection company having presence in over 130 countries. UPL Speciality Chemicals is no. 1 Specialty chemicals company in India.
Revenue Segment :
Crop Protection (84% in 9M FY24 vs 88% in FY22) ** - includes the manufacture and marketing of conventional agrochemical products, and other agricultural related products.
Seed Business (11% in 9M FY24 vs 6% in FY22 ) - includes the manufacture and marketing of seeds.
Non- Agro- 6% in 9M FY24 vs 5% in FY22)** - Manufactures and markets industrial chemical and other non agricultural related products.
Geographical Revenue Share :
Latin America - 41%
North America - 16%
Europe - 14%
India - 12%
Rest of the World - 17%
Holding Patterns : (please check time to time)
Promoter holding - 32.4 %
Public holding - 16.4 %
DII holding - 16.8 %
FII holding - 34.4 %
Company Fundamentals : (Dec Q. 2023)
Market Cap - ₹ 36,982 Cr.
CMP - 490
ATH - ₹ 865
Book Value - ₹ 385
Dividend Yield - 2.03 %
ROCE - 14.3 % ROE - 13.4 %
Debt to equity - 1.21
Pledged percentage - 0.00 %
Free Cash Flow - ₹ 5462 Cr.
Piotroski score - 7.00
All data is available in public domain..
Source : www.screener.in
Disclaimer : It is my personal view as a trader and for educational purpose only. Equity market involves risk .
Please consult your financial adviser before taking any decision.

UPL - Look like a - Double Bottom 1 - Day Time Frame Look like a Double Bottom wait for Conformation and Candle Closing so we can get some after getting the Conformation in Daily TF

UPL - Look like a - Double BottomNSE:UPL Look like a Double Bottom wait for Conformation and Candle Closing so we can get some after getting the Conformation

UPL Short term TargetModerate Bullish Divergence Observed in UPL.
Entry was at 475, Stop Loss Below 455, Target 500, 512.

Long Stup in UPLA Inverted Head & Shoulder Chart Pattern Breakout happened on the weekly Time frame of NSE:UPL
Price Action supported by volume.
The stock is currently in uptrend making higher highs and higher lows.
One can add this stock into their stocks to buy list.
One can initiate the long trade as per the lavel mentioned on the chart
Stop loss will be on a Daily closing basis.
Trend Analysis :- UP Trend
Chart Pattern :- Bullish Inverted Head & Shoulder Chart Pattern
Technical Indicator :- Positive MACD Crossover

Investment Pick - UPLInvestment Pick
Buy UPL At Cmp 616.25
SL - 570 ( Monthly Closing Basis )
Target - 1200 ++

UPL: Techno Fundamental AnalysisSomehow I have seen when there is an issue with monsoon (below par) this stock keeps on popping up in my radar. Reason: It's a AgroChem company (phosphate fertilizer producer #1).
I saw some analysts also giving Buy call in this. So before putting long term bet, was looking at the Funda-Techno Analysis of NSE:UPL
Here are my thoughts:
Fundamental :
DVM (Durability-Valuation-Momentum) score: 60-60-38 (Financially strong, valuationwise comfortable, technically neutral)
Consensus price trg from analysts: 760 (28% upside) in 1 yr
The consensus recommendation from 24 analysts for UPL Ltd. is BUY:
(11 Strong Buy, 6 Buy, 6 Hold, 1 Sell)
EPS is expected to grow by 6.4% in FY24
EBIT is expected to grow by 7.1% in FY24
Dividend per share is expected to grow by 6.4% in FY24
Capital expenditure is expected to grow by 60.7% in FY24
Technical :
In Monthly chart: It's actually in the golden zone of Fib series.
See the RSI descending triangle .
The current level is a good support area.
However best way is to do is a SIP where one can accumulate over a period from 600-500 area for an upside of upto 760/780.
SIP levels are shown in the chart:


UPL LongThe stock has been trading in a range for a long time , now its about to breakout ; buy when the price gives a clear breakout on the neck line.
Consider the time frame here , I have used 1 Day as TF so the chances of hitting the targets are good only when you hold it for a longer duration. The SL here is of 3.5-4% , so do your Position sizing according to your Risk Appetite .
#KeepTrading

BREAKOUT AFTER CONSOLIDATION IN UPLUPL breakout after consolidtion since 28th Feb
Formed 3 white solders on daily TF
Pole and flag in 1 Hr TF
Coming for breakout retest zone... can be considered as buy on dip till 715
SL can be 705

UPL trading Range819-699
Please note these strong support and resistance levels in UPL and
use the help of MACD to confirm the direction of the trend !
StochRSI intends a bearish move, but confirms when the level breaks

UPL Ltd - 20.04.2022UPL Ltd - 20.04.2022
The stock is trading @ 818 levels
There is a RESISTANCE ZONE @ 821 levels
The prices are above EMA
RSI is 59 in weekly chart
watch out for the price action

UPL LTD UPL looking good for buying above 815 for the target of 950 ++ because its making cup and handle pattern and trying to give breakout... keep learning stay tune

Simple Trade Setup | UPL | 07-04-2022 [INTRADAY]NSE:UPL
Observations:
1) On 1day time frame, we can see it is has formed cup and handle pattern.
Please refer below chart : 1day time frame.
-------------------------------------
Trade Setup for 07-04-2022
1) Don't Jump in to trade at the beginning of the market. Let it get settle for 15-20min first and judge the price action.
2) Everything is mentioned on the chart. I hope it is easy to understand.
3) All the levels will work as support, resistance, entry and exit w.r.t price action near that level.
4) Avoid gap up or gap down chase. Wait and trade between levels.
Please refer below chart for levels.
Hope I made it easy to understand it.
Do comment your doubt or suggestion.
Note: Trade with Strict SL. It may or may not hit all the levels. So one can book profit / loss at respective level considering how price action works near that level.

UPL trade analysisThis is just for analysis purpose and no buy or sell recommendation.
Chart is self explanatory.

UPL Buying opportunityHead and Shoulder formation is taking place.
MACD is showing bullish cross over indication positive momentum on weekly chart.
Chart setup is good to long UPL for high targets.
UPL is currently operating in channel and once it breaks out of the channel, we can see very good movements coming.
Disclaimer: This is an educational chart analysis and not any kind of recommendation. Please invest accordingly at your own risk.
