KOTAKBANK is in uptrend - Target 1565 and 1723KOTAKBANK is in uptrend and oscillate in uptrend channel. it will move up and touch below targets.
Target 1 - 1565
Target 1 Date - 29th Aug
Target 2- 1723
Target 2 Date - 8th Nov
Watch out for break out line in orange color, if price break this level,then it will retrace and fall to retracement level.
Uptrend

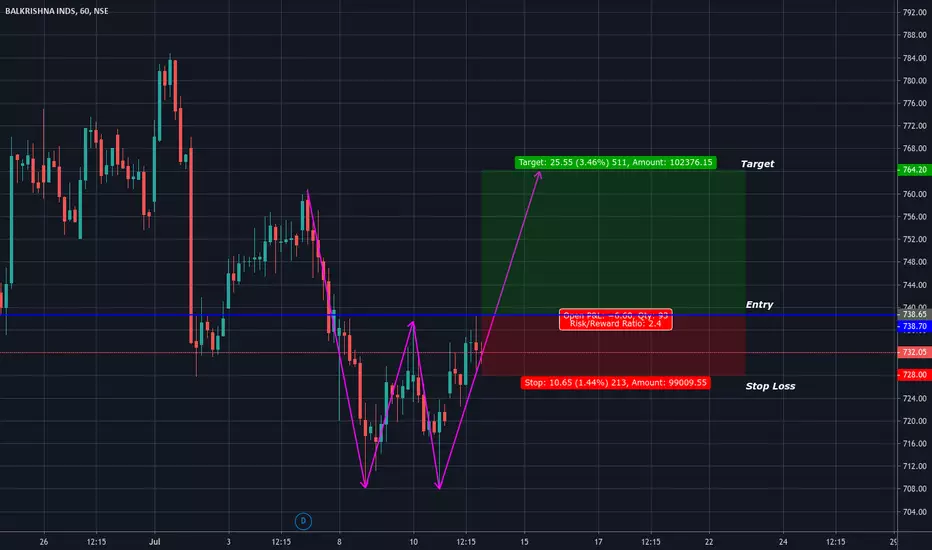
Double Bottom Formation for BALKRISIND Up Trend Ahead !For BALKRISIND ,there is a double bottom formation in the 1 hr chart signalling the re-tracement of the daily chart downtrend has started , if the price closes above 738.5 we can go for a long
position and the target will be 764
TRX-USDT (UP-trend)This analysis shows that wave 2-3 in good up move in Trx-Usdt pair. Expected coming resistance 0.51. After that, a healthy shortfall will occur in a manner to move in an upward direction.

Retrace of BTC BTC can go to back between $90k-$93k which is very good for a sign for upword movement for next target between $99k-$101k resistance.


Logical levels of TCS In an uptrend, when you buy in excess below value or somewhere in the bottom half of the value area, the take profit level is always at the control price. When an opportunity arises to buy just above the control, the take profit will be at the value high. The protective stop will always be below the tail of the smaller rejection value area on the lower time-frame that is used to enter the trade. The risk will always be smaller than the reward unless you are buying extremely close below the control price.


Another Bullish Pennant Ready to Boost Bitcoin up to @10kAnother Bullish Pennant Ready to Boost Bitcoin up to @10k . As mentioned in image the height of Pennant is the next target price , if it breakout. Normally Pennant formation is a continuous pattern, so there are more chances are for breakout in positive direction.

Maithan Alloys - Heating to Shape up - Good Investment (2)Technical: Strong breakout Awaiting
After a breakout from a downward trend line, it strongly went up and then consolidated for a while, now it is showing sign of breaking the strong consolidating, which may take the prices further up to the range of 650-750 levels, with stops at 500.
Fundamental: Undervalued
Market Cap: 1600 Cr.
P/E: 6.2
Debt to Equity: 0.01
Book Value: 285
Price to Book Value: 1.4
1. India's leading manufacturers and exporters of niche valued added Manganese Alloys, Ferro and Silico Manganese, used in manufacturing of stainless steel for enhancement in strength and durability of steel.
2. Provider to prominent domestic clients like Jindal Steel, Tata Steel, SAIL, Arcelor Mittal and to international clients like China Steel, Qatar Steel and more. Exports to 35 countries.
3. Consistent profit and sales growth due product niche in the market with commitment to efficiency and low cost curve.
4. Sales Boost through India's Infrastructure Growth and Housing for 2020 scheme by Govt.
5. Recently, invested 600cr for a new plant setup in Bankura to generate 1,20,000 tone
Overall, a strong management making consistent growth on low debt cost. The company is unvalued as per my analysis and it shall further move up to the price range of 3-4x of book value, which will be around 850-1150 levels.
Any opinions or comments on the same will be appreciated. Regards

Bullflag and new high in PNWPNW break out to new highs. A bullflag formed and the Price strongly reacts t the support.. Looks like PNW have a lot of upside potential.


Go long on ONGCONGC breaks the resistance channel and RSI is going in the overbought area. Also 20 days EMA is support.

Inverse Head-SShoulders FormationAn inverse HS Formation completed in BWA. After the break of the neckline the target could be round the area 51$. Stop loss 40.5$

Just Dial Down Trend | Trade NiveshJust Dial has denied news reports, and has said there has not been a data breach of 100 million users on its platform. It added, there was a vulnerability on its older version of the app which has now been fixed. The stock is down over 3 percent.
but according to my chart analysis just dial become very bullish share

Uptrend in FBFB formed a double Bottom from 11/18 to 02/19 which was confirmed by the succesful breakout on 14 january. Fueled by the earnings Reports on 30 january FB had a big upside gap. Now we have breakout of the consolidation and so we have further updside potential.
Profit Target 215$, Stop loss 165$
2:1 reward : risk ratio
FLong

Ethereum Short/Mid term target ($240)(Personal opinion - NOT A FINANCIAL ADVICE )
Since Bitcoin broke all the recent resistance levels like a hot knife slicing through a piece of butter, we do have a lot of reasons to be bullish on Cryptocurrencies for the mid term.
Dips on $ETH are worth buying and I'd consider levels below $150 to be a good buy . The price-action-squeezing triangle can seemingly breakout either ways so I'm going to be
cautious if the price is not able to maintain the bullish bias in the short term.
Sentiment would soon incline towards "GREED" in no time and we'll see moon boys screaming $10,000 BTC soon.
So beware of that kinda sentiment. I strongly believe we need to retest the lows again in order to maintain a Price - Strength for the next bull run!
Trade with caution and responsibilities, always hedge against your risk and never forget Stop Losses.

Teleflex buying oppurtunityTFX break out of a wide consolidation range and reached a new all time high. All moving averages go up and the stock Shows a lots of strength. A possible target is 330-336$ and the stop should be round 285$


CHF/JPY Technical analysisCHF/JPY is in an uptrend in the hourly charts.
It is forming higher highs consistently with the aid of an immediate trendline.
Hence we expect the pair to take support at the trendline and continue its momentum.


INDIGO REFUSING TO GO DOWNINDIGO following upper channel, making HH & HL.
Bears refusing to go down, bulls are ready to take charge.
KEEP IN WATCHLIST !!!

VOLTAS Above 200 sma BULLISHVOLTAS, DAILY Summer arrived BUY BUY BUY positive close above 200 sma short term target 550-580 long term target 650

intraday super imbalance indicator shows uptrend or downtrendits weightage to multiple timeframe ema (fast-slow) and overall sum of 3 timeframes which is lower than daily to show net movement direction / change for entry for buy and sell
