3. Reversal Target: 18,800 USD
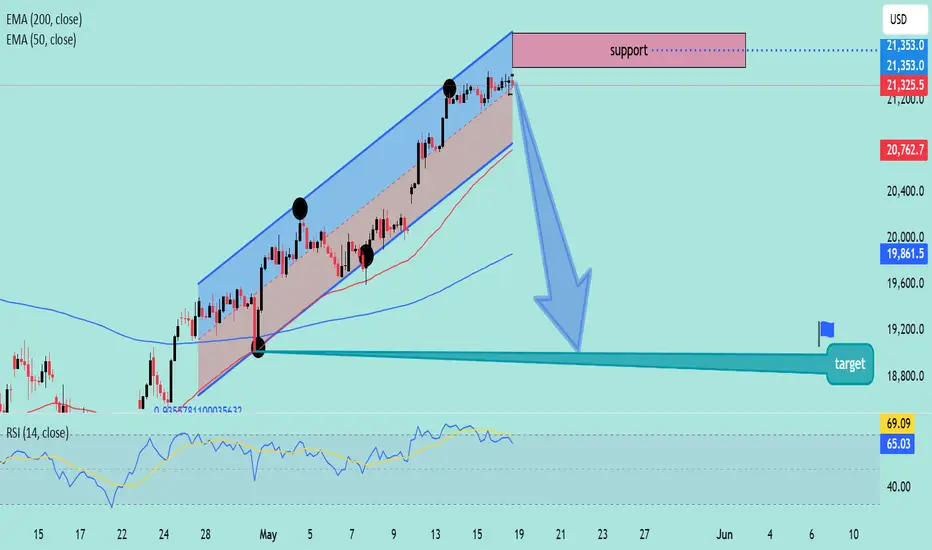
1. Price Action
The price has been trending within an ascending channel.
It recently touched the upper boundary of this channel and entered a resistance/support zone (marked in red at the top).
The blue arrow suggests a projected breakdown from the channel.
2. Support & Target
The target zone is marked around 18,800 USD, with a label and flag indicating this as a key level.
This zone is also aligned with a previous consolidation area and possibly strong historical support.
3. Indicators
EMAs:
50 EMA (red line): 20,762.7
200 EMA (blue line): 19,861.5
The price is currently above both EMAs, typically bullish, but divergence from the channel and potential resistance may imply an upcoming correction.
RSI:
Currently at 65.03, nearing overbought territory (70).
The RSI shows a bearish divergence—price makes higher highs while RSI stays flat or dips slightly.
4. Implications
If the price breaks below the channel and 50 EMA, a move toward 200 EMA or the marked target zone (around 18,800 USD) is likely.
Traders may look for confirmation via a break of lower trendline support, a strong red candle, or declining volume before entering short.
Us100short
US100Price came down with an impulse, started consolidating at our demand level, we anticipate a continuation to the downside after the accumulation
UShort

Nasdaq Elliott wave structureElliott Wave view in Nasdaq suggests the decline to 11035.20 ended wave (3). Wave (4) corrective rally ended at 12225.70 with internal subdivision as a wave A-B-C in a zigzag pattern.
Final leg higher wave C ended at 12225.70 which also completed wave (4). The Index has turned lower in wave (5), but it still needs to break below wave (3) at 11035.20 to rule out a double correction.
Internal subdivision of wave (5) is unfolding as a 5 waves impulse structure, where wave 1 completed near 11400, Now wave 2 rally is in progress to correct cycle where wave ((a)) and ((b)) had already ended and now wave ((c)) of 2 to end soon and Index to turn lower. Should sell on rise, On the way upside Invalidation level is pegged at 12230, and RK's stop line on daily chart can also be a hurdle to go up side, which is pegged at 12070, On closing below 20DMA can show more weakness, which is now pegged at 11621, Once its gone then more journey towards south can start, towards 11500, 11394, 11291, 11145, 10959, 10729 and 10441 too.
Overall wave structure along with all the key levels
Most investors treat trading as a hobby because they have a full-time job doing something else.
However, If you treat trading like a business, it will pay you like a business. If you treat like a hobby, hobbies don't pay, they cost you...!
Disclaimer.
I am not sebi registered analyst.
My studies are for educational purpose only.
Please Consult your financial advisor before trading or investing.
I am not responsible for any kinds of your profits and your losses.
NShort

US100 30 MIN INTRADAYSHORT TERM IDEA
I am gonna wait for LPSY to form before entering the trade and my SL will be 3 pips above the UTAD that is mentioned in the chart. Market is bearish in HTF but creating accumulation in smaller time frames.
UShort

UShort
