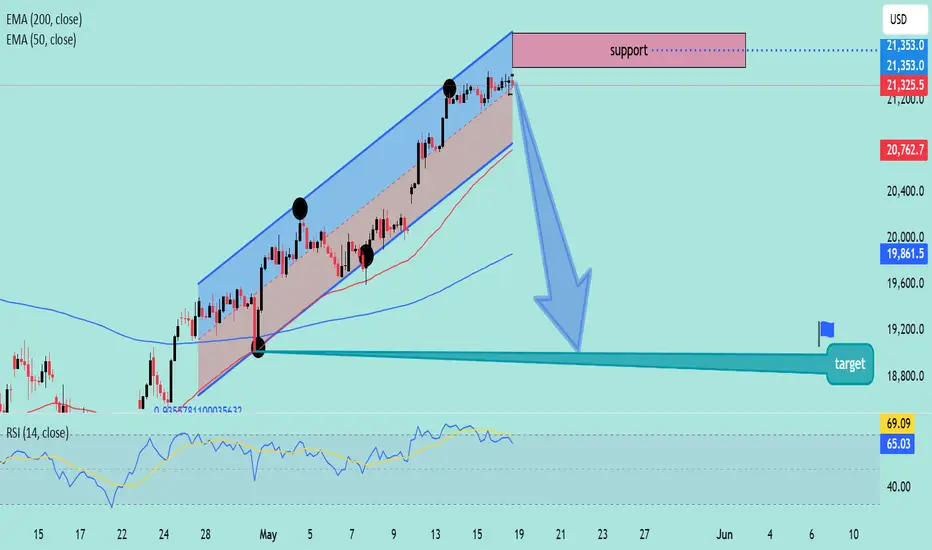
3. Reversal Target: 18,800 USD
1. Price Action
The price has been trending within an ascending channel.
It recently touched the upper boundary of this channel and entered a resistance/support zone (marked in red at the top).
The blue arrow suggests a projected breakdown from the channel.
2. Support & Target
The target zone is marked around 18,800 USD, with a label and flag indicating this as a key level.
This zone is also aligned with a previous consolidation area and possibly strong historical support.
3. Indicators
EMAs:
50 EMA (red line): 20,762.7
200 EMA (blue line): 19,861.5
The price is currently above both EMAs, typically bullish, but divergence from the channel and potential resistance may imply an upcoming correction.
RSI:
Currently at 65.03, nearing overbought territory (70).
The RSI shows a bearish divergence—price makes higher highs while RSI stays flat or dips slightly.
4. Implications
If the price breaks below the channel and 50 EMA, a move toward 200 EMA or the marked target zone (around 18,800 USD) is likely.
Traders may look for confirmation via a break of lower trendline support, a strong red candle, or declining volume before entering short.
Us100signal
NAS100 SHOWING A GOOD UP MOVE WITH 1:5 RISK REWARD NAS100 SHOWING A GOOD UP MOVE WITH 1:5 RISK REWARD
DUE TO THESE REASON
A. its following a rectangle pattern that stocked the market
which preventing the market to move any one direction now it trying to break the strong resistant lable
B. after the break of this rectangle it will boost the market potential for break
C. also its resisting from a strong neckline the neckline also got weeker ald the price is ready to break in the outer region
all of these reason are indicating the same thing its ready for breakout BREAKOUT trading are follws good risk reward
please dont use more than one percentage of your capitalfollow risk reward and tradeing rules
that will help you to to become a bettertrader
thank you

US100Price came down with an impulse, started consolidating at our demand level, we anticipate a continuation to the downside after the accumulation

US100 30 MIN INTRADAYSHORT TERM IDEA
I am gonna wait for LPSY to form before entering the trade and my SL will be 3 pips above the UTAD that is mentioned in the chart. Market is bearish in HTF but creating accumulation in smaller time frames.
