Us30analysis

TRADE SETUP US 30 short positions can be taken near upper rectangle zone marked with red arrows and long can be tried near lower rectangle near green arrows with sl above or below marked zones

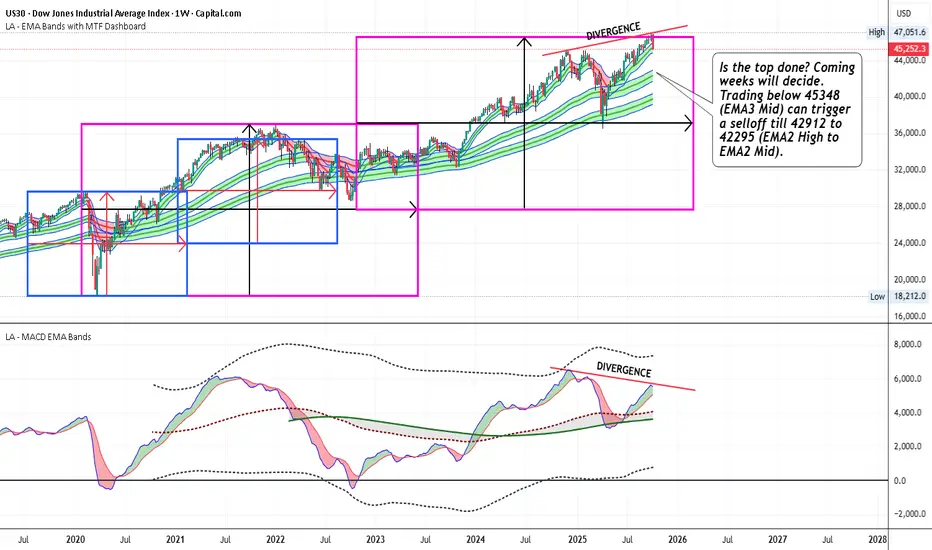
US30 - Trading below 45348 can trigger a selloff till 42912Is the top done? Coming weeks will decide. Trading below 45348 (EMA3 Mid) can trigger a selloff till 42912 to 42295 (EMA2 High to EMA2 Mid)
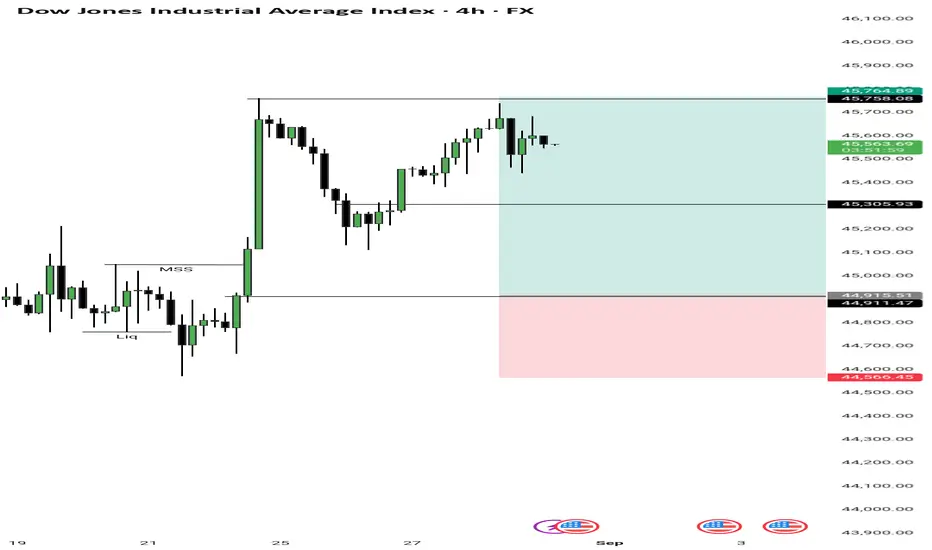
Dow Jones (DJI) – 4H Chart AnalysisMarket Structure:
Price grabbed liquidity (Liq) below recent lows.
A Market Structure Shift (MSS) occurred, confirming bullish intent.
Price rallied strongly after liquidity sweep, indicating smart money accumulation.
Entry Zone:
Entry placed near 45,305.93 (demand zone after MSS).
This aligns with bullish order block / demand zone where buyers previously stepped in.
Stop Loss:
SL at 44,566.45 (below liquidity sweep).
Protects against deeper liquidity hunts.
Target / Take Profit:
TP at 45,764.89 (recent swing high).
Clear liquidity resting above, providing a logical target.
Risk-to-Reward (RR):
Approx 1:2 RR (Risking ~740 points for a potential gain of ~460 points).
Good balance between safety and profitability.
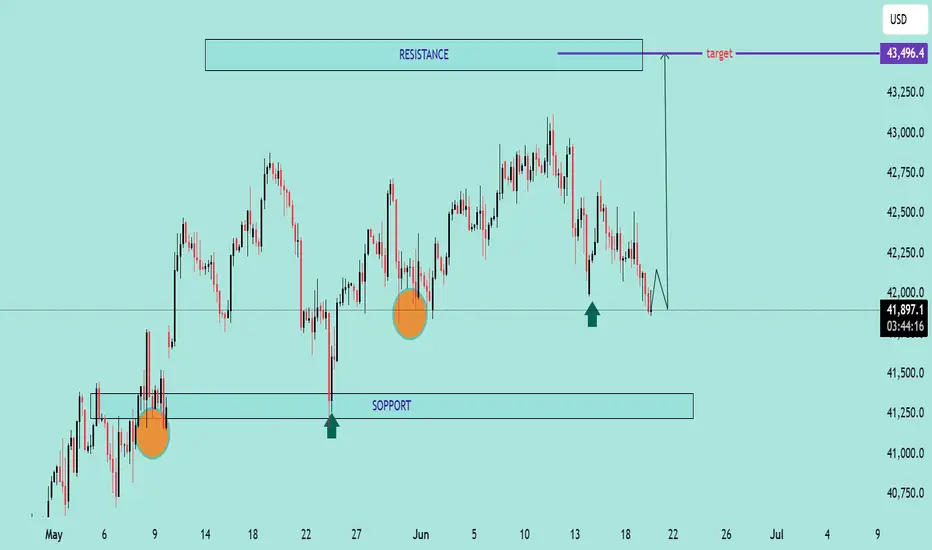
US30 Potential Rebound from Key Support ZoneUS30 Potential Rebound from Key Support Zone 🚀📊
📉 Analysis Overview:
The US30 (Dow Jones Index) is currently testing a major support zone near the 41,800–41,900 range, a level that has held firm multiple times in the past (highlighted with green arrows and orange circles). This area has acted as a demand zone, leading to strong bullish reactions previously.
🔍 Key Technical Highlights:
🔸 Support Zone: Clearly respected at ~41,800. Price is once again bouncing here.
🔸 Resistance Zone: Around 43,250–43,500. This area has acted as a ceiling, where price struggled to break through.
🟢 Reversal Indicators: Multiple successful defenses of the support zone suggest accumulation and possible bullish reversal.
📈 Target Projection: If support holds, the price may rally toward the target zone near 43,496.4, as shown by the purple arrow.
📌 Conclusion:
As long as the 41,800 support holds, US30 shows bullish potential toward the 43,500 resistance. A break below this zone would invalidate the bullish scenario and shift focus back to the lower support near 41,250.
🛑 Risk Management Tip: Watch for confirmation candles and volume before entering long positions. Always set a stop-loss below the support zone.
US30 – Bearish Setup Below Resistance Zone US30 – Bearish Setup Below Resistance Zone 🚨🟥
The US30 index is exhibiting signs of bearish momentum after repeated rejections from the key resistance zone near 43,200. Let's break down the technical picture:
🔍 Technical Analysis
📌 Resistance Zone (🟥 43,200 area)
Price was rejected twice from this resistance (marked by red arrows), showing strong seller presence.
Bearish candlesticks followed each touch, confirming exhaustion near this level.
📌 Support Zone (🟦 40,800 area)
The area around 40,800 has acted as a strong demand zone in the past (highlighted with green arrows and orange circles).
Price might revisit this area if current bearish structure continues.
📌 Intermediate Support (🟪 41,828)
This level serves as short-term support.
If broken, it could accelerate the decline toward the major support.
📌 Market Structure
Lower highs forming after each bounce indicate weakening bullish strength.
A potential bearish breakout pattern is forming (highlighted by the projected path).
📈 Conclusion & Trade Outlook
Bias: Bearish 📉
Trigger: Break below 41,828 support
Target: 40,800 zone
Invalidation: Break and close above 43,200 resistance

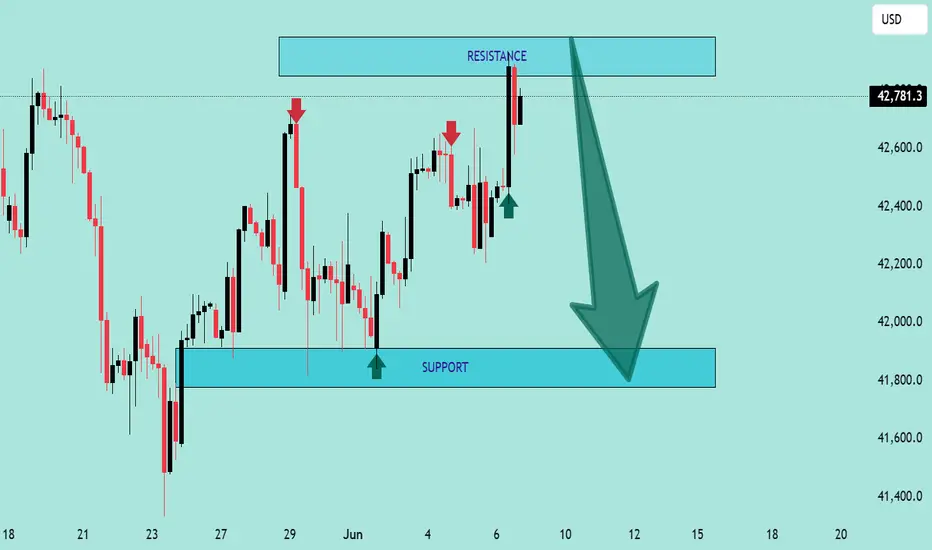
US30 Technical Analysis – 8th June 2025 US30 Technical Analysis – 8th June 2025
🔍 Chart Overview:
The chart shows a classic range-bound structure with clearly defined support and resistance zones.
📍 Key Zones:
🔼 Resistance Zone: ~$42,900 – $43,000
Marked by multiple rejections (🔴 red arrows).
Price has failed to close above this area convincingly.
Sellers are actively defending this level.
⚠️ Bearish pressure likely to increase if price stays below this level.
🔽 Support Zone: ~$41,750 – $41,850
Marked by strong bullish reactions (🟢 green arrows).
Buyers have stepped in consistently in this demand zone.
A breakdown below this level could trigger further downside momentum.
📈 Current Price Action:
The price is hovering around $42,781.3, just below the resistance zone.
The latest candlestick shows rejection from the top, forming a bearish wick, indicating potential reversal pressure.
The large downward arrow (⬇️) on the chart suggests a bearish bias is expected by the analyst.
📉 Outlook & Strategy:
🔻 Bearish Scenario (High Probability):
If price fails to break and sustain above $43,000, expect a move back down towards the support zone at ~$41,800.
A breakdown below support could lead to deeper downside, targeting $41,500 or lower.
🛑 Invalidation:
A clean breakout and daily close above $43,000 would invalidate the bearish setup and suggest potential continuation higher.
🎯 Trading Tips:
🔹 Short Bias: Look for short entries near resistance with tight stops above $43,000.
🔹 Target: $42,200 → $41,800
🔹 Risk Management: Always maintain a good risk-to-reward ratio and use proper stop-loss.
📌 Conclusion:
⚠️ The chart favors a bearish reversal from resistance unless bulls can push decisively above $43,000. Traders should watch for rejection patterns or breakdown confirmations to align with the bearish move.
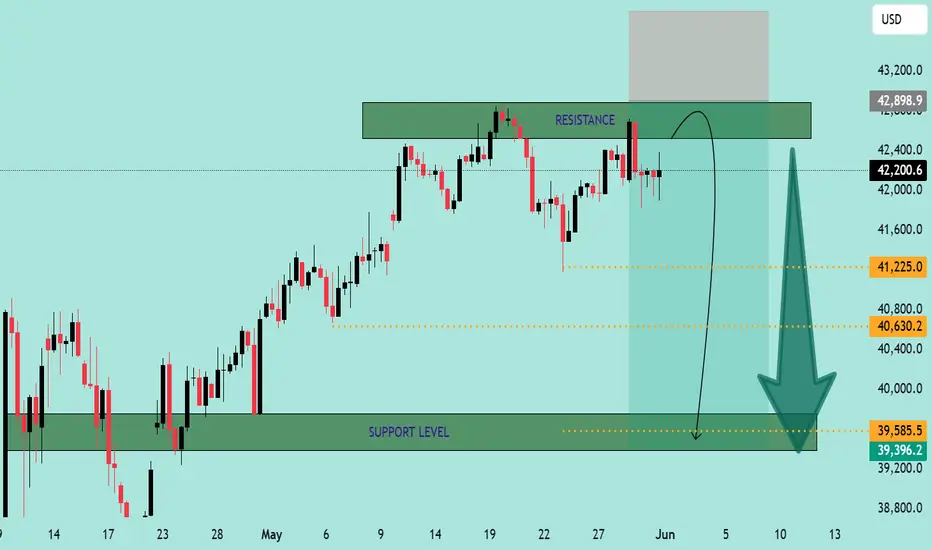
US30 Bearish Rejection at Resistance – Potential Drop Ahead📉 US30 Bearish Rejection at Resistance – Potential Drop Ahead 🚨
The US30 (Dow Jones Industrial Average) is exhibiting signs of bearish weakness after rejecting a strong resistance zone around 42,898.9 - 43,800.8. Here's a breakdown of the current market structure and outlook:
🔍 Technical Analysis
📌 Resistance Zone (Sell Pressure)
Price has failed to break above the marked resistance area multiple times.
Strong wicks and rejections indicate seller dominance near the top.
A short-term bounce into the resistance is anticipated before a likely reversal.
📌 Support Zone (Buy Interest)
The key support is at 39,396.2 - 39,585.5.
This zone has previously served as a strong demand area, with multiple bullish reversals in the past.
📌 Bearish Projection Path
Chart shows a potential rejection pattern playing out.
Price is expected to retest the resistance, then decline towards the support zone.
Intermediate support levels:
41,225.0
40,630.2
🔄 Outlook
🛑 Scenario A (Likely):
Price tests the upper resistance again and forms a double top or shooting star before declining toward the 39.5k support zone.
✅ Scenario B (Invalidation):
If price closes above 43,800 with strong volume, bearish bias will be invalidated, and a bullish continuation can be expected.
🧭 Trade Idea (Not Financial Advice)
🔹 Entry: Short near 42,800–43,000 (after confirmation)
🔹 Target 1: 41,225
🔹 Target 2: 40,630
🔹 Final Target: 39,585
🔹 Stop Loss: Above 43,800
Conclusion:
⚠️ The chart indicates a high-probability short setup unless bulls manage a strong breakout above resistance. Eyes on the price action near resistance for confirmation. 📉📊
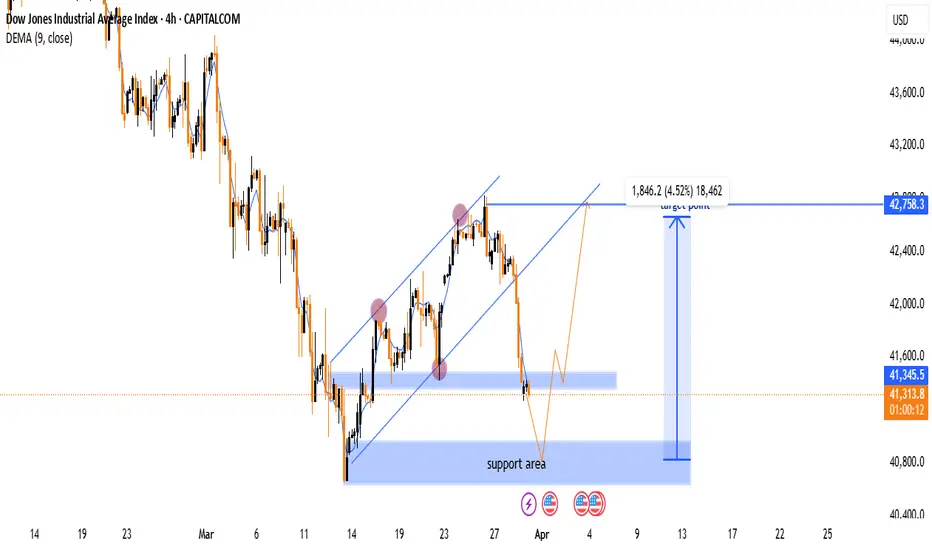
Dow Jones 4H Chart Analysis: Support Test & Potential Reversal 📉 Downtrend: The price was falling sharply before forming an upward channel.
📊 Channel Break: The price broke below the ascending channel 🚨.
🟦 Support Zone: The blue area marks a strong support region 📌.
🔵 Bounce Expected? If the price holds, a rebound could happen 📈.
🎯 Target: The projected upside target is 42,758.3 🚀.
⚠️ Risk: If the support fails, the price may drop further ⛔.
🔴 Watch for: A confirmed reversal near support or further breakdown!
Dow Futures Trading Strategy 05th December 2024Trading Strategy for Dow Futures:
Buy Strategy:
Entry Point: Enter a long position (buy) above the high of the candle that closes above 45230 on a one-hour timeframe. This means if a one-hour candle closes above 45230, you will buy once the price exceeds the high of that candle.
Stop Loss: Set a stop loss slightly below the low of the breakout candle to manage risk. For instance, if the breakout candle has a low of 45100, you might set your stop loss at 45090 to protect your capital.
Target: Determine your target based on historical resistance levels or a risk-reward ratio. For example, if you're risking 140 points (45230 to 45090), aim for a reward of at least 280 points (e.g., a target of 45510).
Sell Strategy:
Entry Point: Enter a short position (sell) below the low of the candle that closes below 44870 on a one-hour timeframe. This means if a one-hour candle closes below 44870, you will sell once the price drops below the low of that candle.
Stop Loss: Set a stop loss slightly above the high of the breakdown candle. For example, if the breakdown candle has a high of 45000, you might set your stop loss at 45010 to mitigate risk.
Target: Determine your target based on historical support levels or a risk-reward ratio. For example, if you're risking 140 points (44870 to 45010), aim for a reward of at least 280 points (e.g., a target of 44600).
Risk Management:
Use Stop Losses: Always use stop losses to protect your capital and limit potential losses.
Position Sizing: Never risk more than a small percentage (e.g., 1-2%) of your trading capital on a single trade.
Regular Review: Continuously monitor the market and adjust your strategy based on evolving conditions and new information.
Market Context:
Economic Indicators: Pay attention to key economic indicators such as employment data, GDP figures, and interest rate announcements that can impact Dow futures.
Geopolitical Events: Be aware of geopolitical events and developments that can cause significant market volatility.
Disclaimer:
Trading in financial markets involves substantial risk of loss and is not suitable for every investor. The strategies and opinions expressed are those of the author and do not necessarily reflect the views of Microsoft. Users should perform their own research and consult with a financial advisor before making trading decisions. Past performance is not indicative of future results.

Dow Futures Trading Strategy for 03rd December 2024Dow Futures Trading Strategy
Buy Strategy:
Condition: Look for the price of Dow futures to close above 45050 on a one-hour candle.
Entry Point: Identify the high of the candle that closes above 45050.
Action: Place a buy order above this high once the one-hour candle has closed above 45050. This confirms that the market is trending upward and you’re looking to ride the momentum.
Sell Strategy:
Condition: Look for the price of Dow futures to close below 44800 on a one-hour candle.
Entry Point: Identify the low of the candle that closes below 44800.
Action: Place a sell order below this low once the one-hour candle has closed below 44800. This confirms a downward trend, signaling a bearish market.
Current Price: The current price of Dow futures is 44880.
Disclaimer: This strategy is for informational purposes only and should not be considered financial advice. Trading involves risk, and you should do your own research or consult with a financial advisor before making any investment decisions.

Dow Futures Trading Strategy 29th November 2024Dow Futures Trading Strategy
Buy above the high of the one-hour candle which breaks and closes above 44980: Consider entering a buy position if the price breaks and sustains above the high of the one-hour candle and closes above 44980, indicating potential bullish momentum.
Sell below the low of the one-hour candle which breaks and closes below 44840: Consider entering a sell position if the price drops and closes below the low of the one-hour candle and breaks below 44840, indicating potential bearish momentum.
Example Analysis
Given the current price of 44930:
Buying above the high of the one-hour candle which breaks and closes above 44980: If the price breaks the high of the one-hour candle and closes above 44980, it suggests a potential upward trend.
Selling below the low of the one-hour candle which breaks and closes below 44840: If the price breaks the low of the one-hour candle and closes below 44840, it indicates a potential downward trend.
Disclaimer
Trading in financial markets involves significant risk and can result in the loss of your invested capital. It is crucial to conduct thorough research and consult with a financial advisor to understand the risks and develop a sound strategy.

Dow Trading Strategy for 28th November 2024Trade Strategy for Dow Futures
Buy: Enter a long position when the price moves above 45000 on a one-hour candle close.
Sell: Enter a short position when the price drops below 44780 on a one-hour candle close.
Current Price: 44879
Support and Resistance Levels
Support Levels:
44780: This is the first line of defense where the price might find support and potentially reverse upwards.
44500: If the price falls below 44780, 44500 acts as the next significant support level.
44000: This is a major psychological level that could provide strong support.
Resistance Levels:
45000: The initial barrier where the price might encounter resistance and potentially reverse downwards.
45200: If the price breaks above 45000, 45200 becomes the next key resistance level.
45500: This is a significant resistance level that could pose a challenge for further upward movement.
Disclaimer
Trading involves significant risk and it's important to do your own thorough research or consult with a professional financial advisor before making any investment decisions. The information provided here is for educational purposes only and should not be considered as financial advice. Always consider your risk tolerance and investment goals before engaging in trading activities.

Dow Futures Trading Strategy for 22nd November 2024Dow Futures Trading Strategy
Current Price: 43953
Trading Levels:
Buy Above 44150
Action: Wait for a one-hour candle to close above 44150 before entering a long position.
Target 1: 44280
Target 2: 44400
Stop Loss: 44000
Rationale: A breakout above 44150 indicates bullish momentum and the potential for an upward move.
Sell Below 43750
Action: Wait for a one-hour candle to close below 43750 before entering a short position.
Target 1: 43620
Target 2: 43500
Stop Loss: 43900
Rationale: A breakdown below 43750 signals bearish sentiment and potential for further downside.
Support and Resistance Levels:
Resistance Levels:
44150 (Immediate resistance and breakout level)
44280 (First target)
44400 (Major resistance)
Support Levels:
43750 (Immediate support and breakdown level)
43620 (First target)
43500 (Strong support level)
Important Notes for Traders
Candle Confirmation: Always wait for a confirmed one-hour candle close above or below the defined levels to avoid false breakouts.
Risk Management: Ensure your position size aligns with your risk tolerance. Use stop-loss orders to protect your capital.
Market Volatility: Monitor economic news, earnings announcements, and geopolitical events as they can significantly impact Dow Futures prices.
Disclaimer
This analysis is for educational and informational purposes only and does not constitute financial advice. Futures trading involves significant risk and is not suitable for every investor. You may incur losses greater than your initial investment. Always consult a licensed financial advisor or perform your own due diligence before making trading decisions. The author assumes no responsibility for any trading outcomes based on this information.

Dow Futures Trading Strategy 20th November 2024Dow Futures Trading Signal
Current Value: 43,409
Trading Levels:
Buy Above: 43,600
Trigger a long position when the price closes above 43,600 on a 1-hour candle.
Resistance Levels:
R1: 43,750
R2: 43,900
Sell Below: 43,250
Trigger a short position when the price closes below 43,250 on a 1-hour candle.
Support Levels:
S1: 43,100
S2: 42,900
Key Notes:
Always wait for confirmation of a 1-hour candle close above or below the specified levels before initiating trades.
Use proper risk management techniques, including stop-loss orders placed slightly outside key support and resistance zones.
Additional indicators like moving averages or MACD can provide further confirmation.
Disclaimer:
This analysis is for informational and educational purposes only and does not constitute financial advice. Trading futures involves significant risk and may not be suitable for all investors. Ensure you fully understand the risks involved and consult a licensed financial advisor before trading. Past performance does not guarantee future results. Trade responsibly.

Dow Futures Trading Levels for 19th November 2024. Dow Futures Trading Levels (Based on 1-Hour Candle Chart):
Buy Above: 43,670 (Consider entering a buy position if the price breaks and sustains above this level on the 1-hour candle, signaling potential bullish momentum.)
Sell Below: 43,375 (Consider entering a sell position if the price drops and sustains below this level on the 1-hour candle, signaling potential bearish momentum.)
Current Value: 43,520
Key Levels to Watch:
Resistance Levels:
43,750 – 43,800
43,900 – 44,000
Support Levels:
43,450 ,43,300 , 43,200
Trading Tips:
Book Profits Regularly: Take partial profits near key resistance levels or major price zones to secure gains.
Use Trailing Stop-Loss: Set a trailing stop-loss to protect your profits while allowing the trade to follow the trend.
Watch for Confirmations: Ensure price action sustains above or below the given levels on the 1-hour candle before entering trades.
Disclaimer:
This analysis is based on technical indicators and the 1-hour candle chart. The information provided is for educational and informational purposes only and should not be considered as financial or trading advice.
Risk Management Guidelines:
Always confirm price action (e.g., breakouts, breakdowns, or reversals) at the specified support and resistance levels before making decisions.
Use stop-loss orders and proper position sizing to minimize risk.
Stay updated on economic news and market events that may influence Dow Futures.
Risk Disclosure:
Trading futures involves substantial financial risk and may not be suitable for all investors. Prices can be highly volatile, and there is no guarantee of profit or protection against losses. Consult with a licensed financial advisor before making any investment or trading decisions. Trade only with funds you can afford to lose.

#DOWJONES ANALYSIS #US30Inverse H&S on Daily Chart breakout & retest complete. Shoulder tgt already achieved. Levels are marked on chart.

BUY US30This is the right time to buy US30 it took reversal at important key level and now its taking a good pull back at key zone.

US30USD 4H ProjectionUS30USD 4H Projection.
Dow Jones in ranging from last 10 Days.
The overall trend is bullish.
4H candle give confirmation for long.

US30Greetings!
Welcome traders.
By choosing to "Follow", you can stay updated with the latest information promptly. Kindly consider clicking "Boost" as well.
Wishing you a pleasant day.

US 30/ Dow Jones 1D Trade Setup - The US Index is currently trading on its All-Time High
- From a Trade Perspective, I would like to wait and watch out what the FED delivers in the FOMC statement
- The rate-cut bets are now fading away and making it look tough for traders that the FED will cut rates
- Inflation is currently sitting at 3.4%
- Cutting rates fundamentally doesn't look feasible as long as the FED doesn't achieve its target of 2%. We can see a mid-cool-off when FED achieves 2.5% once cut and maybe aggressive hikes post that along with some pause
- From a Trading Perspective, I would like to wait for a liquidity grab and then execute orders depending on the price action
- The inefficiencies currently look a little untapped, once the price taps it, I will start looking for longs
- DOL on this still needs to be tapped before you look for long
- Shorts on a scalp basis are preferable but don't swing short in a bull market

US30Greetings!
Welcome traders.
By choosing to "Follow", you can stay updated with the latest information promptly. Kindly consider clicking "Boost" as well.
Wishing you a pleasant day.

US30 - weeklyFor the Dow jones industrial average November had been a great month where we saw a rally from 32600 level, now finally the price has reached near the zone of 36600 to 37000 which is a resistance for the price, also the price is extended without any corrections, so we can expect a fall from this zone. This is not a financial advice, do your own research before placing any trades.
