US30 Potential Rebound from Key Support ZoneUS30 Potential Rebound from Key Support Zone 🚀📊
📉 Analysis Overview:
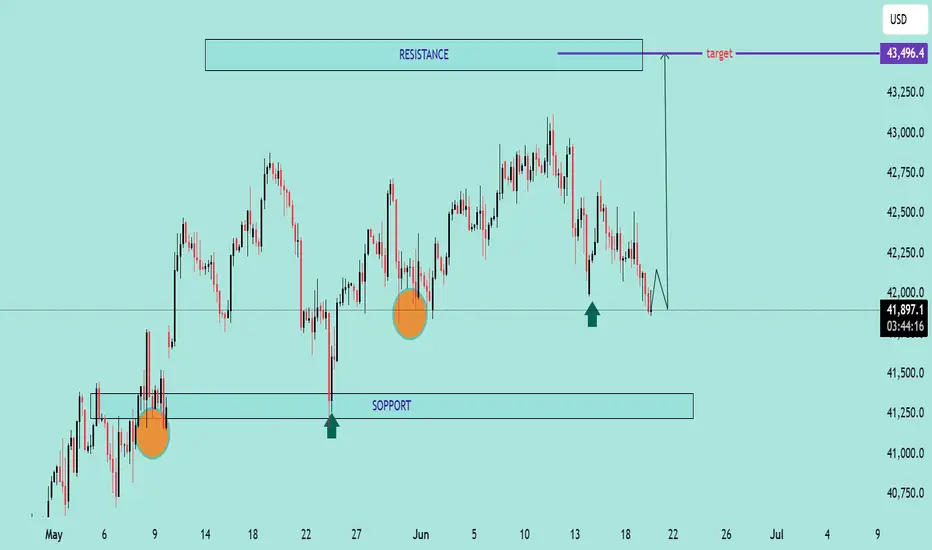
The US30 (Dow Jones Index) is currently testing a major support zone near the 41,800–41,900 range, a level that has held firm multiple times in the past (highlighted with green arrows and orange circles). This area has acted as a demand zone, leading to strong bullish reactions previously.
🔍 Key Technical Highlights:
🔸 Support Zone: Clearly respected at ~41,800. Price is once again bouncing here.
🔸 Resistance Zone: Around 43,250–43,500. This area has acted as a ceiling, where price struggled to break through.
🟢 Reversal Indicators: Multiple successful defenses of the support zone suggest accumulation and possible bullish reversal.
📈 Target Projection: If support holds, the price may rally toward the target zone near 43,496.4, as shown by the purple arrow.
📌 Conclusion:
As long as the 41,800 support holds, US30 shows bullish potential toward the 43,500 resistance. A break below this zone would invalidate the bullish scenario and shift focus back to the lower support near 41,250.
🛑 Risk Management Tip: Watch for confirmation candles and volume before entering long positions. Always set a stop-loss below the support zone.
Us30index
US30 – Bearish Setup Below Resistance Zone US30 – Bearish Setup Below Resistance Zone 🚨🟥
The US30 index is exhibiting signs of bearish momentum after repeated rejections from the key resistance zone near 43,200. Let's break down the technical picture:
🔍 Technical Analysis
📌 Resistance Zone (🟥 43,200 area)
Price was rejected twice from this resistance (marked by red arrows), showing strong seller presence.
Bearish candlesticks followed each touch, confirming exhaustion near this level.
📌 Support Zone (🟦 40,800 area)
The area around 40,800 has acted as a strong demand zone in the past (highlighted with green arrows and orange circles).
Price might revisit this area if current bearish structure continues.
📌 Intermediate Support (🟪 41,828)
This level serves as short-term support.
If broken, it could accelerate the decline toward the major support.
📌 Market Structure
Lower highs forming after each bounce indicate weakening bullish strength.
A potential bearish breakout pattern is forming (highlighted by the projected path).
📈 Conclusion & Trade Outlook
Bias: Bearish 📉
Trigger: Break below 41,828 support
Target: 40,800 zone
Invalidation: Break and close above 43,200 resistance

US30 Technical Analysis – 8th June 2025 US30 Technical Analysis – 8th June 2025
🔍 Chart Overview:
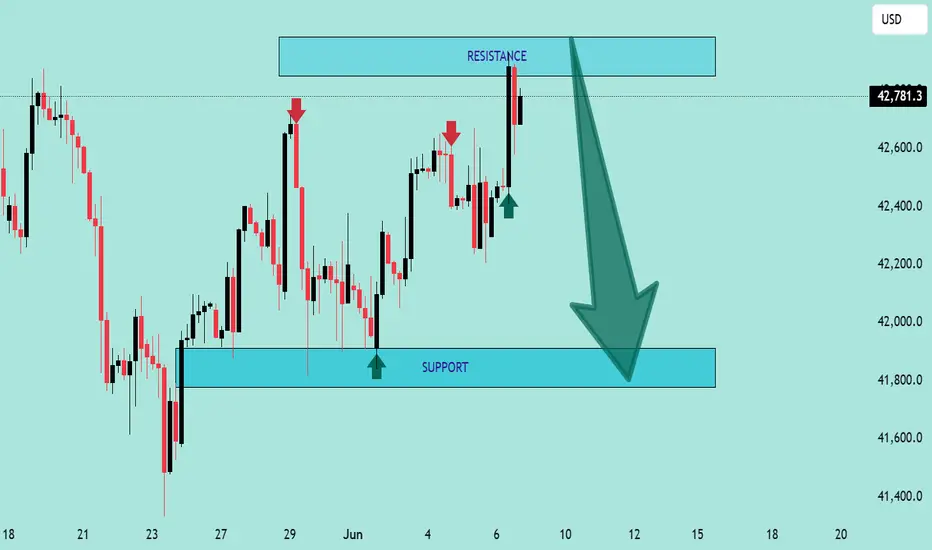
The chart shows a classic range-bound structure with clearly defined support and resistance zones.
📍 Key Zones:
🔼 Resistance Zone: ~$42,900 – $43,000
Marked by multiple rejections (🔴 red arrows).
Price has failed to close above this area convincingly.
Sellers are actively defending this level.
⚠️ Bearish pressure likely to increase if price stays below this level.
🔽 Support Zone: ~$41,750 – $41,850
Marked by strong bullish reactions (🟢 green arrows).
Buyers have stepped in consistently in this demand zone.
A breakdown below this level could trigger further downside momentum.
📈 Current Price Action:
The price is hovering around $42,781.3, just below the resistance zone.
The latest candlestick shows rejection from the top, forming a bearish wick, indicating potential reversal pressure.
The large downward arrow (⬇️) on the chart suggests a bearish bias is expected by the analyst.
📉 Outlook & Strategy:
🔻 Bearish Scenario (High Probability):
If price fails to break and sustain above $43,000, expect a move back down towards the support zone at ~$41,800.
A breakdown below support could lead to deeper downside, targeting $41,500 or lower.
🛑 Invalidation:
A clean breakout and daily close above $43,000 would invalidate the bearish setup and suggest potential continuation higher.
🎯 Trading Tips:
🔹 Short Bias: Look for short entries near resistance with tight stops above $43,000.
🔹 Target: $42,200 → $41,800
🔹 Risk Management: Always maintain a good risk-to-reward ratio and use proper stop-loss.
📌 Conclusion:
⚠️ The chart favors a bearish reversal from resistance unless bulls can push decisively above $43,000. Traders should watch for rejection patterns or breakdown confirmations to align with the bearish move.
Dow Futures Trading Levels for 19th November 2024. Dow Futures Trading Levels (Based on 1-Hour Candle Chart):
Buy Above: 43,670 (Consider entering a buy position if the price breaks and sustains above this level on the 1-hour candle, signaling potential bullish momentum.)
Sell Below: 43,375 (Consider entering a sell position if the price drops and sustains below this level on the 1-hour candle, signaling potential bearish momentum.)
Current Value: 43,520
Key Levels to Watch:
Resistance Levels:
43,750 – 43,800
43,900 – 44,000
Support Levels:
43,450 ,43,300 , 43,200
Trading Tips:
Book Profits Regularly: Take partial profits near key resistance levels or major price zones to secure gains.
Use Trailing Stop-Loss: Set a trailing stop-loss to protect your profits while allowing the trade to follow the trend.
Watch for Confirmations: Ensure price action sustains above or below the given levels on the 1-hour candle before entering trades.
Disclaimer:
This analysis is based on technical indicators and the 1-hour candle chart. The information provided is for educational and informational purposes only and should not be considered as financial or trading advice.
Risk Management Guidelines:
Always confirm price action (e.g., breakouts, breakdowns, or reversals) at the specified support and resistance levels before making decisions.
Use stop-loss orders and proper position sizing to minimize risk.
Stay updated on economic news and market events that may influence Dow Futures.
Risk Disclosure:
Trading futures involves substantial financial risk and may not be suitable for all investors. Prices can be highly volatile, and there is no guarantee of profit or protection against losses. Consult with a licensed financial advisor before making any investment or trading decisions. Trade only with funds you can afford to lose.

US30 - weeklyFor the Dow jones industrial average November had been a great month where we saw a rally from 32600 level, now finally the price has reached near the zone of 36600 to 37000 which is a resistance for the price, also the price is extended without any corrections, so we can expect a fall from this zone. This is not a financial advice, do your own research before placing any trades.

US30🛡US30 || #US30 price advanced with an impulse, the range is taken as a corrective move to continue bullish🎖🎖🎖
