US30 Potential Rebound from Key Support ZoneUS30 Potential Rebound from Key Support Zone 🚀📊
📉 Analysis Overview:
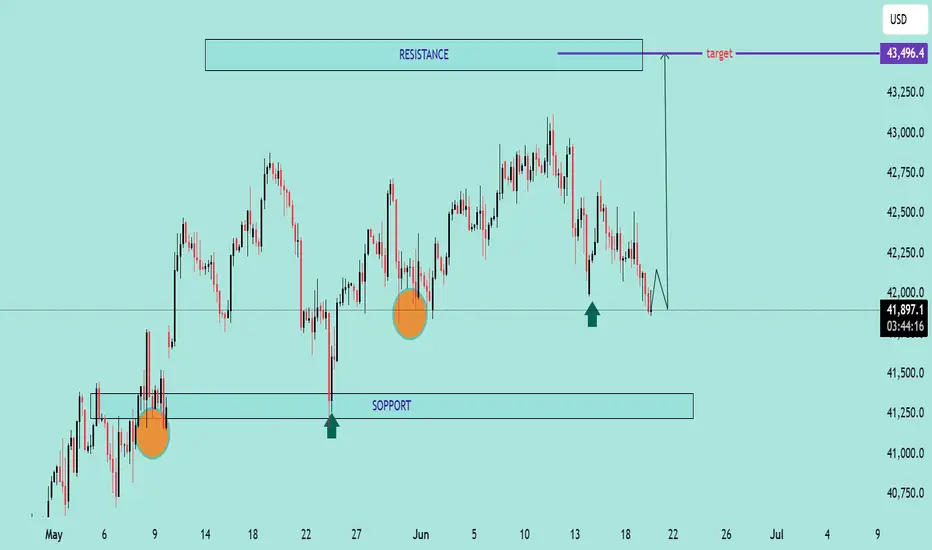
The US30 (Dow Jones Index) is currently testing a major support zone near the 41,800–41,900 range, a level that has held firm multiple times in the past (highlighted with green arrows and orange circles). This area has acted as a demand zone, leading to strong bullish reactions previously.
🔍 Key Technical Highlights:
🔸 Support Zone: Clearly respected at ~41,800. Price is once again bouncing here.
🔸 Resistance Zone: Around 43,250–43,500. This area has acted as a ceiling, where price struggled to break through.
🟢 Reversal Indicators: Multiple successful defenses of the support zone suggest accumulation and possible bullish reversal.
📈 Target Projection: If support holds, the price may rally toward the target zone near 43,496.4, as shown by the purple arrow.
📌 Conclusion:
As long as the 41,800 support holds, US30 shows bullish potential toward the 43,500 resistance. A break below this zone would invalidate the bullish scenario and shift focus back to the lower support near 41,250.
🛑 Risk Management Tip: Watch for confirmation candles and volume before entering long positions. Always set a stop-loss below the support zone.
Us30update
US30 Bearish Rejection at Resistance – Potential Drop Ahead📉 US30 Bearish Rejection at Resistance – Potential Drop Ahead 🚨
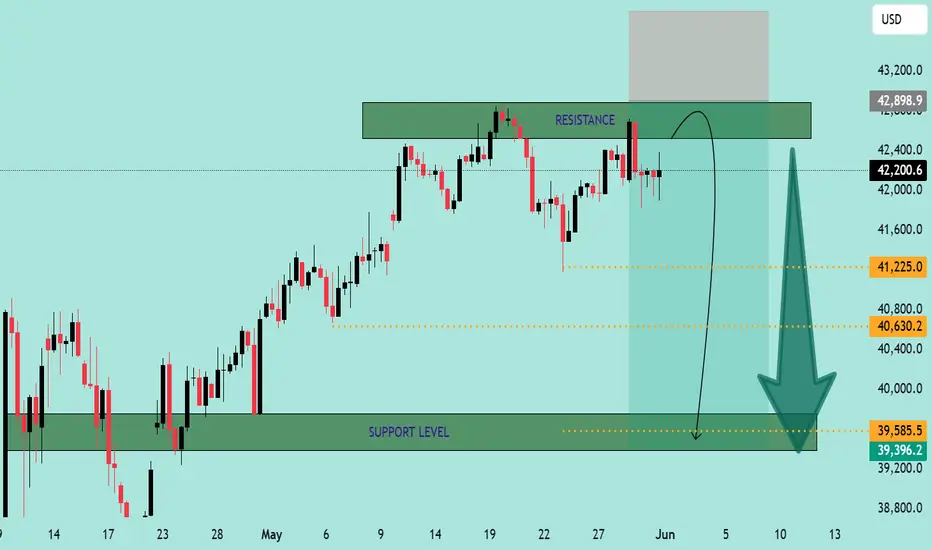
The US30 (Dow Jones Industrial Average) is exhibiting signs of bearish weakness after rejecting a strong resistance zone around 42,898.9 - 43,800.8. Here's a breakdown of the current market structure and outlook:
🔍 Technical Analysis
📌 Resistance Zone (Sell Pressure)
Price has failed to break above the marked resistance area multiple times.
Strong wicks and rejections indicate seller dominance near the top.
A short-term bounce into the resistance is anticipated before a likely reversal.
📌 Support Zone (Buy Interest)
The key support is at 39,396.2 - 39,585.5.
This zone has previously served as a strong demand area, with multiple bullish reversals in the past.
📌 Bearish Projection Path
Chart shows a potential rejection pattern playing out.
Price is expected to retest the resistance, then decline towards the support zone.
Intermediate support levels:
41,225.0
40,630.2
🔄 Outlook
🛑 Scenario A (Likely):
Price tests the upper resistance again and forms a double top or shooting star before declining toward the 39.5k support zone.
✅ Scenario B (Invalidation):
If price closes above 43,800 with strong volume, bearish bias will be invalidated, and a bullish continuation can be expected.
🧭 Trade Idea (Not Financial Advice)
🔹 Entry: Short near 42,800–43,000 (after confirmation)
🔹 Target 1: 41,225
🔹 Target 2: 40,630
🔹 Final Target: 39,585
🔹 Stop Loss: Above 43,800
Conclusion:
⚠️ The chart indicates a high-probability short setup unless bulls manage a strong breakout above resistance. Eyes on the price action near resistance for confirmation. 📉📊
US30🛡US30 || #US30 price advanced with an impulse, the range is taken as a corrective move to continue bullish🎖🎖🎖
