Crude Oil Long ??What could be the next move for Crude Oil after yesterday's attack of USA on Venezuela taking control of their Crude reserves. What does it mean for India, US Dollar and INR ?
USA

NZDCADThe pair remains in a downtrend and overall bearish, but I see a potential counter-trade opportunity. This could set up as a “buy to sell” scenario. I’ll be watching for a possible bounce toward the upside before resuming shorts. First area of interest is around the 0.8100 level, where I’ll wait patiently to see how price reacts.

EURNZDPrice action has been strongly bullish, with an impulsive push to the upside that took out a weekly high. That may have completed the price objective, which is why I’m now expecting a potential drop. A structure shift has already occurred and an entry was available, though I didn’t take it.
For now, I’ll stay on the sidelines and watch price action. If price reaches the demand zone, I’ll look for confirmation to get into longs. There’s also a large inefficiency/price void that could be filled on the way down. Let’s see how this pair develops — just sharing a possible scenario.

NZDJPY SELLSNZDJPY tapped the top of daily supply, aligning with the 88.0 region. While 4H structure is bullish, higher timeframes take priority. Price already flipped 15M structure, giving early bearish confirmation. Short makes sense here with a conservative stop above the daily high. And also if you look at the daily timeframe you can see how bears are in control, 3 times stronger.
Couple of downside targets so let's see.

DRAGONFLY LTDDRAGONFLY INC, as per chart view it formed FALLING WEDGE PATTERN and made breakout with entry level $6.88 with EMA crossover. We can expect the Final target to $13.

DRAGONFLY INCDRAGONFLY INC, as per chart view it formed FALLING WEDGE PATTERN and made breakout with entry level $6.88 with EMA crossover. We can expect the Final target to $13.

FLUENCE ENERGYFLUENCE ENERGY MADE DOUBLE BOTTOM with DIVERGENCE in monthly chart and also in process of forming CUP & HANDLE FORMATION, and it is at resistence level at $24, if it breaksout resistance at $24 we can expect to reach $30 & $44.
Chart analysis done on best of my knowledge, it may reach or may not reach targets :-)

KAZIA THERAPEUTICS LTD SPONSORED ADRKZIA made double bottom with divergence with good volume and breakout at $4.45 with first target of $22.5, if and second target of $41.7 and with can expect strong resistance at $41.7 and reverse might happen. If KZIA did breakout at this level we can expect rally till $79.
Analysis is made on weekly time fame for long term view
It is just my chart analysis upto best of my knowledge. As it is share market anything happen because market effects on many things happen in the world.
Thank you

AUDJPY SELLSCurrent price action is bearish, with downside momentum confirming bearish order flow. Before considering shorts, I reviewed where price previously pushed higher and identified a key daily demand zone — an unmitigated wick that sparked the last major bullish move. This is important context: even though the 4H structure is bearish, bulls could still step in with enough volume to break supply.
I unfortunately missed the long entry at that demand zone, which would have been an ideal trap for a win–win scenario. For now, I’ve marked the nearest supply zone. Price just missed tapping into it, so I’ll patiently wait for when it taps. And then I’ll look for confirmation to enter shorts if the opportunity sets up.

GBPNZDPrice is currently in an uptrend, with a strong impulse to the upside completed in just 7 bars. The pullback has already taken 15 bars, showing clear weakness from the bears. I’ll be watching for price to reach the demand zone, and will look for confirmation on lower timeframes before considering long entries. In case price pushes higer I am expecting it taking out the high and liquidity on HTF, then possible sell to buy setup can present. Let's see.

AUDNZD Buy or Sell? AUDNZD tapped into the 4H Supply zone I’ve been monitoring for some time. On Friday, we also saw a bearish structure flip on the 15-minute timeframe — a potential signal that price may break the current demand zone and shift structure to the downside.
I didn't take any positions on Friday, but going into this week, my focus will be on the 4H Demand Zone for possible long opportunities. I’ll be watching how price reacts there — if we get bullish confirmation, I’ll consider a long setup.
For now, shorts don’t offer a favorable R:R, so I’ll remain on the sidelines unless demand breaks. If that happens, I’ll take the same approach, watching for clean structure and new entry zones.
Patience until the market reveals what it wants to do next.

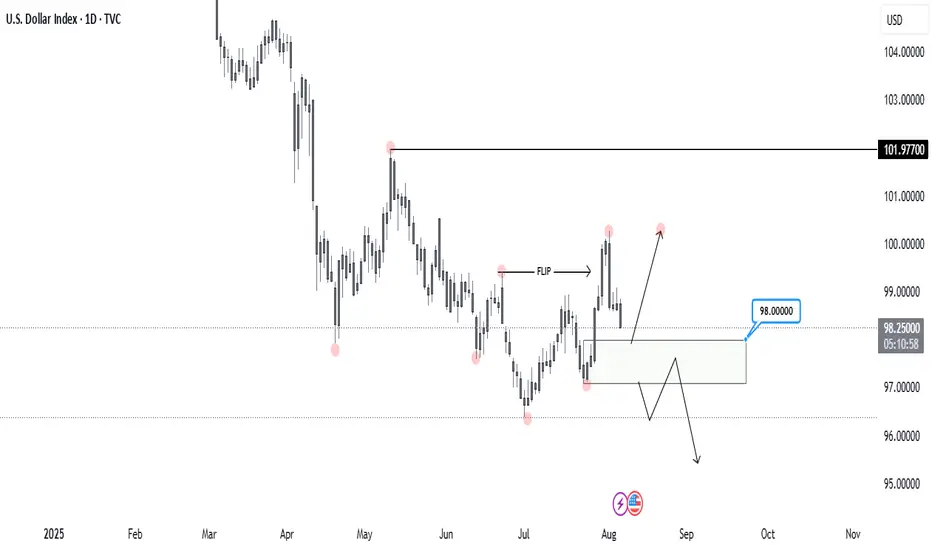
DXY, DAILYLet’s take a look at DXY on the Daily timeframe.
Price recently broke the previous Higher Low, flipping the structure to the downside. This marks a significant shift in momentum.
Now, I'm watching the 98.000 level, which I’ve identified as a Daily Demand Zone. It’s the origin of the move that broke the previous bearish structure, making it a key area of interest.
I’ll be waiting for a reaction from this zone to see if buyers step in again ( most likely ) or if the bearish momentum continues.
That would be my confirmation for xxx/usd shorts.
NZDJPYValid trade opportunity, trying to get into buys before sells. 4H is bearish but price needs to retrace back up to balance the leg. Let's see how it goes.

EURCAD BUYSPrice flipped the 4H structure on EURCAD, making a new higher high and shifting bullish. I’m watching for a retrace back down into the demand zone around 1.58500 that caused the flip.
Looking for buyers to come in here again and push the price higher. Will wait for some confirmation on the 15-minute chart before entering.

EURUSD after NFPFollowing Friday’s NFP release, EURUSD flipped bearish structure. I’m now looking for a retracement into a key demand zone, where I’ll be watching for buy setups.
Until then, I’ll look for a possible sell-to-buy scenario — shorting the move down into demand, and then reassessing for bullish confirmation.
Let’s see how price reacts on Monday.

EURNZDEURNZD Market Outlook
The price on EURNZD has recently approached the 4H Supply Zone around the 1.96000 level and has flipped the short-term bearish structure, indicating potential bullish momentum. However, given the presence of supply, I'm monitoring the possibility of a retracement from this zone.
My primary scenario involves a short-term rejection from the 1.96000 Supply Zone, targeting a move down into the 1.94000 Demand Zone. From there, I will look for a sell-to-buy setup, with the intention of positioning for a larger upside continuation, provided bullish order flow confirms.
Alternatively, if buyers prove to be significantly strong and supply fails to hold, price may break through the 1.96000 zone and extend higher towards the daily wick area near the 1.98000 level.
Both scenarios remain valid depending on price action and volume behavior at key levels.
Will be watching 15min structure before entering any trade.

GBPJPYThe 4-hour structure on GBP/JPY has turned bullish following a strong upward move that flipped the previous structure after several days of consolidation and limited volatility.
Price has now entered a Demand zone and is likely to retrace toward the 197.500 level, which aligns with a key psychological handle.
This area may present a high-probability trading opportunity, depending on how price reacts. We'll monitor for confirmation before entering a position.

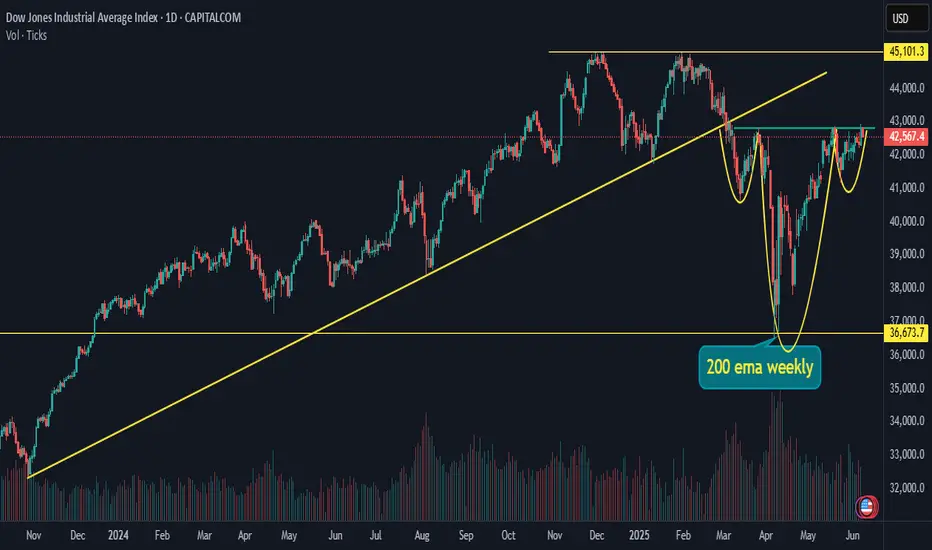
US 30 / Dow Jones / DJI forming bullish patternLooking at US30 US market is forming a bullish pattern called inverted Head and shoulder breakout can lead to a target of all time high.
BTCUSD updated viewA resistance zone was created on BTCUSD at the 99113 - 99944 level.
Also at the same level from top to bottom one resistance trend line shows strong resistance in that area. while looking at the HNS pattern in RSI on a closing basis and both the resistance zone and trendline we need a strong closing above the zone with the trendline breaking, then we can see the bigger target in BTCUSD.
otherwise, BTCUSD will take the resistance from the trendline and zone and can see the support level again.
I already shared what-if support level breaks.

TCS - Swing Trade - 22nd February #stocksTCS (1D TF) - Swing Trade Analysis given on 22nd Feb, 2024
Pattern: FALLING WEDGE
- Pullback candle at Support - Done ✓
- Volume spike at Support - Done ✓
- Trendline Resistance Breakout - In Progress
- Retest & Consolidation - In Progress
#stocks #swingtrade #chartanalysis #priceaction #traderyte #TCS #stockmarket #sharemarket #viral #sharemarketindia #StockMarketindia

"Chart Long Positions to Maximize Profit Potential in Market 🌊"In the thrilling realm of financial markets, a remarkable phenomenon emerges - bullish momentum. It's a force that sends shockwaves of excitement throughout trading floors and investment communities alike. When bullish momentum takes hold, market bulls charge forward, igniting a rally of profits and a euphoric sense of optimism. Investors flock to the scene, driven by the belief that the tide has turned in their favor. As this momentum builds, gains multiply, creating a virtuous cycle of wealth creation. Traders, astutely recognizing the opportunities at hand, ride this wave of bullish momentum, strategically positioning themselves for maximum profitability. With every uptick in prices, the air is filled with anticipation, and the potential for substantial returns becomes a tangible reality. From strength to strength, the power of bullish momentum propels markets to new heights, reaffirming the dynamic nature of the financial landscape.

SPX towards a new life high in sessions to comeCircle areas represent trendline support
strong reliable breakout in spx 500
it suggest US market to blast big from here and no surprise we can see all time high in month to come
the weekly breakout suggest continuation

Dow Jones Industrial Index Technical Study TVC:DJI
Analysis After 9th Dec 2022 Closing
> Dow Theory wise - It was Making HH &HL but After Last day of closing, it seems like there will be no another HH Furthermore in Weekly TF it has made Evening Star pattern also. (Bearish)
> Wave Count wise - 5th Impulse wave is also finished, so probably corrective wave ABC might be possible for next week for DJI. (Bearish)
>Chart Pattern Wise - Head & Shoulder pattern is about to formed, confirmation after breakdown of neckline shown in chart. (Bearish)
Bearish Divergence is also there in MACD and RSI too.
Furthermore,
According to chart, just below neckline there is crucial red line, breakdown of that line red line is confirmation for all the above points.
Medium Term Target is end of 4th Impulse wave because of Depth off Correction Concept.
What if Analysis
Ignore this study, if on next trading day market opened with huge GAPUP and gone up.
