USDCAD ON 2H Time frame Head and shoulder pattern.As you can see market is forming head and shoulder pattern if market breaks the neckline we can sell with LTF
Usdcadanalysis

USDCAD on 1hr time frame As you can see market is following trend line and if it breaks we can see massive fall. After getting lower time frame confirmation we can enter.
Plan your trade accordingly.

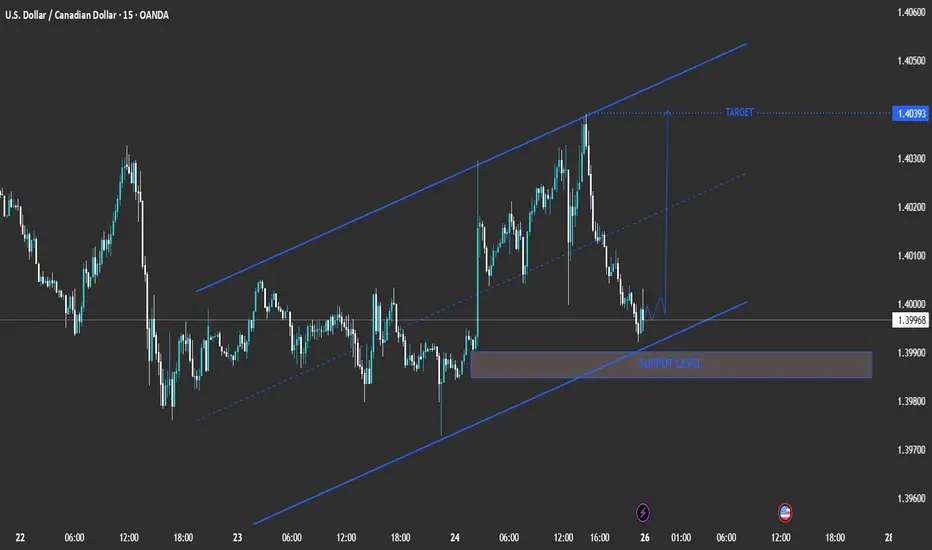
technical analysis of your chart for USD/CAD (15-minute timeframMarket Structure
The pair is moving within an ascending channel, indicating short-term bullish momentum.
Higher highs and higher lows confirm the ongoing uptrend structure.
🟦 Key Zone
Support Level: 1.3985 – 1.3990
This shaded zone represents a demand area where price previously found strong buying interest.
As long as this level holds, the short-term bullish bias remains valid.
🔹 Price Action Outlook
Price is currently testing the lower trendline of the channel and near the support zone.
A bullish reaction from this level could trigger a bounce toward the mid-channel and potentially the upper resistance.
🎯 Target
Upside Target: 1.4039
This corresponds to the upper boundary of the channel and a previous swing high area.
⚠️ Invalidation / Risk Level
A break below 1.3980 would invalidate the bullish setup and could lead to a bearish correction toward 1.3965 or lower.
📈 Trading Signal (Summary)
Bias: Bullish (short-term)
Entry Zone: 1.3985 – 1.3995 (support area)
Target: 1.4039
Stop-Loss: Below 1.3980 FX:EURUSD OANDA:EURUSD OANDA:GBPUSD FX:USDJPY OANDA:USDJPY OANDA:AUDUSD OANDA:GBPJPY OANDA:USDCAD OANDA:USDCHF FX_IDC:USDINR FOREXCOM:EURUSD OANDA:EURNZD
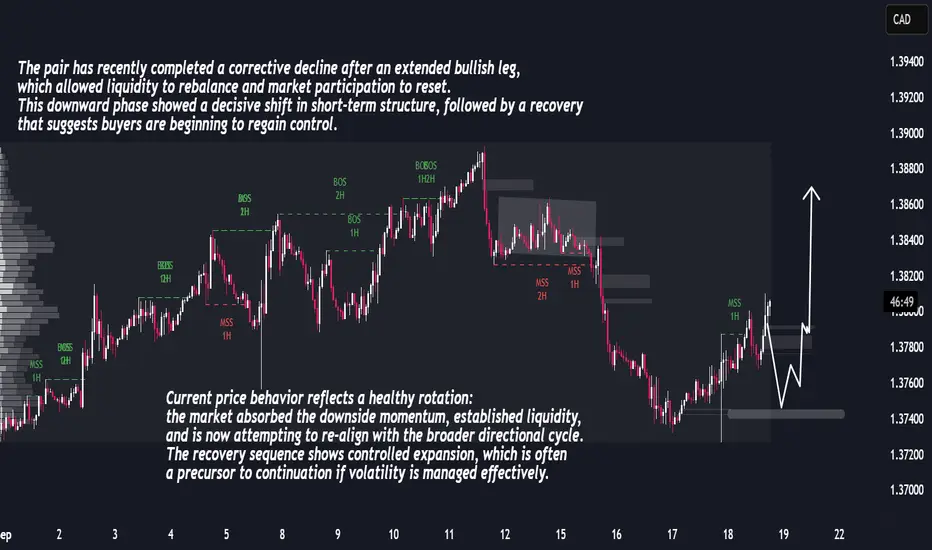
USDCAD Analysis – Market Recovery and Bullish OutlookUSDCAD Analysis – Market Recovery and Bullish Outlook
USDCAD Market Report
USDCAD is emerging from a completed downside leg into a constructive recovery cycle. The prior bearish momentum created imbalance, but recent order flow shows that liquidity has been absorbed, allowing buyers to regain control. The transition reflects a clean structural shift, where corrective pressure is evolving into directional expansion.
The sequence of price action highlights disciplined progression: accumulation at lower levels, controlled impulsive candles, and measured volatility. This behavior signals that the market is not in exhaustion but in the early stages of a potential bullish leg. The rotation from decline into expansion suggests renewed confidence from larger market participants.
Looking ahead, the pair remains positioned for continuation. The rhythm of correction followed by orderly advancement underlines a resilient structure, with market dynamics favoring sustained upside development in the medium term.
USD/CAD(20250912)Today's AnalysisMarket News:
U.S. initial jobless claims surged to 263,000 in the week ending September 6, reaching a near four-year high. Traders are fully pricing in three Federal Reserve interest rate cuts by the end of 2025.
Technical Analysis:
Today's Buy/Sell Levels:
1.3848
Support and Resistance Levels:
1.3911
1.3887
1.3872
1.3824
1.3809
1.3785
Trading Strategy:
If the price breaks above 1.3848, consider entering a buy position, with the first target at 1.3872.
If the price breaks below 1.3824, consider entering a sell position, with the first target at 1.3809.

USD/CAD(20250908)Today's AnalysisMarket News:
Non-farm payroll growth fell significantly short of expectations, with June's data revised downward to negative territory, marking the first contraction since 2020. The unemployment rate hit a nearly four-year high.
Technical Analysis:
Today's buy/sell levels:
1.3812
Support and resistance levels:
1.3909
1.3873
1.3850
1.3775
1.3752
1.3715
Trading Strategy:
If the price breaks above 1.3850, consider a buy entry, with the first target at 1.3873.
If the price breaks below 1.3812, consider a sell entry, with the first target at 1.3775

Bearish Still Valid with Dual TPsThe Sell signal was already triggerred on Wednesday 27th August with the hope that it will hit the TP1 area which is at 1.3683.
Offcourse, it retraced without hitting the required TP which is still indicating the validation of TP 1.
Now the price is availalbe at extremely discount level. A ride with Bearish from here @1.3825 will lower the risk for us and giving us another opportunity to ride on bears.
I usually take two positions, each 1% risk. both has same SL @1.3929.
Move SL to Break even if TP1 hit and let position 2 head towards TP2 with 0 risk.
Signal:
Position No. 1 (1:1 Risk to Reward)
Entry price: 1.3825
SL: 1.3929
TP: 1.3683
Position No. 2 (1:2 Risk to reward and then 0:2 Risk to reward if after hitting TP1.
Entry price: 1.3825
SL: 1.3929
TP: 1.3561

USD/CAD(20250905)Today's AnalysisMarket News:
① Waller: I believe we should cut interest rates at the next meeting. Multiple rate cuts are possible in the future, but the exact pace depends on the data.
② Musallem: Current interest rates are appropriate, but there are risks in the job market.
③ Bostic: Concerned about inflation, I still believe one rate cut this year is appropriate.
④ The Federal Reserve will hold a payments innovation conference on October 21st, which will discuss stablecoins, artificial intelligence, and tokenization.
⑤ Fed Governor nominee Milan: If confirmed, I will maintain the independence of the FOMC.
⑥ Kashkari: There is room for a modest rate cut.
⑦ The Federal Reserve Beige Book: Economic activity is roughly flat, with businesses and households feeling the impact of tariffs.
Technical Analysis:
Today's Buy/Sell Levels:
1.3791
Support and Resistance Levels:
1.3824
1.3812
1.3804
1.3778
1.3770
1.3757
Trading Strategy:
If the price breaks above 1.3804, consider entering a buy position, with the first target price at 1.3824.
If the price breaks below 1.3791, consider entering a sell position, with the first target price at 1.3778

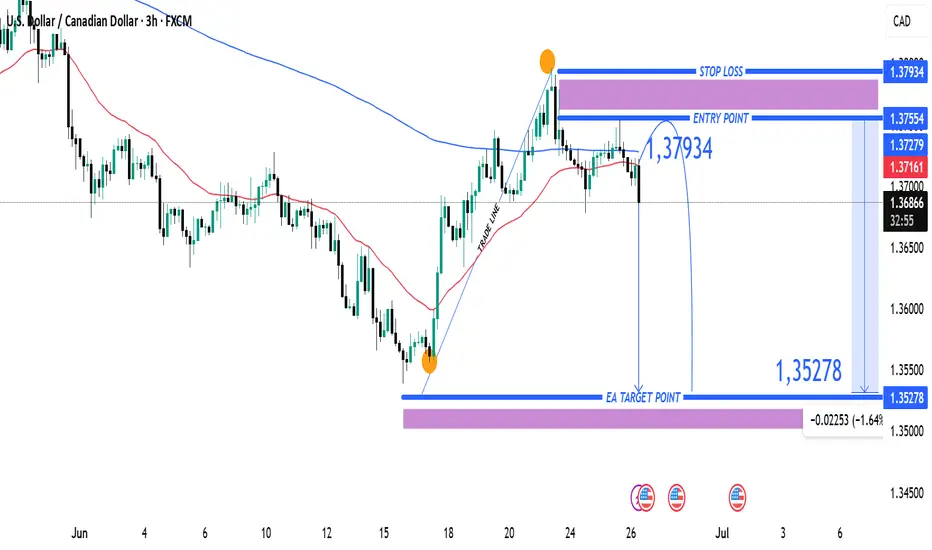
USDCAD Bearish Reversal Trade Setup – 3H Chart Analysis (June 26 Entry Zone: 1.37279 – 1.37554
🔹 Stop Loss: 1.37934
🔹 Target: 1.35278
🔹 Risk-to-Reward (RR): ~1:2.5
🧠 Technical Breakdown
Trend Overview:
Overall trend shows a downtrend from earlier June, followed by a corrective bullish move.
Price failed to sustain above the 200 EMA (blue line), indicating continued bearish pressure.
Trade Line Break:
A steep bullish trendline was broken, signaling a potential trend reversal or deeper pullback.
Bearish Rejection Zone:
The purple zone (1.37279 – 1.37554) acted as resistance.
Price formed a lower high and rejected this zone, confirming selling interest.
Entry Strategy:
Short entry is ideally within or just below the rejection zone.
Aggressive entry already in play at current market price (1.36909) after confirmation.
Target Zone:
Projected towards 1.35278, aligning with previous support and fib retracement zone.
Large purple support zone near the target suggests a potential reversal area.
⚠️ Risk Notes
Be cautious of USD volatility due to upcoming economic events (noted with icons on the chart).
Stop loss above previous swing high minimizes risk of fakeouts.
✅ Summary:
This is a bearish swing setup aiming for a significant drop toward 1.35278. The clean rejection from resistance and trendline break supports a high-probability short opportunity with favorable risk-reward.
USDCAD - IS A BULLISH TREND REVERSAL BREWING?Symbol - USDCAD
USDCAD is staging a recovery supported by the recent strength in the US dollar. A potential return to the prior demand zone could reinforce the bullish case for the pair and present an opportunity to establish long positions.
Amid the backdrop of dollar strength, the market appears to be transitioning into a new phase. The pair has ceased making lower lows and is now forming an EQL structure, from which it is attempting to break out of the prevailing downtrend. While the initial liquidity retest may lead to a brief correction, a swift rebound and sustained consolidation above this level would confirm the emergence of a bullish market structure.
Resistance levels: 1.3700, 1.3730
Support levels: 1.3660, 1.3648
Despite the recent breakout above descending resistance, selling pressure remains evident, with sellers likely to re-enter near the 1.3686 level. A clear breakout above this area, followed by a shift in market sentiment and consolidation above the 1.3675–1.3686 zone, would validate bullish intent and signal readiness for a broader recovery.

USDCAD - SUPPORT UNDER PRESSURE, WILL THE DOWNTREND CONTINUE?Symbol - USDCAD
CMP - 1.3803
USDCAD continues to test the support within its established trading range amidst a broader global downtrend. While the currency pair remains confined within this range, the pressure on the support persists. The market’s response to false breakouts appears to be weakening, and the price action continues to challenge the 1.3780 level, thereby increasing the likelihood of a further decline.
The US Dollar is showing signs of retreating from resistance and is beginning to decline, exerting a corresponding effect on USDCAD. Should the currency pair breach the 1.3780 level and establish a sustained close below it, this could signal the continuation of the prevailing trend following a consolidation phase.
Resistance Levels: 1.3810, 1.3830
Support Levels: 1.3780, 1.3740
The primary focus remains on the lower boundary of the trading range at 1.3780, The role of this range is to provide consolidation amidst a broader downtrend. Therefore, a decisive breakout below support would likely trigger the initiation of the distribution phase.

USD/CAD 1H Supply Zone Reversal Setup – Bearish Trade Plan🔵 Supply Zone (Resistance)
📍 1.39457 – 1.40000
Price is expected to face selling pressure here. This is a potential reversal area.
🔽 Entry Point: 1.39457
👀 Waiting for price to enter the supply zone before a possible drop.
❌ Stop Loss: 1.40000
🔺 Just above the supply zone – if price breaks this level, the bearish setup is invalid.
🎯 Target: 1.37500
✅ This is the expected take-profit level if price reverses from the supply zone.
Plan Summary
📈 Wait for price to enter the blue supply zone
🛑 Place stop loss at 1.40000
✅ Target at 1.37500
🔄 Risk-to-reward ratio is favorable (~1:2.5)
Chart Structure
🔻 Trend: Bearish
📉 Price is below the 7 EMA (1.39227), confirming downward momentum.

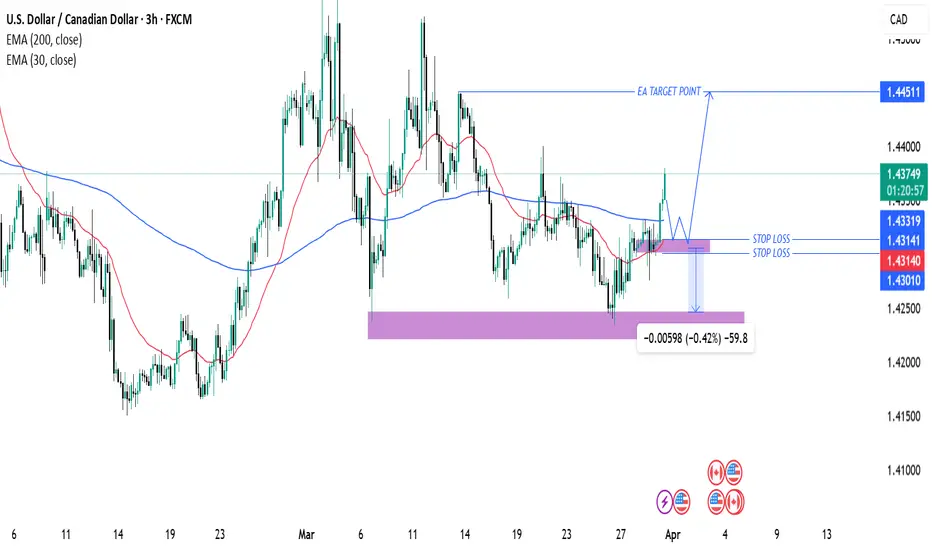
USD/CAD Bullish Trade Setup: Key Support, Entry, and Target AnalThis chart is a technical analysis of the USD/CAD currency pair on a 3-hour timeframe. Here’s a breakdown of the key elements:
Key Observations:
1. Exponential Moving Averages (EMAs):
200 EMA (Blue Line) at 1.43318 – A long-term trend indicator.
30 EMA (Red Line) at 1.43135 – A short-term trend indicator.
The price is currently trading above both EMAs, suggesting a bullish bias.
2. Support and Resistance Levels:
A support zone (purple box) around 1.43010 to 1.43141 has been identified, which the price is expected to respect.
The target level (EA TARGET POINT) is set at 1.44511, indicating a bullish price movement expectation.
3. Entry, Stop Loss & Take Profit:
Entry Point: Near the 1.43318 level (current price area).
Stop Loss: Placed below the supp
USD/CAD Bullish Breakout: Trade Hits Target Successfully200 EMA (Blue) at 1.43070: Represents long-term trend resistance.
30 EMA (Red) at 1.42660: Represents short-term trend direction.
Price has strongly surged above the 30 EMA, indicating bullish momentum.
Support and Resistance Levels:
Support Zone (Red area at the bottom): Marked near 1.42150, where the price reversed.
Target Resistance (Blue at the top) at 1.43672: Marking the expected profit zone.
Trade Setup:
Entry Point: Near the support zone at 1.42451-1.42660.
Stop Loss: Placed below 1.42150, to minimize risk.
Target Point: 1.43672, aligning with a previous resistance level.
Price Movement: A strong bullish breakout occurred, moving rapidly toward the target.
Trade Analysis:
✅ Successful Long Trade: Price moved sharply upward after consolidating at support.
📈 Momentum Confirmation: The strong bullish candles indicate aggressive buying.
🎯 Target Achieved: The trade reached the projected 1.43672 level, generating a solid risk-to-reward outcome.
Potential Future Outlook:
If the price sustains above 1.43672, further upside could be seen toward 1.44000.
If it faces resistance, a pullback toward 1.43070 (200 EMA) may occur before another move.

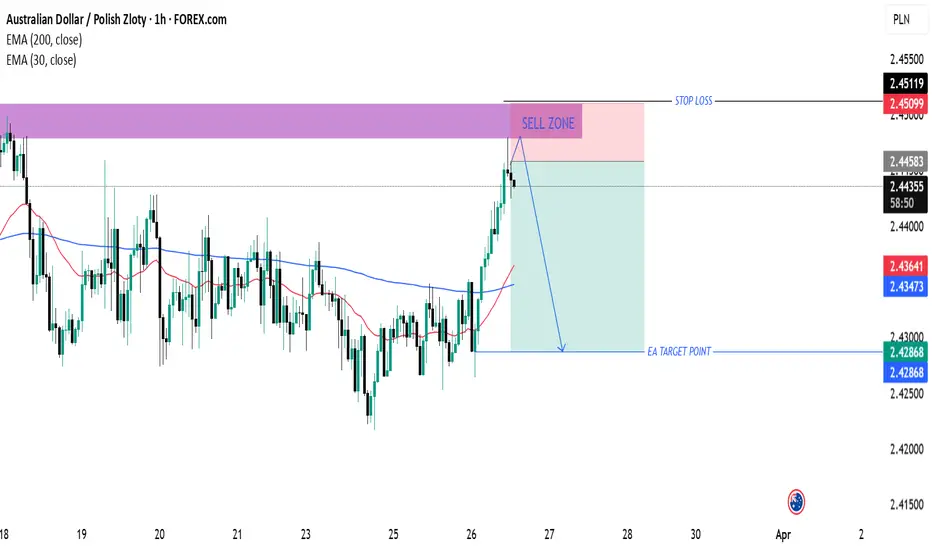
"AUD/PLN Technical Analysis – Potential Sell Setup (March 26, 20Sell Zone (Purple Area)
This area marks a strong resistance level, where price is expected to reverse downward.
Price has entered this zone, which might indicate a potential short-selling opportunity.
Stop Loss (Above Sell Zone)
The stop-loss level is set at 2.45119, just above the resistance zone.
This protects against a breakout if the price continues upward instead of reversing.
Entry Confirmation
Price action shows a sharp upward movement into the resistance area.
If price starts rejecting this zone (e.g., bearish candlestick patterns like pin bars or engulfing candles), it could confirm a sell entry.
Target Point (Blue Line at 2.42868)
The take-profit level is set at 2.42868, suggesting a downward move if price reverses.
This area might act as the next support zone.
Exponential Moving Averages (EMAs)
30 EMA (Red Line): 2.43595 (Short-term trend indicator).
200 EMA (Blue Line): 2.43464 (Long-term trend indicator).
Price is currently above both EMAs, which suggests a bullish trend, but the resistance zone might trigger a reversal.
Trading Strategy Suggestion
✅ Bearish Setup: Look for rejection signals in the sell zone before entering a short trade.
✅ Risk-Reward Ratio: The stop-loss is tight compared to the potential profit target, making it a favorable setup.
✅ Confirmation Needed: A clear bearish signal (e.g., a strong rejection candle) can increase trade confidence.
USDCAD EA MAN UPDATE >READ THE CHAPTIANKey Observations:
Support Zone & Trendline: The price is currently pulling back to a support zone, aligning with the ascending trendline, which may provide a bullish reaction.
EMA Confluence: The price is positioned above the 30 EMA (1.43193, red) and approaching the 200 EMA (1.43167, blue), indicating strengthening bullish momentum.
Target Point: If the price holds at the support and resumes its uptrend, the next target is around 1.43803 - 1.43689.
A break and close above the recent high could confirm further bullish movement towards the target zone. However, if the support fails, a deeper retracement may occu

USDCAD - EXPECTING BREAKDOWN OF CONSOLIDATIONSymbol - USDCAD
The USDCAD pair is currently consolidating within the range of 1.4485 to 1.4280 The US dollar has been experiencing negative momentum recently. However, with the Non-Farm Payroll (NFP) report upcoming, the data could either reinforce the ongoing correction or provide support to the US dollar index. Market attention is focused on today's economic announcements. If the actual NFP results fall below the forecasted 169K, expectations for a Federal Reserve rate cut are likely to strengthen.
Today, The Federal Reserve's monetary policy report will be released, potentially offering further insights into the regulator's future actions. Should the NFP data be weaker than anticipated, the US dollar may depreciate, leading to a potential decline in USDCAD. Conversely, if the data exceeds expectations, the US dollar is expected to strengthen, driving USDCAD higher. In the event that the Federal Reserve signals a potential rate cut, the US dollar could weaken, thereby supporting the Canadian dollar.
Resistance levels: 1.4345, 1.4370
Support level: 1.4280
Given the uncertainty surrounding the upcoming data, it is challenging to predict the precise market outcome. From a technical perspective, the currency pair appears weak due to the falling value of the US dollar. A break below the 1.4280 support level could signal further downside potential.

USDCAD SHOWING A GOOD DOWN MOVE WITH 1:10 RISK REWARD USDCAD SHOWING A GOOD DOWN MOVE WITH 1:10 RISK REWARD
DUE TO THESE REASON
A. its following a rectangle pattern that stocked the market
which preventing the market to move any one direction now it trying to break the strong resistant lable
B. after the break of this rectangle it will boost the market potential for break
C. also its resisting from a strong neckline the neckline also got weeker ald the price is ready to break in the outer region
all of these reason are indicating the same thing its ready for breakout BREAKOUT trading are follws good risk reward
please dont use more than one percentage of your capitalfollow risk reward and tradeing rules
that will help you to to become a bettertrader
thank you

USDCAD - SWING TRADE IDEA ON SHORT SIDESymbol - USDCAD
USDCAD is currently trading at 1.4325
I'm seeing a trading opportunity on sell side.
Shorting USDCAD pair at CMP 1.4325
I will add more quantity at 1.4350 & 1.4380, If comes. Holding with SL 1.4420
Targets I'm expecting are 1.4250 - 1.4200 & 1.4155
Disclaimer - Do not consider this as a buy/sell recommendation. I'm sharing my analysis & my trading position. You can track it for educational purposes. Thanks!

USDCAD - SWING TRADE IDEA ON SHORT SIDESymbol - USDCAD
USDCAD is currently trading at 1.3847
I'm seeing a trading opportunity on sell side.
Shorting USDCAD pair at CMP 1.3847
I will add more quantity at 1.3880, If comes. Holding with SL 1.3910
Targets I'm expecting are 1.3765 - 1.3715 & 1.3662
Disclaimer - Do not consider this as a buy/sell recommendation. I'm sharing my analysis & my trading position. You can track it for educational purposes. Thanks!

USDCAD Sell Setup R:R 1:5Reason for the trade
1. Market is in short term down trend.
2. Order block with FVG.
3.Liqudity/Inducement.
Enter the trade once CHoCH with body close with IDM line.
Plesase DYOR before entering the trade.

USDCAD R:R 1:10Wait for Trendline and Equal Highs Liquidity grab.
Then Wait for 4 Hr POI and look for CHoCH in 15 min
Then Enter the market.
Please DYOR before entering the trade
