USD/CAD Bullish Trade Setup: Key Support, Entry, and Target AnalThis chart is a technical analysis of the USD/CAD currency pair on a 3-hour timeframe. Here’s a breakdown of the key elements:
Key Observations:
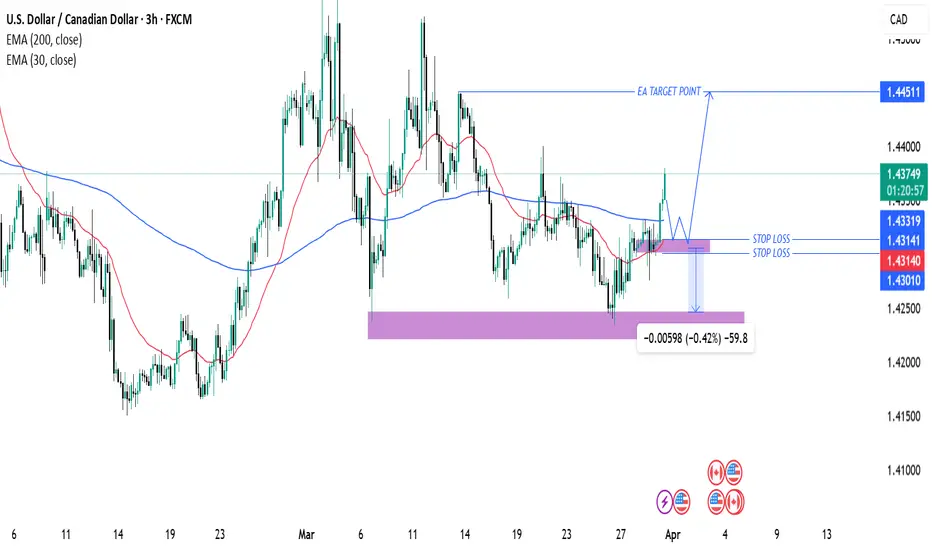
1. Exponential Moving Averages (EMAs):
200 EMA (Blue Line) at 1.43318 – A long-term trend indicator.
30 EMA (Red Line) at 1.43135 – A short-term trend indicator.
The price is currently trading above both EMAs, suggesting a bullish bias.
2. Support and Resistance Levels:
A support zone (purple box) around 1.43010 to 1.43141 has been identified, which the price is expected to respect.
The target level (EA TARGET POINT) is set at 1.44511, indicating a bullish price movement expectation.
3. Entry, Stop Loss & Take Profit:
Entry Point: Near the 1.43318 level (current price area).
Stop Loss: Placed below the supp
Usdcadsignals
USDCAD- 1DThe Dollar has been weaker for this time and thus all the dollar pairs seems to be bearish. This setup looks good for selling opportunity and aiming for 1.3370.
Note- This is my own analysis and thus not to be considered as trading signal, before making any decisions kindly do your own research, as trading is highly risky.
