USDCHF – M15 | Sell-Side Sweep → Reactive Bounce Price engineered a clean sell-side liquidity run, flushing range lows with displacement. The reaction that followed is corrective, not impulsive. What we’re seeing now is relief buying into discount, not a trend reversal.
Current bounce is unfolding inside prior inefficiency / mitigation, with structure still bearish on the execution timeframe.
Market Read
Range distribution → sharp sell-side sweep
Bounce = mitigation of bearish orderflow
No bullish displacement, only overlap
Execution Bias
Shorts favored on retracement into the marked supply / imbalance
Invalidation only on strong M15 acceptance above the green high
Targets
Recent sell-side lows
Extension into external liquidity below
Deeper discount if momentum expands
Usdchfidea

USDCHF sellCHF futures hit supply zones dollar 💵 is also seems weak so highly posible setup let's see how it goes like 📉📈

USDCHF - TREND REVERSAL CONFIRMEDSymbol - USDCHF
USDCHF is confirming a reversal of its prior downtrend and appears poised to transition into a distribution phase, supported by strength in the US Dollar Index.
The dollar is currently breaking through resistance and may continue its bullish correction within the broader long-term downtrend. Against this backdrop, the Swiss franc is gradually losing momentum.
The currency pair is exhibiting signs of a local trend breakout, with the breach of the ascending triangle’s resistance level reinforcing bullish sentiment. Within this developing distribution phase, the price may attempt to retest recent local highs.
Resistance levels: 0.8071, 0.8132
Support levels: 0.8000
A sustained consolidation above 0.8000 could establish an intermediate base, offering additional support for bullish continuation in the next upward movement.

USDCHF - MORE DOWNSIDE ON THE HORIZON?Symbol - USDCHF
CMP - 0.8228
NZDCHF continues to weaken in response to the broader decline in the US dollar. The pair is currently testing the lower boundary of its trading range. A confirmed break below this level could pave the way toward the 0.8110 level.
USDCHF is exhibiting consolidation behavior, while simultaneously developing within a local descending channel. The pair is in the process of retesting support as part of its ongoing bearish movement. A consolidation phase is forming near the 0.8190 level, suggesting a potential pre-breakdown setup. The sustained depreciation of the US dollar is exerting downward pressure on the pair.
Prior to extending the decline, the price may temporarily retest the 0.5 Fib retracement level or fill the nearby Fair Value Gap (FVG)
Resistance levels: 0.8250, 0.8275
Support levels: 0.8190, 0.8117
The prevailing downward structure is likely to remain intact unless price action breaks decisively above the descending channel. As long as the pair consolidates near the lower end of the trading range, a short-term break below support is anticipated, potentially triggering a further decline toward the 0.8110-0.8050 zone.

"USD/CHF Bearish Setup: SBR + DBD Zone Rejection Trade"🔷 Key Zone:
SBR + DBD Zone 📦
Drop-Base-Drop supply zone
Support turned resistance
Strong rejection area
🔵 Entry Point:
📍 0.81519
Right at the resistance zone
EMA (7) also acting as dynamic resistance
❌ Stop Loss:
🔺 0.82231
Above the zone for safety
Covers potential fakeouts
🎯 Target Point (Take Profit):
✅ 0.78500
Clean horizontal support
Strong RR (Reward-to-Risk) ~ 4:1
📉 Potential Move: -294.6 pips (-3.61%)
📊 Indicators & Structure:
📈 EMA (7) is sloping down = bearish pressure
🔽 Clear downtrend into the zone
📦 Supply zone aligns with trend = high confluence
🧠 Smart Trading Tips:
Wait for confirmation (like rejection wicks or bearish engulfing)
Watch out for news (economic calendar icons shown)
Stick to the plan: entry ➡️ SL ➡️ TP

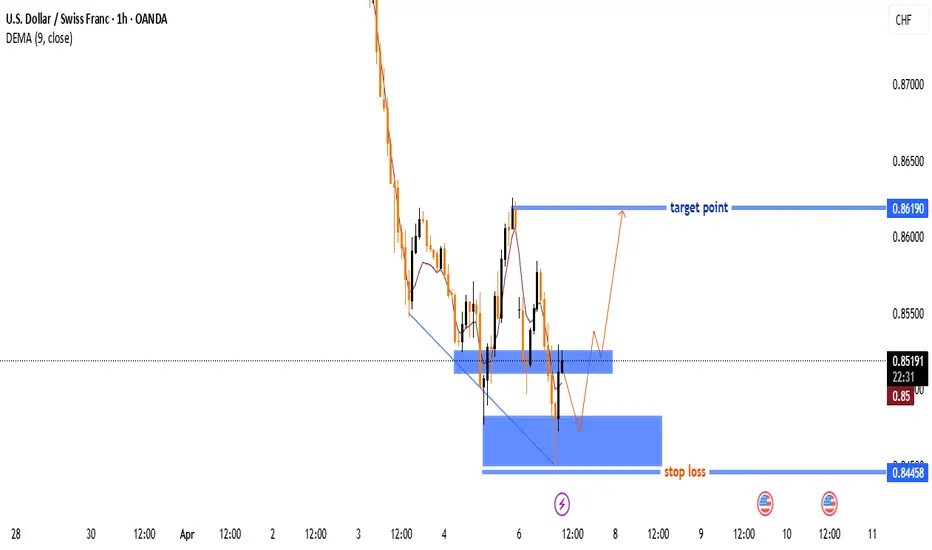
USD/CHF Trade Analysis: Potential Reversal & Bullish Setup🔻 Downtrend Phase: The price has been falling sharply, showing a strong bearish move before hitting support. 📉🔥
🟦 Support Zone (0.84458):
🔵 Key level where buyers may step in. If price holds, it could trigger a reversal. 🚀🔄
🟦 Resistance Zone (Mid-Level):
🟡 A minor barrier before price can continue higher. Expect some reaction here. ⚠️📊
🎯 Target Point (0.86190):
✅ Bullish target where price is expected to move if the support holds. 🎯💰📈
⚠️ Stop Loss (0.84458):
❌ If price breaks below this level, the trade setup is invalidated. 🚨🔻
📊 Trade Setup Summary:
✔️ Buy from support (if confirmed)
✔️ Stop Loss below 0.84458 ❌
✔️ Take Profit at 0.86190 🎯💵
🔥 Risk-Reward looks good! Watch for confirmation before entering! 🚀📊
USD/CHF 4H Analysis – Key Levels & Trade Setup🔍 Key Observations:
📌 Supply & Demand Zones:
🔴 Upper Supply Zone (~0.9000): 🔥 Strong resistance where sellers might enter.
🟠 Mid Supply Zone (~0.8850): ⚠️ Key resistance where price is testing.
🟢 Lower Demand Zone (~0.8750): ✅ Possible support where buyers could step in.
📊 Price Action:
🔼 Price is currently at 0.88230 📍 near resistance.
🔽 If rejected, it might drop ⬇️ toward 0.86531 🎯.
🔼 If buyers win, it could rise to 0.9000 🚀.
📉 Bearish Bias Expected:
❌ Rejection at 0.8850 → Drop to 0.86531 ⏳.
✅ If it breaks higher, look for 0.9000 🎯.
🔎 Final Thoughts:
⚡️ Watch for reactions at 0.8850 📍.
🔹 Bearish confirmation? Sell ➡️ 0.86531.
🔹 Bullish breakout? Buy ➡️ 0.9000.
🎯 Trade wisely! 💰📉📈

USDCHFFX:USDCHF
Hi Guys, as you can see that USDCHF has given a trendline breakout in 1D Time Frame. we can take a pull back or swing entries for down side and long term view, so plan your trade acordingly...

USDCHF - TECHNICAL STRUCTURE HINTING AT A POSSIBLE DECLINESymbol - USDCHF
The USDCHF pair recently broke its upward trend following a shift in the fundamental backdrop, with the U.S. dollar entering a corrective phase. A potential set-up is forming on the chart that could reinforce this shift. The situation remains complex due to the ongoing tariff dispute initiated by President Trump, with European nations responding in kind, resulting in heightened economic risks. Additionally, after both Trump and Federal Reserve Chairman Jerome Powell hinted at the possibility of rate cuts, the dollar began its corrective movement, which is having a favorable impact on the forex market.
From a technical perspective, the 0.9000 level is of significant importance, as it constitutes a strong zone of support and resistance. Should the bears manage to maintain the price below this level, it would confirm a shift in trend and could trigger a downward movement. USDCHF may decline to 0.8900 - 0.8700 in the medium term perspective.
Key resistance levels: 0.9000, 0.9045, 0.9065
Key support level: 0.8915
While there remains the possibility that the price may revisit the range and test the 0.5 Fibonacci retracement, both technical and fundamental factors suggest a potential decline. Attention should be focused on the 0.9000 level.

USDCHF - CONTINUATION OF BULLISH TREND?Symbol - USDCHF
The USDCHF pair is currently entering the realization phase following an extended period of correction. A favorable environment has been established by the ongoing uptrend and the strengthening of the dollar. The technical outlook on the daily timeframe is positive. After breaking through trend resistance, the price retested the previously breached level. Following a false breakout, the pair successfully consolidated above this key point, establishing an interim low and signaling potential for further gains.
From a technical perspective, attention is now focused on the resistance level at 0.9110. Should the bulls manage to surpass this zone and establish a sustained break above it, the pair could potentially rise toward 0.9180–0.9300
Resistance levels: 0.9110
Support levels: 0.9050
Prior to breaking through the resistance, the currency pair may test the support level at 0.9050, driven by liquidity beneath this area. However, a decisive move above 0.9110 could serve as the catalyst for further upward momentum.

USDCHF R:R 1:5 LONG SETUPWait for Trendline and Equal Highs Liquidity grab.
Then Wait for 4 Hr POI and look for CHoCH in 15 min
Then Enter the market.
Please DYOR before entering the trade

USDCHF 1D Timeframe ProjectionUSDCHF 1D Timeframe Projection
DXY - Data Global forecasts say it will decline. Yes, it may, but the dollar is still rising today.
DISCLAIMER: All labelling and wave counts are done by me manually and I will keep changing according to the LIVE MARKET PRICE ACTION. So don't be bias, hope on my trade plans...try to learn, and make your strategy... Following is not that easy...

USDCHFFX:USDCHF
As you can see that, USDCHF has created a Flag & pole pattern or a good Horizontal resistance, If it gives breakout we can plan for buy side. Always take retest entries. Plan your trade accordingly.....

USDCHF FX:USDCHF
As you can see that, USDCHF has created a Double bottom in 4Hr Time frame and wait for retest entry. It is for monday (31-07-23) Plan your trade accordingly.....

USDCHF 5RR Setup1) Downtrend
2) Price is Below EMA
3) Moving Down From their Strong Resistance
4) Fundamentally USDCHF Is looking Short
70% Technical 30% Fundamental
USDCHFFX:USDCHF
As you can see that usdchf has created a double top in 15 min timeframe if it breaks drawn neckline and takes retest the level then we can plan for sell side. plan your trade accordingly...

USDCHF BuyFX:USDCHF
usdchf has created a flag and pole pattern if it breaks upper side then we can plan for buying side and i am bullish in this.... plan your trade accordingly

USDCHF BuyFX:USDCHF
USDCHF has formed Double bottom and when the neck line is breaks we can go for a long position.

USDCHF Sell trade opportunitiesUSDCHF Sell trade opportunities
Its overall sell trend recently fail to the breakout resistance level and make a very strong Bearish Candle on resistance here is good opportunity to take sell wit good risk rewards
Always use Stop Loss


Weekly Based Ascending Triangle Bearish {USDCHF}All level marked on the chart.
Charts are for educational purposes. Non-advisory, discretional.

USDCHF ForecastUSDCHF Forecast
IMO
Give a Like and Feel free to share your opinions in the comment!
Happy Trading 😊

USDCHF ShortUSDCHF Short
Risk/Reward: 1:5
Give a Like and Feel free to share your opinions in the comment!
Thanks 😊
